1. AWR reports: Measuring CPU
Introduction
AWR is a wonderful tool oracle has provided for database health checkup. It deals with a
lot of things necessary to tune the database like TOP 5 wait events, SQL ordered by
elapsed time/CPU time/Buffer gets/Physical reads etc. Among other things, the most
crucial information in AWR is the amount of CPU used by the system i.e. how much of
the CPU time oracle processes took for the elapsed time. When AWR deals with time, it
deals with several kinds of time.
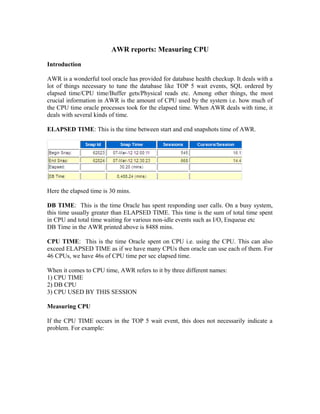
ELAPSED TIME: This is the time between start and end snapshots time of AWR.
Here the elapsed time is 30 mins.
DB TIME: This is the time Oracle has spent responding user calls. On a busy system,
this time usually greater than ELAPSED TIME. This time is the sum of total time spent
in CPU and total time waiting for various non-idle events such as I/O, Enqueue etc
DB Time in the AWR printed above is 8488 mins.
CPU TIME: This is the time Oracle spent on CPU i.e. using the CPU. This can also
exceed ELAPSED TIME as if we have many CPUs then oracle can use each of them. For
46 CPUs, we have 46s of CPU time per sec elapsed time.
When it comes to CPU time, AWR refers to it by three different names:
1) CPU TIME
2) DB CPU
3) CPU USED BY THIS SESSION
Measuring CPU
If the CPU TIME occurs in the TOP 5 wait event, this does not necessarily indicate a
problem. For example:
2. Here the CPU TIME is 35938s which is just 7.1 % of DB TIME. Even if it was high, this
might not indicate a problem. It could be that the database is busy in utilizing the CPU.
To know whether CPU TIME is a problem, we need to compare it with the available
CPU power we have. If the usage is high in comparison to total CPU power, then it is
serious problem and need to be addressed.
The formula to calculate total CPU power in seconds is:
TOTAL CPU= NUM_CPUS*ELAPSED_TIME*60, where NUM_CPUs can be found
from Operative system statistics section.
If we use this formula in our current scenario, we have:
Total CPU=46 *30*60=82800s.
So, we have 82800 seconds of CPU time for 1800 seconds of DB TIME.
Therefore, % of CPU used by Oracle processes= 35938/82800*100=43%.
This means oracle processes used 43% of total CPU power available in the system.
AWR also provides CPU consumption from OS perspective. In the Operating System
Statistics, we have BUSY TIME AND IDLE TIME.
We can calculate the % CPU busy time by the formula:
% BUSY TIME= {BUSY_TIME/ (BUSY_TIME+IDLE_TIME)}*100
= {5788280/8365936}*100
= 69%
This means that the system was overall 69% was busy utilizing the CPU.
BUSY_TIME can further be divided into SYS_TIME+USER_TIME.
BUSY_TIME=SYS_TIME+USER_TIME
3. We can also calculate % of SYS_TIME and % of USER_TIME.
% SYS_TIME = (SYS_TIME/BUSY_TIME)*100
%USER_TIME = (USER_TIME/BUSY_TIME)*100
Applying the above formula in our present case, we have:
%SYS_TIME = (1487507/5788280)*100
= 25.7%
%USER_TIME = (4300773/5788280)*100
= 74%
As we can see approx 74% of CPU was accounted for USER_TIME. But this 74% is
actually 74% of %BUSY_TIME ie 69%.
Therefore, 74% of 69% = 51%
This is the actual USER_TIME.
Similarly, for SYS_TIME 25.7% of 69%= 17.7%
This is the actual SYS_TIME.
Now if we see, CPU_TIME and USER_TIME differ by 51-43=8%.
This means, apart from oracle processes, 8% of CPU was utilized by non oracle non
system processes. It could also be that 8% of time was spent in runqueue ie waiting for
CPU
Once we find out High CPU usage is the issue, we need to find out where the maximum
CPU time is getting used. If there is high CPU, then essentially, we will have to find
where the CPU is spent, either in SQL execution or SQL Parsing.
The first thing to look at is parsing because this is a CPU-intensive operation. If the
database is doing lots of hard parse it means lack of cursor sharing resulting in thousands
of statements spreading across shared pool which only differ with literal values.
We can look for SQL statements consuming High CPU.
We can look in SQL statements ordered by CPU, SQL statements ordered by Buffer gets.
However, while examining sql statements our metric value should be per execution basis.
Once the SQL is identified then it’s easy to tune it.
A couple of caveats
Analyzing CPU usage from AWR can be tricky as well. For example, if we need to
calculate the CPU usage for a particular time lets say from 7:15 to 7:30, then to gather
CPU information from a 60 minute report is useless. Fortunately, in 10g and above,
oracle provides us with another amazing utility, the ASH which stands for active session
4. history. By using ASH, we can go to any time period we want and see how much of the
CPU was consumed for that time period.
Conclusion
AWR provides a lot of information regarding CPU utilization. But it can be tricky to get
the exact details of time spent in CPU.AWR in coordination with ASH becomes power
pact performance analyzer tool that put before us all the artifacts necessary to
troubleshoot CPU utilization issues. What differentiates CPU TIME from other wait
events is that other wait events can be measured with respect to DB TIME but CPU
TIME should be measured w .r .t. the total CPU capacity of the system.
References:
http://docs.oracle.com/cd/B19306_01/server.102/b14211/toc.htm
http://savvinov.com/2012/04/06/awr-reports-interpreting-cpu-usage/
http://dboptimizer.com/2011/07/21/oracle-cpu-time/