Westfield, MA 01085 Real Estate Market Report March 2018
•
0 likes•279 views

Lesley Lambert, Westfield REALTOR with Park Square Realty offers this real estate market report for March 2018. Learn what is happening in Westfield's real estate market. Prepared by Lesley Lambert, Westfield REALTOR.

Recommended
Recommended
More Related Content
What's hot
What's hot (18)
Similar to Westfield, MA 01085 Real Estate Market Report March 2018
Similar to Westfield, MA 01085 Real Estate Market Report March 2018 (20)
More from Lesley Lambert
More from Lesley Lambert (20)
Recently uploaded
Recently uploaded (20)
Westfield, MA 01085 Real Estate Market Report March 2018
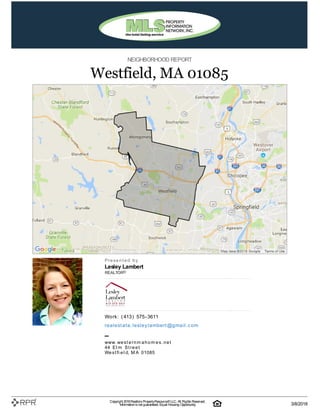
- 1. NEIGHBORHOOD REPORT Westfield, MA 01085 P| r| e| s| e| n| t| e| d| | b| y Lesley Lambert REALTOR® W| o| rk| :| | (| 413| )| | 575| -| 3611 re| a| l| e| st| a| t| e| .| l| e| sl| e| y| l| a| m| b| e| rt| @| g| m| a| i| l| .| c| o| m – w| w| w| .| w| e| s| t| e| r| n| m| a| h| o| m| e| s| .| n| e| t 44| | E| l| m| | S| t| r| e| e| t W| e| s| t| fi| e| l| d, | M| A| | 01085 Copyright 2018Realtors PropertyResource®LLC. All Rights Reserved. Informationis not guaranteed. Equal Housing Opportunity. 3/8/2018
- 3. Median Sales Price Public Records Median Sales Price Listings Sales Volume Public Records Sales Volume Listings MedianSales Price vs. Sales Volume Thischart comparesthe price trend and salesvolume for homesin an area. Home pricestypically followsales volume, with a time lag, since sales activity isthe driver behind price movements. Data Source: Public recordsand listings data Update Frequency: Monthly Neighborhood: Housing Stats and Charts 01085 Hampden County Massachusetts USA Median Estimated Home Value $236K $208K $405K $229K Estimated Home Value 12-Month Change +3.9% +4% +7.2% +1.6% Median List Price $190K $180K $390K $89.9K List Price 1-Month Change -13.3% -2.7% -2.3% -5.4% List Price 12-Month Change -5% +5.9% +8.3% +2.7% Median Home Age 55 60 59 45 Own 69% 62% 62% 64% Rent 31% 38% 38% 36% $ Value of All Buildings for which Permits Were Issued – $58.7M $1.82B $102B % Change in Permits for All Buildings – -5% +15% +2% % Change in $ Value for All Buildings – -8% +17% +7% Westfield, MA01085 Copyright 2018Realtors PropertyResource®LLC. All Rights Reserved. Informationis not guaranteed. Equal Housing Opportunity. 3/8/2018
- 4. Median List Price Listing Volume MedianListingPrice vs. Listing Volume Thischart comparesthe listing price and listing volume for homesin an area. Listing pricesoften followlisting volume, with a time lag, because supply can drive price movements. Data Source: On- and off-market listings sources Update Frequency: Monthly Sales Count By Price Range Price Range of Homes Sold Thischart showsthe distribution of homesreported sold in the past six monthswithin different price rangesin the area of your search. The amount shown for the subject property issold data where available, or the property's estimated value when salesdata are unavailable (such asa non-disclosure state) or provided in range format. Data Source: Public recordsand MLS data where licensed Update Frequency: Monthly Sales Count By Price Per Sq Ft Price per Square Foot of Homes Sold Thischart showsthe distribution of homesreported sold in the past six monthsat different pricesper square foot (living area sourced from public records). Data Source: Public recordsand MLS data where licensed Update Frequency: Monthly Westfield, MA01085 Copyright 2018Realtors PropertyResource®LLC. All Rights Reserved. Informationis not guaranteed. Equal Housing Opportunity. 3/8/2018
- 5. Sales Count By Living Area Size of Homes Sold Thischart showsthe distribution of homesreported sold in the past six monthsof different sizesin the area of your search. Data Source: Public recordsdata Update Frequency: Monthly Sales Count by Age of House Age Range of Homes Sold Thischart showsthe distribution of homesreported sold in the past six monthsof different age rangesin the area of your search. Data Source: Public recordsand MLS data where licensed Update Frequency: Monthly Sales Count by Bedroom Number of Bedrooms in Homes Sold Thischart showsthe distribution of homesreported sold in the past six months, according to the number of bedrooms, in the area of your search. Data Source: Public recordsdata Update Frequency: Monthly Westfield, MA01085 Copyright 2018Realtors PropertyResource®LLC. All Rights Reserved. Informationis not guaranteed. Equal Housing Opportunity. 3/8/2018
- 6. Neighborhood: People Stats and Charts 01085 Hampden County Massachusetts USA Population 42.3K 468K 6.71M 317M Population Density per Sq Mi – 758 860 – Population Change since 2010 +2.9% +0.8% +3.6% +2.4% Median Age 36 39 39 38 Male / Female Ratio 49% 48% 48% 49% Westfield, MA01085 Copyright 2018Realtors PropertyResource®LLC. All Rights Reserved. Informationis not guaranteed. Equal Housing Opportunity. 3/8/2018
- 7. EducationLevels of Population Thischart showsthe educational achievement levelsof adultsin an area, compared with other geographies. Data Source: U.S. CensusAmerican Community Survey via Esri, 2016 Update Frequency: Annually Westfield, MA01085 Copyright 2018Realtors PropertyResource®LLC. All Rights Reserved. Informationis not guaranteed. Equal Housing Opportunity. 3/8/2018
- 8. 01085 Populationof Childrenby Age Group Thischart showsthe distribution of the population of children by age range — from birth to 17 —in the area of your search. Data Source: U.S. Census Update Frequency: Annually 01085 Populationof Adults by Age Group Thischart showsthe distribution of the population of adultsby age range — from 18 to 75-plus—in the area of your search. Data Source: U.S. Census Update Frequency: Annually 01085 Households WithChildren Thischart showsthe distribution of householdswith children, categorized by marital status, in the area of your search. Data Source: U.S. Census Update Frequency: Annually 01085 HouseholdIncome Brackets Thischart showsannual household income levelswithin an area. Data Source: U.S. Census Update Frequency: Annually Presidential VotingPattern Thischart showshowresidentsof a county voted in the 2016 presidential election. Data Source: USElectionAtlas.org Update Frequency: Quadrennially Westfield, MA01085 Copyright 2018Realtors PropertyResource®LLC. All Rights Reserved. Informationis not guaranteed. Equal Housing Opportunity. 3/8/2018
- 9. Hampden County Massachusetts USA Unemployment Rate Thischart showsthe unemployment trend in the area of your search. The unemployment rate isan important driver behind the housing market. Data Source: Bureau of Labor Statistics Update Frequency: Monthly 01085 Occupational Categories Thischart showscategoriesof employment within an area. Data Source: U.S. Census Update Frequency: Annually Neighborhood: Economic Stats and Charts 01085 Hampden County Massachusetts USA Income Per Capita $28,471 $26,560 $36,895 $28,930 Median Household Income $62,736 $50,461 $68,563 $53,889 Unemployment Rate – 4.2% 3.1% 4.1% Unemployment Number – 9.35K 112K 6.58M Employment Number – 213K 3.51M 154M Labor Force Number – 222K 3.62M 161M Westfield, MA01085 Copyright 2018Realtors PropertyResource®LLC. All Rights Reserved. Informationis not guaranteed. Equal Housing Opportunity. 3/8/2018
- 10. 01085 Average Commute Time Thischart showsaverage commute times to work, in minutes, by percentage of an area'spopulation. Data Source: U.S. Census Update Frequency: Annually HowPeople Get to Work Thischart showsthe typesof transportation that residentsof the area you searched use for their commute. Data Source: U.S. Census Update Frequency: Annually Average Monthly Temperature Thischart showsaverage temperaturesin the area you searched. Data Source: NOAA Update Frequency: Annually Neighborhood: Quality of Life Stats and Charts Quality of Life in01085 01085 Hampden County Massachusetts USA Elevation (in feet) 675 986 517 – Annual Rainfall (in inches) 45 47.58 45.79 – Annual Snowfall (in inches) 52.44 55.02 52.84 – Days of Full Sun (per year) 83 83 83 – Travel Time to Work (in minutes) – 23 29 26 Water Quality - Health Violations – – – – Water Quality - Monitoring and Report Violations – – – – Superfund Sites 0 1 61 2,340 Brownfield Sites Yes Yes Yes Yes Westfield, MA01085 Copyright 2018Realtors PropertyResource®LLC. All Rights Reserved. Informationis not guaranteed. Equal Housing Opportunity. 3/8/2018
- 11. Walkability Scores (out of 5) Thisneighborhood or ZIP code israted for walking accessto general pointsof interest, reflected in the overall score, plusamenities(such asretail stores) and leisure (such asrestaurantsand parks). Other factorsconsidered in the scoresare street types, weather, public transportation and population density. Data Source: Maponics Update Frequency: Quarterly Overall Score 2.9 Amenity Score 2.9 LeisureScore 2.8 Westfield, MA01085 Copyright 2018Realtors PropertyResource®LLC. All Rights Reserved. Informationis not guaranteed. Equal Housing Opportunity. 3/8/2018