1. The Journal of Nutrition
Nutrient Physiology, Metabolism, and Nutrient-Nutrient Interactions
Agave Inulin Supplementation Affects the Fecal
Microbiota of Healthy Adults Participating in a
Randomized, Double-Blind, Placebo-Controlled,
Crossover Trial1–3
Hannah D Holscher,4
Laura L Bauer,5
Vishnupriya Gourineni,6
Christine L Pelkman,6
George C Fahey Jr.,5
and Kelly S Swanson5
*
Departments of 4
Food Science and Human Nutrition and 5
Animal Sciences and Division of Nutritional Sciences, University of Illinois,
Urbana, IL; and 6
Ingredion Incorporated, Bridgewater, NJ
Abstract
Background: Prebiotics resist digestion, providing fermentable substrates for select gastrointestinal bacteria associated
with health and well-being. Agave inulin differs from other inulin type fibers in chemical structure and botanical origin.
Preclinical animal research suggests these differences affect bacterial utilization and physiologic outcomes. Thus,
research is needed to determine whether these effects translate to healthy adults.
Objective: We evaluated agave inulin utilization by the gastrointestinal microbiota by measuring fecal fermentative end
products and bacterial taxa.
Methods: A randomized, double-blind, placebo-controlled, 3-period, crossover trial was undertaken in healthy adults (n 5
29). Participants consumed 0, 5.0, or 7.5 g agave inulin/d for 21 d with 7-d washouts between periods. Participants
recorded daily dietary intake; fecal samples were collected during days 16–20 of each period and were subjected to
fermentative end product analysis and 16S Illumina sequencing.
Results: Fecal Actinobacteria and Bifidobacterium were enriched (P < 0.001) 3- and 4-fold after 5.0 and 7.5 g agave inulin/d,
respectively, compared with control. Desulfovibrio were depleted 40% with agave inulin compared with control. Agave inulin
tended (P < 0.07) to reduce fecal 4-methyphenol and pH. Bivariate correlations revealed a positive association between intakes
of agave inulin (g/kcal) and Bifidobacterium (r = 0.41, P < 0.001). Total dietary fiber intake (total fiber plus 0, 5.0, or 7.5 g agave
inulin/d) per kilocalorie was positively associated with fecal butyrate (r = 0.30, P = 0.005), tended to be positively associated
with Bifidobacterium (r = 0.19, P = 0.08), and was negatively correlated with Desulfovibrio abundance (r = 20.31, P = 0.004).
Conclusions: Agave inulin supplementation shifted the gastrointestinal microbiota composition and activity in healthy adults.
Further investigation is warranted to determine whether the observed changes translate into health benefits in human
populations. This trial was registered at clinicaltrials.gov as NCT01925560. J Nutr 2015;145:2025–32.
Keywords: prebiotics, agave inulin, fiber, microbiota, bifidobacteria, butyrate
Introduction
The gastrointestinal (GI)7
microbiota plays a crucial role in
human health, affecting metabolism, physiology, and immune
function (1–3). Recent advances in sequencing technologies
have allowed researchers to gain a better understanding of
the thousands of different microbial taxa in the GI tract (4).
Increasingly, perturbations in the GI microbiota are being
associated with complex diseases, including obesity, diabetes,
cardiovascular disease, inflammatory bowel disease, and autism
(3, 5–8).
Epidemiologic evidence suggests there are inverse associa-
tions between dietary fiber intake and obesity (9), diabetes
(10, 11), and coronary heart disease (12–14). Inadequate fiber
consumption is a recognized problem in the United States (15),
with average intakes barely surpassing 50% of the Adequate
Intake recommendation (25–38 g/d) (16). Because inadequate
1
Supported in part by Global Nutrition R&D, Ingredion Incorporated, Bridgewater, NJ.
2
Author disclosures: HD Holscher, LL Bauer, GC Fahey, and KS Swanson, no
conflicts of interest. V Gourineni and CL Pelkman are employees of Global Nutrition
R&D, Ingredion, Incorporated.
3
Supplemental Tables 1–6 and Supplemental Figures 1–3 are available from the
‘‘Online Supporting Material’’ link in the online posting of the article and from the
same link in the online table of contents at http://jn.nutrition.org.
* To whom correspondences should be addressed. E-mail: ksswanso@illinois.edu.
7
Abbreviations used: BCFA, branched-chain FA; DP, degree of polymerization;
FOS, fructooligosaccharide; GI, gastrointestinal; GOS, galactooligosaccharide;
OTU, operational taxonomic unit.
ã 2015 American Society for Nutrition.
Manuscript received May 15, 2015. Initial review completed June 12, 2015. Revision accepted June 30, 2015. 2025
First published online July 22, 2015; doi:10.3945/jn.115.217331.
atUNIVERSITYOFILLINOISURBANAonSeptember1,2015jn.nutrition.orgDownloadedfrom
1.DCSupplemental.html
http://jn.nutrition.org/content/suppl/2015/07/22/jn.115.21733
Supplemental Material can be found at:
2. fiber intake is also associated with increased risk of obesity,
diabetes, and cardiovascular disease (9, 17–19), the role of fiber
in GI microbial metabolism, function, and disease prevention is
of particular interest.
Prebiotics are a promising dietary strategy by which the GI
microbiota can be modified for health promotion. Prebiotics are
selectively fermented food ingredients that promote specific
changes in the composition and/or activity of bacteria already
present within the GI tract, thus promoting host health and
well-being (20). Bacterial fermentation of prebiotics results in
production of SCFAs, lactic acid, gases (hydrogen, methane,
and carbon dioxide), and reduced luminal pH (21). SCFAs and
particularly butyrate benefit host health by regulating fluid
and electrolyte uptake, influencing epithelial cell cytokinetics
and barrier function, and exerting anti-inflammatory effects
(22–32). Inulin and fructooligosaccharides (FOSs) were shown
to promote the growth of bifidobacteria in infants and adults
(20, 33, 34). Suggested health benefits of bifidobacteria include
production of acetic and lactic acids, synthesizing B vitamins,
excreting antimicrobial substances that reduce pathogenic
bacteria, and influencing maturation of the immune system
(35–40). However, uncertainties in this field of research warrant
further study. Until recently, most studies on dietary modulation
of the GI microbiota have relied on culture-based methods or
molecular methods such as fluorescent in situ hybridization and
quantitative real-time PCR, which are restricted to specific
bacterial groups. As such, our understanding of how prebiotics
affect the entire community structure of the microbiota is
relatively unknown.
Agave inulin, which was investigated in the present study, is
composed of linear and branched fructose chains, connected
with b-2,1 and b-2,6 linkages, and a degree of polymerization
(DP) between 25 and 34 (41). In comparison, chicory inulin is
linear with b-2,1 linkages and a DP that ranges from 2 to 60
(42). In vitro experimentation has demonstrated that agave
inulin is readily fermented by bifidobacteria and lactobacilli (43,
44). In addition, rodent studies have provided evidence that the
botanical origin and chemical structure of different inulin-type
fibers (e.g., agave inulin and chicory inulin) induce variable
effects on body composition, blood cholesterol, and blood
glucose concentrations (45–47). The prebiotic effects of agave
inulin in healthy adults, however, are currently unknown.
Therefore, translational studies to investigate the influence of
agave inulin on the human GI microbiota are warranted.
Previously, our laboratory conducted a randomized, double-
blind, placebo-controlled, crossover study to assess tolerance
and utilization of agave inulin in healthy adults (48). The
primary objectives of that study were to determine GI tolerance
via subjective daily and weekly questionnaires and fermentation
profiles via 8-h breath hydrogen testing after treatment boluses.
The study demonstrated that agave inulin was well tolerated
up to 7.5 g/d and improved laxation. This report details the
secondary objectives of the study to assess 1) agave inulin
utilization by the GI microbiota through measurements of fecal
fermentation end products and 2) amplicon-based bacterial
community analysis from the same individuals.
Methods
Subjects. Healthy adults were recruited for this study via an e-mail list
server from the University of Illinois. Participants were screened to
ensure general health and to collect demographic information. The
inclusion criteria included participants 1) be 20–40 y of age; 2) have
BMI (kg/m2
) > 18.5 and < 29.5; 3) be free of metabolic and GI diseases,
with no history of such diseases; 4) avoid medications known to affect
intestinal function; 5) be free of antibiotic use for at least the past 8 wk;
6) limit alcohol consumption to 2 servings/d (e.g., <28 g ethanol/d);
7) avoid taking prebiotics or probiotics; 8) consume a moderate fiber
diet; 9) continue to consume the same dose of vitamin and/or mineral
supplements, if applicable; 10) maintain current level of physical
activity; 11) agree to keep detailed dietary and stool records; and
12) meet with study personnel weekly. Female participants were excluded
if they had menstrual cycles < 27 d or > 29 d in length, were pregnant, or
were lactating. Before study initiation, all participants voluntarily signed
a written informed consent as approved by the University of Illinois
Institutional Review Board. This study was conducted from January
2013 to May 2013 and was registered with clinicaltrials.gov as
NCT01925560.
Experimental design and treatments. This study was a randomized,
double-blind, placebo-controlled, 3-period, crossover design with 1 7-d
baseline period and 3 21-d treatment periods, followed by 1-wk
washouts between each period (Supplemental Figure 1). This experiment
was part of the tolerance study conducted by our laboratory (48). Agave
inulin (BIOAGAVE agave inulin fiber; Ingredion Incorporated) and
control treatments were provided as chocolate chews (BruceÕs Candy
Kitchen) in identical wrappers in coded boxes. Chews were formulated
to provide 0, 5.0 or 7.5 g fiber in 3 chews. Researchers and participants
were blinded to treatment codes. Study participants received instructions
on completing a detailed dietary journal from a registered dietitian
before study initiation and had weekly 1-on-1 meetings with a study
dietitian and/or dietetic interns throughout the trial to ensure record
completeness. Dietary intake data were assessed with Nutritionist Pro
(Version 5.2, 2012; Axxya Systems). Participants completed daily and
weekly GI intolerance questionnaires and stool records throughout the
study.
Stool collection and analysis. During days 16–20 of each treatment
period, participants brought 3 fresh (within 15 min of defecation) fecal
samples to the laboratory by using Commode Specimen Collection
Systems (Sage Products) on ice packs within coolers. Samples were
homogenized on arrival, a pH measurement was taken (Denver Instru-
ment), and then samples were divided into aliquots for individual ex-
periments. The samples for microbial analysis were flash-frozen in
liquid nitrogen and stored at 280°C until analysis. The aliquot for
SCFAs (acetate, propionate, butyrate), branched-chain FAs (BCFAs;
valerate, isovalerate, isobutyrate), and ammonia was immediately
acidified with 2N-HCl (10% wt:vol) and frozen at 220°C until analysis.
Phenol and indole aliquots were weighed and then stored at 220°C until
analysis.
Fecal dry matter was measured according to the methods of the
Association of Official Analytical Chemists (1984) (49). Ammonia
concentrations were determined with methods described by Chaney and
Marbach (50). Fecal SCFA and BCFA concentrations were analyzed with
GC as previously described (51). Phenol and indole concentrations were
assessed according to Flickinger et al. (52).
Fecal bacterial DNA was extracted according to the manufacturerÕs
instructions by using the PowerLyzer PowerSoil DNA Isolation Kit (MO
BIO Laboratories, Inc.) with bead beating for 20 min by using a vortex
adaptor. After extraction, a 250-bp region from the V4 region of the 16S
rRNA gene was amplified according to Caporaso et al. (53). Sequencing
was performed at the WM Keck Center for Biotechnology at the
University of Illinois by using an Illumina MiSeq2000 with the use of v3
reagents (Illumina Inc.).
High-quality (quality value > 25) sequence data derived from the
sequencing process were analyzed with QIIME 1.8.0 (54). Briefly,
sequences were clustered into operational taxonomic units (OTUs)
by using closed-reference OTU picking against the Greengenes 13_8
reference OTU database (99% similarity threshold). After quality
filtering, weighted and unweighted UniFrac distances were computed
at an even sampling depth of 33,388 sequences per sample (55, 56). To
create a visual illustration of the responses to agave inulin supplemen-
tation, bubble plots that depicted the differences in each study
participantÕs fecal Bifidobacterium proportion after 20 d of consumption
2026 Holscher et al.
atUNIVERSITYOFILLINOISURBANAonSeptember1,2015jn.nutrition.orgDownloadedfrom
3. of 5.0 and 7.5 g agave inulin/d were created by comparing each
treatment dose with the control period (0 g/d).
Statistics. Fecal fermentation end products (SCFAs, BCFAs, phenols,
indoles, and ammonia), pH, dry matter, and bacterial sequence percent-
ages were analyzed with the Mixed models procedure of SAS (version
9.3; SAS Institute, Inc.) with treatment as a fixed effect and participant
and period as random effects. Post hoc Tukey adjustments were used to
control for multiple comparisons. The UNIVARIATE procedure and
Shapiro-Wilk statistic were used to test for data normality, and log
transformations were used as needed. The Mann-Whitney test was used
when normality was not achieved with transformations. Bivariate cor-
relations (PearsonÕs r) between Bifidobacterium, Desulfovibrio, agave
inulin dosage in relation to daily caloric intake, total dietary fiber intake
(dietary fiber plus 0, 5.0, or 7.5 g agave inulin/d) in relation to daily
caloric intake, BMI, and fecal fermentation end products were assessed.
A probability of P < 0.05 was accepted as statistically significant, and P <
0.10 was considered a trend.
Results
Twenty-nine of the 30 enrolled participants completed the study.
One participant was removed from the trial because of con-
sumption of a medication restricted by the study. ParticipantÕs
baseline characteristics are listed in Supplemental Table 1.
Agave inulin up to 7.5 g/d was well tolerated with no adverse
events (48). ParticipantsÕ dietary intake and body weights did
not differ among treatment periods (P > 0.05; Supplemental
Table 2).
The fecal pH (P = 0.06) and 4-methylphenol concentration
(P = 0.07) tended to be lower after agave inulin supplementation
compared with control (Table 1).
Illumina MiSeq sequencing of the 87 fecal samples gener-
ated >10 million total sequences. Overall, 11 bacterial phyla,
94 families, and 227 genera were identified in the participants
(Supplemental Tables 3 and 4). Although a number of taxa were
identified at each National Center for Biotechnology Information
taxonomic hierarchy level, only a few accounted for the majority
at each level. Bacteroidetes and Firmicutes represented ;90% of
the sequences at the phyla level. Twelve families and 18 genera
represented >90% of the sequences. Conversely, 20 phyla,
72 families, and 188 genera made up <1% of total sequences at
each respective taxonomic level.
Agave inulin supplementation significantly shifted the rela-
tive abundance of fecal Actinobacteria compared with control
(P = 0.002; 7.5 = 5.0 > 0 g agave inulin/d) (Table 2). Compared
with control, Actinobacteria were enriched (P < 0.05; 7.5 = 5.0 >
0 g agave inulin/d) 3- and 4-fold with 5.0 and 7.5 g agave inulin/d,
respectively. These shifts were countered with nonsignificant
reductions in Proteobacteria and Bacteroidetes. The relative
abundance of the Bifidobacteriaceae family (Supplemental Table
5) and Bifidobacterium genus (Table 2) were both similarly
enriched (P < 0.001; 7.5 = 5.0 > 0 g agave inulin/d) by 3- and 4-
fold with 5.0 and 7.5 g agave inulin/d, respectively). Four species
in the Bifidobacterium genera were significantly enriched (P <
0.005; 7.5 = 5.0 > 0 g agave inulin/d) after supplementation with
5.0 and 7.5 g agave inulin/d compared with control: B. adolescentis,
B. breve, B. longum, and B. pseudolongum (Supplemental Table 6).
Two species, B. animalis and B. bifidum, were not affected by
treatment (P > 0.05). The relative abundance of the Desulfovibrio
genera was reduced (P < 0.05; 7.5 = 5.0 < 0 g agave inulin/d) by
;40% with both treatment doses of agave inulin. In addition,
the relative abundances of Lachnobacterium and Ruminococcus
were depleted (P < 0.05) with 7.5 g agave inulin/d compared
with 0 g agave inulin/d; however, 5.0 g agave inulin/d was not
different from 0 or 7.5 g agave inulin/d.
Although dietary supplementation of agave inulin resulted in a
significant increase in fecal Bifidobacterium in the treatment
groups, individual responses to the treatments were varied (Figure
1). In general, female participants were more responsive to
supplementation, demonstrating larger shifts in the abundance of
fecal Bifidobacterium than for male participants. Two women
experienced a 15% increase in fecal Bifidobacterium compared
with 0 g agave inulin/d, and 3 women demonstrated 5–10%
increases in abundance with agave inulin supplementation. Half
of the male participants demonstrated increased abundances of
#5% in fecal Bifidobacterium from the 0-g/d treatment period.
Alternatively, 5 male participants did not respond to supplemen-
tation and were essentially unaffected by agave inulin treatments
with 0–1% reductions in fecal Bifidobacterium with agave inulin
supplementation compared with control.
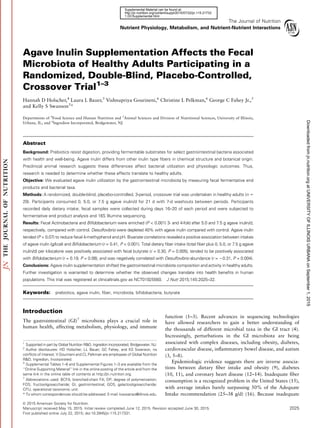
Bivariate correlations revealed a significant positive cor-
relation between Bifidobacterium and grams of agave inulin
consumed per kilocalorie (r = 0.41, P < 0.001; Figure 2A). Total
dietary fiber intake (total dietary fiber plus 0, 5.0, or 7.5 g agave
inulin/d) per kilocalorie, however, only tended to be associated
with Bifidobacterium abundance (r = 0.19, P = 0.07; Figure 2B).
Total fiber intake was positively associated with fecal butyrate
concentration (r = 0.30, P = 0.005; Figure 2C). Fecal
Faecalibacterium also was positively associated with butyrate
concentrations (r = 0.29, P = 0.007). Fecal ammonia concen-
tration tended (r = 20.21, P = 0.052) to negatively correlate with
Bifidobacterium abundance. No other significant correlations
were found between fecal fermentation end products and
Bifidobacterium. Bivariate correlations revealed several corre-
lations with Desulfovibrio abundance, including negative cor-
relations between Desulfovibrio abundance and total fiber
intake per kilocalorie (r = 20.31, P = 0.003) and fecal acetate
(r = 20.28, P = 0.009), butyrate (r = 20.23, P = 0.029), and total
SCFA (r = 20.26, P = 0.015) concentrations. Conversely,
positive correlations were found with Desulfovibrio abundance
TABLE 1 Fecal fermentation end products of healthy human
participants who consumed 0, 5.0, or 7.5 g agave inulin/d in a
crossover design1
Item
Treatment with
agave inulin
SEM P0 g/d 5.0 g/d 7.5 g/d
End product, μmol/g DM feces
Ammonia 96.2 99.7 99.7 6.78 0.82
4-Methylphenol 1.87 1.83 1.59 0.168 0.07
Indole 0.944 1.01 0.907 0.094 0.17
Isobutyrate 6.49 6.39 6.56 0.342 0.92
Isovalerate 8.25 8.37 8.45 0.437 0.92
Valerate 6.64 7.15 7.52 0.649 0.12
Total BCFAs 21.4 21.9 22.6 1.16 0.59
Acetate 237 254 262 18.7 0.12
Propionate 62.9 68.5 67.3 7.99 0.18
Butyrate 49.9 55.9 55.8 4.98 0.14
Total SCFAs 350 379 385 29.4 0.12
SCFA molar ratio
Acetate 0.684 0.681 0.686 0.009 0.68
Propionate 0.176 0.174 0.172 0.007 0.63
Butyrate 0.141 0.145 0.143 0.007 0.59
pH 6.88 6.77 6.74 0.078 0.06
1
Values are least squares means with pooled SEMs, n = 29. BCFA, branched-chain FA
(isobutyrate + isovalerate + valerate); DM, dry matter.
Prebiotic effects of agave inulin in humans 2027
atUNIVERSITYOFILLINOISURBANAonSeptember1,2015jn.nutrition.orgDownloadedfrom
4. and fecal 4-methylphenol (r = 0.29, P = 0.007) and with fecal pH
(r = 0.24, P = 0.02).
a and b diversity were also assessed and results are included
in Supplemental Figure 2 and 3, respectively.
Discussion
Prebiotics are selectively fermented ingredients that promote
specific changes in composition and/or activity of GI bacteria
(20). However, to date, the impact of prebiotics on the mi-
crobiota has relied heavily on molecular methods that investi-
gate targeted taxa instead of characterizing the entire community
structure. The present study used high-throughput sequencing
to characterize the community composition of the fecal micro-
biota. In addition, we measured fecal fermentation end pro-
ducts, thereby providing both compositional and functional
outcomes related to agave inulin fermentation by the GI micro-
biota. Our data revealed that agave inulin supplementation
enriched fecal Bifidobacterium. In addition, we found a negative
correlation between Bifidobacterium and fecal ammonia con-
centrations. The reduction in fecal pH and phenolic compounds
suggests increased saccharolytic fermentation and reduced proteo-
lytic fermentation. Because phenols and ammonia are considered
toxic to intestinal epithelial cells, our results indicate a prebiotic
effect of agave inulin supplementation.
Because Bifidobacterium are not the only bacteria able to
use inulin-type fibers and bacterial crossfeeding is particularly
important in the complex milieu of the GI tract, an ecologic
characterization of the microbiota was necessary. Although
Lactobacillus, Bacteroides, Roseburia, and Faecalibacterium
have all demonstrated the potential to degrade oligofructose in
vitro (57, 58), we found that only Bifidobacterium species were
selectively enriched in healthy adults who consumed agave
inulin. Four species of Bifidobacterium were enriched with agave
inulin supplementation, B. adolescentis, B. breve, B. longum,
and B. pseudolongum, whereas 2 others were not (e.g., B. animalis
and B. bifidum). In vitro experiments have indicated that
B. adolescentis is able to grow on FOSs and that its presence
contributed to crossfeeding by lactate utilizers, and subsequent
butyrate production (35). The presence of various b-fructofu-
ranosidase genes in several strains of these species is supportive
of these results (59–62). In addition, in vitro studies demonstrate
that B. bifidum grows on FOSs but not with inulin (63, 64) and
that a commercial probiotic strain of B. animalis was also not
able to metabolize inulin (59–62). The selective growth inhibi-
tion by B. bifidum and B. animalis may be due to the presence
of different b-fructofuranoside genes and also the structural
differences between FOSs and long-chain inulin.
The linear relation between agave inulin per kilocalorie and
Bifidobacterium provides a plausible explanation for the more
pronounced effect observed in female as opposed to male
participants because agave inulin represented a higher propor-
tion of the dietary intake of women. Dose responses were
demonstrated with short-chain FOSs, whereby 2.5 g/d did not
increase bifidobacteria counts >0 g/d, but 10 and 20 g/d increased
TABLE 2 Predominant fecal bacterial phyla and genera present
in healthy human participants who consume 0, 5.0, or 7.5 g agave
inulin/d in a crossover design1
Phylum and genus
Treatment with agave inulin,
% of sequences
Pooled SEM P0 g/d 5.0 g/d 7.5 g/d
Firmicutes 50 51 49 3.5 0.61
Faecalibacterium 12 14 14 1.6 0.40
Eubacterium 0.64 0.84 0.85 0.36 0.28
Clostridium 0.36 0.26 0.27 0.05 0.41
Ruminococcus 5.1b
3.1a,b
2.3a
0.81 ,0.01
Roseburia 1.9 1.7 1.6 0.31 0.89
Lachnospira 0.93 0.95 0.87 0.18 0.76
Coprococcus 1.5 1.5 1.5 0.26 0.93
Dialister 0.51 0.76 0.56 0.24 0.29
Dorea 0.43 0.59 0.39 0.14 0.10
Oscillospira 0.34 0.32 0.28 0.04 0.52
Blautia 2.6 2.6 2.3 0.36 0.32
Anaerostipes 0.22 0.16 0.18 0.03 0.42
Lachnobacterium 0.24b
0.07a
0.08a,b
0.06 0.02
Lactobacillus 0.01 0.02 0.05 0.03 0.18
Megamonas 0.02 0.36 0.40 0.24 0.14
Megasphaera 0.14 0.20 0.29 0.15 0.26
Phascolarctobacterium 0.13 0.15 0.14 0.04 0.87
Bacteroidetes 44 42 43 3.5 0.61
Bacteroides 31 32 32 3.5 0.93
Parabacteroides 1.9 1.7 1.4 0.10 0.66
Prevotella 7.7 5.5 6.6 2.7 0.06
Paraprevotella 0.20 0.09 0.19 0.10 0.19
Proteobacteria 3.1 2.8 2.0 0.98 0.61
Sutterella 0.80 1.1 0.92 0.16 0.41
Bilophila 0.21 0.16 0.15 0.03 0.06
Desulfovibrio 0.14b
0.08a
0.09a
0.06 0.01
Succinivibrio 0.75 0.69 0.48 0.65 0.79
Pseudomonas 0.41 0.07 0.01 0.20 0.79
Actinobacteria 1.9a
3.6b
5.1b
0.87 ,0.01
Bifidobacterium 1.7a
3.2b
4.9b
0.83 ,0.01
Collinsella 0.10 0.22 0.14 0.10 0.17
Verrucomicrobia 0.34 0.50 0.30 0.16 0.23
Akkermansia 0.34 0.50 0.30 0.16 0.23
1
Values are least squares means with pooled SEMs, n = 29. Values in a row without a
common letter are significantly different, P , 0.05.
FIGURE 1 Bubble plots show differences in the proportions of fecal Bifidobacterium as a percentage in each individual healthy adult male (M)
and female (F) participant (n = 29) after 20 d of consumption of 5.0 and 7.5 g agave inulin/d compared with the control period (0 g agave inulin/d).
The size of the bubbles is representative of the percentage differences. Black bubbles depict increased proportions, and white bubbles depict
decreased proportions of fecal Bifidobacterium after agave inulin supplementation.
2028 Holscher et al.
atUNIVERSITYOFILLINOISURBANAonSeptember1,2015jn.nutrition.orgDownloadedfrom
5. fecal bifidobacteria in healthy adults (65). Similarly, galactooli-
gosaccharide (GOS) supplementation followed a dose response
curve for enriching bifidobacteria abundance. In that case,
supplementation of 2.5 g GOSs/d did not shift fecal microbes in
healthy adults compared with control; however, doses of 5.0 and
10 g GOSs/d significantly increased fecal bifidobacteria abun-
dance (66). Host genetics may also contribute to these differen-
tial responses (67).
Previously, we reported the breath hydrogen profiles of these
same participants after a bolus of 0, 5, or 7.5 g agave inulin/d.
The results revealed an early peak (4–6 h) after agave inulin
consumption, suggesting fermentation begins more proximally
in the GI tract. Breath hydrogen profiles represent 14% of total
hydrogen produced in the gut that is subsequently perfused into
the lungs (68). By comparison, between 90% and 99% of SCFAs
are absorbed by the gut or used by the microbiota (25, 30, 69).
As such, fecal SCFAs represent residual fermentation end
products, thereby providing a potential explanation for the
numeric increase in fecal SCFAs with agave inulin supplemen-
tation. Because we previously observed a clear distinction
between agave inulin and controls during the 8-h breath
hydrogen testing, but only a numeric increase in fecal SCFAs,
this suggests that the SCFA measurements were either not
sensitive enough to detect the changes in fermentation profiles
among treatments or that there was inadequate power.
The fermentation profile in concert with the enrichment of
fecal Bifidobacterium and depletion of fecal Desulfovibrio after
agave inulin supplementation is particularly interesting. Proteo-
bacteria, including Desulfovibrio, colonize the proximal intes-
tine utilizing mono- and di-saccharides and amino acids as
primary energy sources (70). Because saccharolytic fermentation
of agave inulin begins 4 h after consumption, this suggests that
the impact of supplementation may begin more proximally in
the GI tract. Early fermentation could be affecting Desulfovibrio
by spreading saccharolytic fermentation throughout the GI
tract, thereby changing nutrient availability and environmental
FIGURE 2 Scatterplots depict rela-
tions between (A) fecal Bifidobacterium
and grams of agave inulin consumed
per kilocalorie, (B) fecal Bifidobacterium
and total fiber intake (total dietary fiber
plus 0, 5.0, or 7.5 g agave inulin/d agave
inulin) per kilocalorie, and (C) total fiber
intake (g/d) and fecal butyrate concen-
trations (mmol/g DM feces) in healthy
human participants consuming 0, 5.0, or
7.5 g agave inulin/d in a crossover
design. Statistical relations were deter-
mined with bivariate correlations (Pear-
sonÕs r), and a probability of P , 0.05
was accepted as statistically significant,
n = 29. DM, dry matter.
Prebiotic effects of agave inulin in humans 2029
atUNIVERSITYOFILLINOISURBANAonSeptember1,2015jn.nutrition.orgDownloadedfrom
6. conditions along the way. The numeric reduction in the proteo-
lytic fermentation end product, 4-methylphenol, is also supportive
of this hypothesis. Desulfovibrio is a sulfate-reducing bacteria
that uses substrates, including SCFAs and amino acids, to reduce
sulfur-containing compounds to hydrogen sulfide, a potential
toxin to GI epithelial cells (71, 72). Increased proportions of
sulfate-reducing bacteria were noted in individuals with inflam-
matory bowel disease and autism (7, 8, 73–75). Furthermore,
individuals with autism were found to have both increased
abundances of Desulfovibrio and decreased abundances of
Bifidobacterium (7, 8, 76). Although the underlying mechanisms
of these bacterial shifts in diseased individuals remain unclear,
the potential application of agave inulin as a therapeutic agent in
individuals with these diseases warrants further investigation.
Our data support the Institute of MedicineÕs recommenda-
tion to consume a high-fiber diet from a variety of sources.
Although we did not detect a significant treatment effect of
agave inulin supplementation alone, total dietary fiber intake
(dietary fiber plus 0, 5.0, and 7.5 g agave inulin/d) was positively
correlated with fecal butyrate. The benefits of increased SCFA
concentrations and particularly increased butyrate include local
and systemic effects. Luminal effects of butyrate include
provision of energy for intestinal epithelial cells and effects on
enterocyte cell cycle progression, differentiation, and apoptosis
via histone deacetylase inhibition; systemically, butyrate was
shown to provide immune-modulating functions, influence
cholesterol biosynthesis, and improve insulin resistance (23,
24, 26–28, 69, 77, 78).
To our knowledge, this is the first study to use high-
throughput sequencing to demonstrate a specific enrichment of
fecal Bifidobacterium after agave inulin supplementation in
healthy adults. The selectivity of other prebiotic fibers was
demonstrated in clinical trials by using high-throughput se-
quencing. Davis et al. (66) reported that 5.0 and 10.0 g GOSs/d
specifically enriched fecal Bifidobacterium. Resistant starches
also were reported to have differential effects on the fecal
microbiota. Resistant starch type 4 was previously found to
enrich Bifidobacterium, whereas resistant starch type 2 selec-
tively enriched Eubacterium (79). Other fermentable fibers also
have demonstrated more nonspecific shifts, including polydex-
trose and soluble corn fiber, which were found to enrich several
genera in both the Firmicutes and Bacteroides phyla (80, 81).
The chemical structures of these fibers and the complex GI
ecosystem, which provides residence to diverse microbes capable
of crossfeeding, should be considered in light of this. Agave
inulin is composed of a terminal glucose monosaccharide with
linear and branched fructose chains connected with b-2,1 and
b-2,6 linkages, and a DP ranging from 25 to 34 (42). GOSs
typically contain a terminal glucose with a b-1,4 linkage to
galactose polymers linked by b-1,6 covalent bonds; DP generally
ranges between 2 and 10 (82). Resistant starch type 2 and type 4
are composed of glucose monomers with a-1,6 glycosidic bonds,
with the additional crosslink by phosphorylation of type 4 resistant
starches (79). Polydextrose is a highly branched polysaccharide
that consists of glucose units linked by a- and b-linked 1,2, 1,3,
1,4, and 1,6 linkages (83). Soluble corn fiber is an oligosaccharide-
rich corn starch fraction enriched in a-1,6-glycosidic bonds (84).
The distinct molecular structures of these fibers provide a par-
tial explanation for the differences in microbial shifts after
supplementation.
Study strengths include the crossover design with washouts,
dietary record collection, utilization of state-of-the-art se-
quencing technology and bioinformatics tools, and assessment
of digestive physiologic outcomes. We, however, acknowledge
potential limitations, including the lack of biomedical measures
such as blood glucose, cholesterol, and TGs. In addition, we
aimed to characterize the impact of fiber supplementation on the
entire community structure of the fecal microbiota; therefore, a
more in-depth examination of the species and strains affected by
agave inulin were outside the scope of this research and should
be investigated in future studies. Next steps should include
assessment of microbial functional capacity and activity through
measurement of mRNA or protein expression and further
assessment of untargeted bacterial metabolites. Additional
characterization of bacterial crossfeeding via in vitro models
and computational simulations will also help advance our
understanding of the role of diet on the microbiome. Because
rodent studies have provided evidence for the benefits of agave
inulin supplementation on body composition, blood cholesterol,
and blood glucose concentrations (45–47), further investigation
is warranted to determine whether these effects translate into
health benefits in human populations.
Acknowledgments
We thank Rob Knight for providing sequencing primers;
Amanda Ayers, Jamie Doligale, Brooke Pfest, and Leila Shinn
for their assistance with dietary data collection and analysis;
Alison Beloshapka, Mindy Bozych, Ping Deng, and Maria
Cattai de Godoy for their technical support; and Heather
Guetterman for her input on microbial metabolism. HDH, VG,
CLP, GCF, and KSS designed the research; VG and CLP
provided essential materials; HDH and LLB conducted the
experiments; HDH analyzed the data; HDH and KSS wrote the
paper; KSS had primary responsibility for final content. All
authors read and approved the final manuscript.
References
1. Jumpertz R, Le DS, Turnbaugh PJ, Trinidad C, Bogardus C, Gordon JI,
Krakoff J. Energy-balance studies reveal associations between gut
microbes, caloric load, and nutrient absorption in humans. Am J Clin
Nutr 2011;94:58–65.
2. Goldsmith JR, Sartor RB. The role of diet on intestinal microbiota
metabolism: downstream impacts on host immune function and health,
and therapeutic implications. J Gastroenterol 2014;49:785–98.
3. Wang Z, Klipfell E, Bennett BJ, Koeth R, Levison BS, DuGar B,
Feldstein AE, Britt EB, Fu X, Chung Y. Gut flora metabolism of
phosphatidylcholine promotes cardiovascular disease. Nature
2011;472:57–63.
4. Human Microbiome Project Consortium. Structure, function and
diversity of the healthy human microbiome. Nature 2012;486:207–14.
5. Greenblum S, Turnbaugh PJ, Borenstein E. Metagenomic systems
biology of the human gut microbiome reveals topological shifts
associated with obesity and inflammatory bowel disease. Proc Natl
Acad Sci USA 2012;109:594–9.
6. Qin J, Li Y, Cai Z, Li S, Zhu J, Zhang F, Liang S, Zhang W, Guan Y,
Shen D. A metagenome-wide association study of gut microbiota in type
2 diabetes. Nature 2012;490:55–60.
7. De Angelis M, Piccolo M, Vannini L, Siragusa S, De Giacomo A,
Serrazzanetti DI, Cristofori F, Guerzoni ME, Gobbetti M, Francavilla R.
Fecal microbiota and metabolome of children with autism and pervasive
developmental disorder not otherwise specified. PLoS One 2013;8:
e76993.
8. Finegold SM, Dowd SE, Gontcharova V, Liu C, Henley KE, Wolcott
RD, Youn E, Summanen PH, Granpeesheh D, Dixon D. Pyrosequencing
study of fecal microflora of autistic and control children. Anaerobe
2010;16:444–53.
9. Liu S, Willett WC, Manson JE, Hu FB, Rosner B, Colditz G. Relation
between changes in intakes of dietary fiber and grain products and
changes in weight and development of obesity among middle-aged
women. Am J Clin Nutr 2003;78:920–7.
2030 Holscher et al.
atUNIVERSITYOFILLINOISURBANAonSeptember1,2015jn.nutrition.orgDownloadedfrom
7. 10. Schulze MB, Liu S, Rimm EB, Manson JE, Willett WC, Hu FB. Glycemic
index, glycemic load, and dietary fiber intake and incidence of type 2 diabetes
in younger and middle-aged women. Am J Clin Nutr 2004;80:348–56.
11. Montonen J, Knekt P, Jarvinen R, Aromaa A, Reunanen A. Whole-grain
and fiber intake and the incidence of type 2 diabetes. Am J Clin Nutr
2003;77:622–9.
12. Wolk A, Manson JE, Stampfer MJ, Colditz GA, Hu FB, Speizer FE,
Hennekens CH, Willett WC. Long-term intake of dietary fiber and
decreased risk of coronary heart disease among women. JAMA
1999;281:1998–2004.
13. Kromhout D, Bosschieter E, Coulander CDL. Dietary fibre and 10-year
mortality from coronary heart disease, cancer, and all causes. The
Zutphen Study. Lancet 1982;2:518–22.
14. Streppel MT, Ocke MC, Boshuizen HC, Kok FJ, Kromhout D. Dietary
fiber intake in relation to coronary heart disease and all-cause mortality
over 40 y: the Zutphen Study. Am J Clin Nutr 2008;88:1119–25.
15. US Department of Agriculture and US Department of Health and
Human Services. Dietary guidelines for Americans. Washington (DC):
US Government Printing Office; 2010.
16. King DE, Mainous, III AG, Lambourne CA. Trends in dietary fiber intake
in the United States, 1999–2008. J Acad Nutr Diet 2012;112:642–8.
17. Cho SS, Qi L, Fahey GC, Klurfeld DM. Consumption of cereal fiber,
mixtures of whole grains and bran, and whole grains and risk reduction
in type 2 diabetes, obesity, and cardiovascular disease. Am J Clin Nutr
2013;98:594–619.
18. Trock B, Lanza E, Greenwald P. Dietary fiber, vegetables, and colon
cancer: critical review and meta-analyses of the epidemiologic evidence.
J Natl Cancer Inst 1990;82:650–61.
19. Ludwig DS, Pereira MA, Kroenke CH, Hilner JE, Van Horn L, Slattery
ML, Jacobs DR, Jr. Dietary fiber, weight gain, and cardiovascular
disease risk factors in young adults. JAMA 1999;282:1539–46.
20. Gibson GR, Scott KP, Rastall RA, Tuohy KM, Hotchkiss A, Dubert-
Ferrandon A, Gareau M, Murphy EF, Saulnier D, Loh G. Dietary
prebiotics: current status and new definition. Food Sci Technol Bull
Funct Foods. 2010;7:1–19.
21. Cummings JH. Short chain fatty acids in the human colon. Gut
1981;22:763–79.
22. Berni Canani R, Di Costanzo M, Leone L. The epigenetic effects of
butyrate: potential therapeutic implications for clinical practice. Clin
Epigenetics 2012;4:4.
23. Canani RB, Costanzo M, Leone L, Pedata M, Meli R, Calignano A.
Potential beneficial effects of butyrate in intestinal and extraintestinal
diseases. World J Gastroenterol 2011;17:1519–28.
24. Chen YX, Fang JY, Lu J, Qiu DK. Regulation of histone acetylation on
the expression of cell cycle-associated genes in human colon cancer cell
lines. Zhonghua Yi Xue Za Zhi 2004;84:312–7.
25. Binder HJ, Mehta P. Short-chain fatty acids stimulate active sodium and
chloride absorption in vitro in the rat distal colon. Gastroenterology
1989;96:989–96.
26. Comalada M, Bailon E, de Haro O, Lara-Villoslada F, Xaus J, Zarzuelo
A, Galvez J. The effects of short-chain fatty acids on colon epithelial
proliferation and survival depend on the cellular phenotype. J Cancer
Res Clin Oncol 2006;132:487–97.
27. Davie JR. Inhibition of histone deacetylase activity by butyrate. J Nutr
2003;133:2485S–93S.
28. Lu¨hrs H, Gerke T, Mu¨ller J, Melcher R, Schauber J, Boxberger F,
Scheppach W, Menzel T. Butyrate inhibits NF-kB activation in lamina
propria macrophages of patients with ulcerative colitis. Scand J
Gastroenterol 2002;37:458–66.
29. Rabbani GH, Albert MJ, Rahman H, Chowdhury AK. Short-chain fatty
acids inhibit fluid and electrolyte loss induced by cholera toxin in
proximal colon of rabbit in vivo. Dig Dis Sci 1999;44:1547–53.
30. Scheppach W. Effects of short chain fatty acids on gut morphology and
function. Gut 1994;35:S35–8.
31. Schwab M, Reynders V, Loitsch S, Steinhilber D, Stein J, Schro¨der O.
Involvement of different nuclear hormone receptors in butyrate-mediated
inhibition of inducible NFkB signalling. Mol Immunol 2007;44:3625–32.
32. Schaafsma G, Slavin JL. Significance of inulin fructans in the human
diet. Compr Rev Food Sci Food Safety. 2015;14:37–47.
33. Holscher HD, Faust KL, Czerkies LA, Litov R, Ziegler EE, Lessin H,
Hatch T, Sun S, Tappenden KA. Effects of prebiotic-containing infant
formula on gastrointestinal tolerance and fecal microbiota in a randomized
controlled trial. JPEN J Parenter Enteral Nutr 2012;36 1 Suppl:95S–105S.
34. Brownawell AM, Caers W, Gibson GR, Kendall CW, Lewis KD, Ringel
Y, Slavin JL. Prebiotics and the health benefits of fiber: current
regulatory status, future research, and goals. J Nutr 2012;142:962–74.
35. Belenguer A, Duncan SH, Calder AG, Holtrop G, Louis P, Lobley GE,
Flint HJ. Two routes of metabolic cross-feeding between Bifidobacte-
rium adolescentis and butyrate-producing anaerobes from the human
gut. Appl Environ Microbiol 2006;72:3593–9.
36. Dong P, Yang Y, Wang W. The role of intestinal bifidobacteria on immune
system development in young rats. Early Hum Dev 2010;86:51–8.
37. L´opez P, Gonz´alez-Rodr´ıguez I, Gueimonde M, Margolles A, Su´arez A.
Immune response to Bifidobacterium bifidum strains support Treg/Th17
plasticity. PLoS One 2011;6:e24776.
38. Menard O, Butel MJ, Gaboriau-Routhiau V, Waligora-Dupriet AJ.
Gnotobiotic mouse immune response induced by Bifidobacterium sp.
strains isolated from infants. Appl Environ Microbiol 2008;74:660–6.
39. Santacruz A, Collado MC, Garcia-Vald´es L, Segura MT, Martin-Lagos
JA, Anjos T, Marti-Romero M, Lopez RM, Florido J, Campoy C, Sanz
Y. Gut microbiota composition is associated with body weight, weight
gain and biochemical parameters in pregnant women. Br J Nutr
2010;104:83–92.
40. Ventura M, Turroni F, Bottacini F, Giubellini V, van Sinderen D.
Bifidobacterial ecology and comparative genomics: perspectives. Bifi-
dobacteria Genomics Molbi Aspects 2010:31.
41. Lopez MG, Mancilla-Margalli NA, Mendoza-Diaz G. Molecular
structures of fructans from Agave tequilana Weber var. azul. J Agric
Food Chem 2003;51:7835–40.
42. Roberfroid MB, Van Loo JA, Gibson GR. The bifidogenic nature of
chicory inulin and its hydrolysis products. J Nutr 1998;128:11–9.
43. Allsopp P, Possemiers S, Campbell D, Oyarz´abal IS, Gill C, Rowland I.
An exploratory study into the putative prebiotic activity of fructans
isolated from Agave angustifolia and the associated anticancer activity.
Anaerobe 2013;22:38–44.
44. Gomez E, Tuohy K, Gibson G, Klinder A, Costabile A. In vitro
evaluation of the fermentation properties and potential prebiotic
activity of Agave fructans. J Appl Microbiol 2010;108:2114–21.
45. M´arquez-Aguirre AL, Camacho-Ru´ız RM, Arriaga-Alba M, Padilla-
Camberos E, Kirchmayr MR, Blasco JL, Gonz´alez- ´Avila M. Effects of
Agave tequilana fructans with different degree of polymerization
profiles on body weight, blood lipids and fecal Lactobacilli/
Bifidobacteria in obese mice. Food Funct 2013;4:1237–44.
46. Rend´on-Huerta JA, Ju´arez-Flores B, Pinos-Rodr´ıguez JM, Aguirre-Rivera
JR, Delgado-Portales RE. Effects of different sources of fructans on body
weight, blood metabolites and fecal bacteria in normal and obese non-
diabetic and diabetic rats. Plant Foods Hum Nutr 2012;67:64–70.
47. Ur´ıas-Silvas JE, Cani PD, Delm´ee E, Neyrinck A, L´opez MG, Delzenne
NM. Physiological effects of dietary fructans extracted from Agave
tequilana Gto and Dasylirion spp. Br J Nutr 2008;99:254–61.
48. Holscher HD, Doligale JL, Bauer LL, Gourineni V, Pelkman CL, Fahey
GC, Swanson KS. Gastrointestinal tolerance and utilization of agave
inulin by healthy adults. Food Funct 2014;5:1142–9.
49. Association of Official Analytical Chemists. Official methods of
analysis. Washington (DC): AOAC; 1984.
50. Chaney AL, Marbach EP. Modified reagents for determination of urea
and ammonia. Clin Chem 1962;8:130–2.
51. Boler BM, Serao MC, Bauer LL, Staeger MA, Boileau TW, Swanson KS,
Fahey GC, Jr. Digestive physiological outcomes related to polydextrose
and soluble maize fibre consumption by healthy adult men. Br J Nutr
2011;106:1864–71.
52. Flickinger EA, Schreijen EM, Patil AR, Hussein HS, Grieshop CM,
Merchen NR, Fahey GC, Jr. Nutrient digestibilities, microbial popula-
tions, and protein catabolites as affected by fructan supplementation of
dog diets. J Anim Sci 2003;81:2008–18.
53. Caporaso JG, Lauber CL, Walters WA, Berg-Lyons D, Huntley J, Fierer
N, Owens SM, Betley J, Fraser L, Bauer M. Ultra-high-throughput
microbial community analysis on the Illumina HiSeq and MiSeq
platforms. ISME J 2012;6:1621–4.
54. Caporaso JG, Kuczynski J, Stombaugh J, Bittinger K, Bushman FD,
Costello EK, Fierer N, Pena AG, Goodrich JK, Gordon JI. QIIME
allows analysis of high-throughput community sequencing data. Nat
Methods 2010;7:335–6.
55. Bokulich NA, Subramanian S, Faith JJ, Gevers D, Gordon JI, Knight R,
Mills DA, Caporaso JG. Quality-filtering vastly improves diversity estimates
from Illumina amplicon sequencing. Nat Methods 2013;10:57–9.
Prebiotic effects of agave inulin in humans 2031
atUNIVERSITYOFILLINOISURBANAonSeptember1,2015jn.nutrition.orgDownloadedfrom
8. 56. Lozupone C, Lladser ME, Knights D, Stombaugh J, Knight R. UniFrac:
an effective distance metric for microbial community comparison. ISME
J 2011;5:169–72.
57. Ramirez-Farias C, Slezak K, Fuller Z, Duncan A, Holtrop G, Louis P.
Effect of inulin on the human gut microbiota: stimulation of Bifido-
bacterium adolescentis and Faecalibacterium prausnitzii. Br J Nutr
2009;101:541–50.
58. De Vuyst L, Leroy F. Cross-feeding between bifidobacteria and butyrate-
producing colon bacteria explains bifdobacterial competitiveness,
butyrate production, and gas production. Int J Food Microbiol
2011;149:73–80.
59. Muramatsu K, Onodera S, Kikuchi M, Shiomi N. Purification and some
properties of b-fructofuranosidase from Bifidobacterium adolescentis
G1. Biosci Biotechnol Biochem 1993;57:1681–5.
60. Falony G, Verschaeren A, De Bruycker F, De Preter V, Verbeke K, Leroy F,
De Vuyst L. In vitro kinetics of prebiotic inulin-type fructan fermentation
by butyrate-producing colon bacteria: implementation of online gas
chromatography for quantitative analysis of carbon dioxide and hydrogen
gas production. Appl Environ Microbiol 2009;75:5884–92.
61. Ryan SM, Fitzgerald GF, van Sinderen D. Transcriptional regulation
and characterization of a novel beta-fructofuranosidase-encoding gene
from Bifidobacterium breve UCC2003. Appl Environ Microbiol
2005;71:3475–82.
62. Van der Meulen R, Avonts L, De Vuyst L. Short fractions of
oligofructose are preferentially metabolized by Bifidobacterium ani-
malis DN-173 010. Appl Environ Microbiol 2004;70:1923–30.
63. Falony G, Calmeyn T, Leroy F, De Vuyst L. Coculture fermentations of
Bifidobacterium species and Bacteroides thetaiotaomicron reveal a
mechanistic insight into the prebiotic effect of inulin-type fructans. Appl
Environ Microbiol 2009;75:2312–9.
64. Rossi M, Corradini C, Amaretti A, Nicolini M, Pompei A, Zanoni S,
Matteuzzi D. Fermentation of fructooligosaccharides and inulin by
bifidobacteria: a comparative study of pure and fecal cultures. Appl
Environ Microbiol 2005;71:6150–8.
65. Bouhnik Y, Vahedi K, Achour L, Attar A, Salfati J, Pochart P, Marteau P,
Flourie B, Bornet F, Rambaud JC. Short-chain fructo-oligosaccharide
administration dose-dependently increases fecal bifidobacteria in
healthy humans. J Nutr 1999;129:113–6.
66. Davis LM, Mart´ınez I, Walter J, Goin C, Hutkins RW. Barcoded
pyrosequencing reveals that consumption of galactooligosaccharides
results in a highly specific bifidogenic response in humans. PLoS One
2011;6:e25200.
67. Goodrich JK, Waters JL, Poole AC, Sutter JL, Koren O, Blekhman R,
Beaumont M, Van Treuren W, Knight R, Bell JT. Human genetics shape
the gut microbiome. Cell 2014;159:789–99.
68. Levitt MD. Production and excretion of hydrogen gas in man. N Engl J
Med 1969;281:122–7.
69. Ruppin H, Bar-Meir S, Soergel KH, Wood CM, Schmitt MG, Jr.
Absorption of short-chain fatty acids by the colon. Gastroenterology
1980;78:1500–7.
70. Kamada N, Chen GY, Inohara N, N´un˜ez G. Control of pathogens and
pathobionts by the gut microbiota. Nat Immunol 2013;14:685–90.
71. Scanlan PD, Shanahan F, Marchesi JR. Culture-independent analysis
of desulfovibrios in the human distal colon of healthy, colorectal
cancer and polypectomized individuals. FEMS Microbiol Ecol
2009;69:213–21.
72. Huycke MM, Gaskins HR. Commensal bacteria, redox stress, and
colorectal cancer: mechanisms and models. Exp Biol Med (Maywood)
2004;229:586–97.
73. Frank DN, Robertson CE, Hamm CM, Kpadeh Z, Zhang T, Chen H,
Zhu W, Sartor RB, Boedeker EC, Harpaz N. Disease phenotype and
genotype are associated with shifts in intestinal-associated microbiota in
inflammatory bowel diseases. Inflamm Bowel Dis 2011;17:179–84.
74. Gibson G, Cummings J, Macfarlane G. Growth and activities of
sulphate-reducing bacteria in gut contents of healthy subjects and
patients with ulcerative colitis. FEMS Microbiol Lett 1991;86:103–11.
75. Christl SU, Scheppach W, Kasper H. Hydrogen metabolism in the large
intestine–physiology and clinical implications. Z Gastroenterol
1995;33:408–13.
76. Heberling CA, Dhurjati PS, Sasser M. Hypothesis for a systems
connectivity model of autism spectrum disorder pathogenesis: Links
to gut bacteria, oxidative stress, and intestinal permeability. Med
Hypotheses 2013;80:264–70.
77. Alvaro A, Sola R, Rosales R, Ribalta J, Anguera A, Masana L, Vallv´e
JC. Gene expression analysis of a human enterocyte cell line reveals
downregulation of cholesterol biosynthesis in response to short-chain
fatty acids. IUBMB Life 2008;60:757–64.
78. Gao Z, Yin J, Zhang J, Ward RE, Martin RJ, Lefevre M, Cefalu WT, Ye
J. Butyrate improves insulin sensitivity and increases energy expenditure
in mice. Diabetes 2009;58:1509–17.
79. Mart´ınez I, Kim J, Duffy PR, Schlegel VL, Walter J. Resistant starches
types 2 and 4 have differential effects on the composition of the fecal
microbiota in human subjects. PLoS One 2010;5:e15046.
80. Hooda S, Boler BMV, Serao MCR, Brulc JM, Staeger MA, Boileau TW,
Dowd SE, Fahey GC, Swanson KS. 454 pyrosequencing reveals a shift in
fecal microbiota of healthy adult men consuming polydextrose or
soluble corn fiber. J Nutr 2012;142:1259–65.
81. Holscher HD, Caporaso JG, Hooda S, Brulc JM, Fahey GC, Jr.,
Swanson KS. Fiber supplementation influences phylogenetic structure
and functional capacity of the human intestinal microbiome: follow-up
of a randomized controlled trial. Am J Clin Nutr 2015;101:55–64.
82. Angus F, Smart S, Shortt C. Prebiotic ingredients with emphasis on
galactooligosaccharides and fructo-oligosaccharides. In: Tamime AY,
editor. Probiotic dairy products. New York: Blackwell Publishing; 2005.
P.120–37.
83. Lahtinen SJ, Knoblock K, Drakoularakou A, Jacob M, Stowell J,
Gibson GR, Ouwehand AC. Effect of molecule branching and glyco-
sidic linkage on the degradation of polydextrose by gut microbiota.
Biosci Biotechnol Biochem 2010;74:2016–21.
84. Knapp BK, Bauer LL, Swanson KS, Tappenden KA, Fahey GC,
De Godoy MR. Soluble fiber dextrin and soluble corn fiber supplemen-
tation modify indices of health in cecum and colon of Sprague-Dawley
rats. Nutrients 2013;5:396–410.
2032 Holscher et al.
atUNIVERSITYOFILLINOISURBANAonSeptember1,2015jn.nutrition.orgDownloadedfrom