Visible spectra of (474640) 2004 VN112–2013 RF98 with OSIRIS at the 10.4 m GT...
apj_782_2_102
1. The Astrophysical Journal, 782:102 (14pp), 2014 February 20 doi:10.1088/0004-637X/782/2/102
C 2014. The American Astronomical Society. All rights reserved. Printed in the U.S.A.
XMM-NEWTON AND CHANDRA OBSERVATIONS OF THE EJECTA-DOMINATED MIXED-MORPHOLOGY
GALACTIC SUPERNOVA REMNANT G352.7−0.1
Thomas G. Pannuti1
, Oleg Kargaltsev2
, Jared P. Napier1
, and Derek Brehm2
1 Space Science Center, Department of Earth and Space Sciences, 235 Martindale Drive, Morehead State University, Morehead, KY 40351, USA;
t.pannuti@moreheadstate.edu, jpnapier@moreheadstate.edu
2 Department of Physics, 308 Samson Hall, George Washington University, Washington, DC 20052, USA; kargaltsev@gwu.edu, brehm.derek@gmail.com
Received 2013 December 6; accepted 2013 December 30; published 2014 February 4
ABSTRACT
We present a spatial and spectral X-ray analysis of the Galactic supernova remnant (SNR) G352.7−0.1 using archival
data from observations made with the XMM-Newton X-ray Observatory and the Chandra X-ray Observatory. Prior
X-ray observations of this SNR had revealed a thermal center-filled morphology that contrasts with a shell-like
radio morphology, thus establishing G352.7−0.1 as a member of the class of Galactic SNRs known as mixed-
morphology SNRs (MMSNRs). Our study confirms that the X-ray emission comes from the SNR interior and must
be ejecta dominated. Spectra obtained with XMM-Newton may be fit satisfactorily with a single thermal component
(namely a non-equilibrium ionization component with enhanced abundances of silicon and sulfur). In contrast,
spectra extracted by Chandra from certain regions of the SNR cannot always be fit by a single thermal component.
For those regions, a second thermal component with solar abundances or two thermal components with different
temperatures and thawed silicon and sulfur abundances (respectively) can generate a statistically acceptable fit.
We argue that the former scenario is more physically plausible: on the basis of parameters of our spectral fits, we
calculate physical parameters including X-ray emitting mass (∼45 M for solar abundances). We find no evidence
for overionization in the X-ray emitting plasma associated with the SNR: this phenomenon has been seen in other
MMSNRs. We have conducted a search for a neutron star within the SNR by using a hard (2–10 keV) Chandra
image but could not identify a firm candidate. We also present (for the first time) the detection of infrared emission
from this SNR as detected at 24 μm by the MIPS on board Spitzer. Finally, we discuss the properties of G352.7−0.1
in the context of other ejecta-dominated MMSNRs.
Key words: ISM: individual objects (SNR G352.7−0.1) – ISM : supernova remnants – X-rays: ISM
Online-only material: color figures
1. INTRODUCTION
The term “supernova remnant” (SNR) refers to the expanding
shell of material produced by a supernova explosion. SNRs are
typically composed of stellar ejecta mixed with swept-up in-
terstellar material (the latter component tends to dominate over
the former component as the SNR ages). SNRs are intimately
involved with many processes associated with the interstellar
medium (ISM), such as chemical evolution (through the enrich-
ment of heavy element content) and cosmic-ray acceleration.
SNRs have also been detected over a remarkably broad portion
of the electromagnetic spectrum ranging from low-energy radio
emission (synchrotron radiation) to TeV γ rays. The observed
high-energy emission can come from the SNR shell (forward
shock) that accelerates particles to very high energies and the
SNR interior (filled with heated ejecta and/or swept-up material
and accelerated electrons). In some cases both components are
clearly present (composite type SNRs), while in the others only
the shell or only the interior emission (center-filled SNRs) could
be identified. To date, approximately 280 SNRs are known to
exist in our galaxy (Green 2009a, 2009b). These sources have
been detected chiefly by their radio emission. On the basis of
their radio morphologies, about 78% belong to the shell type,
12% are composite type, and 4% are the center-filled type. The
remaining 6% are difficult to attribute to any of the above types
(Green 2009a, 2009b).
While theories about the evolution of SNRs generally predict
that these sources should have shell-like morphologies in the
X-ray and radio, a particular class of SNRs known as mixed-
morphology SNRs (MMSNRs) have garnered considerable
interest from observational, theoretical, and computer modeling
perspectives (Rho & Petre 1998). These sources feature the
nominal shell-like radio morphology typical of SNRs coupled
with a thermal center-filled X-ray morphology that is centrally
brightened and roughly homogeneous (Vink 2012). MMSNRs
also appear to be associated with molecular clouds, as evidenced
by hydroxyl (OH) masers at 1720 MHz that are indicators
of interactions between SNR shocks and molecular clouds
and by infrared observations that reveal emission associated
with shocked molecules. The origin of the contrasting X-ray
and radio morphologies that characterize MMSNRs remains
a mystery. Several competing theories have been proposed to
account for the unusual morphologies exhibited by MMSNRs.
One theory is the evaporating cloud theory (White & Long
1991), which states that the interior of an MMSNR is filled
with clouds that have survived passage by the initial SNR
blast wave. These clouds have thus loaded the interior of the
SNR with a reservoir of material and produce thermal X-ray
emission as they evaporate. A second theory proposed by Cox
et al. (1999) suggests that the overfed thermal emission may
be explained by efficient thermal conduction processes within
the SNR interior. Unfortunately, neither of these theories can by
themselves provide an adequate explanation for the observed
X-ray morphology of these particular SNRs. For example,
Shelton et al. (2004) noted that both the evaporating cloud model
and the thermal conduction model fail to adequately predict the
sharp X-ray surface brightness gradient observed for several
MMSNRs. A pivotal clue about this phenomenon may rest with
1
2. The Astrophysical Journal, 782:102 (14pp), 2014 February 20 Pannuti et al.
Table 1
General Properties of G352.7−0.1
Property Value References
R.A. (J2000.0) 17h27m40s 1
Decl. (J2000.0) −35◦07 1
Angular diameters (arcmin × arcmin) 8 × 6 1
Distance (kpc) 7.5 ± 0.5 2
Physical diameters (pc) 17 × 13 3
Flux density at 5000 MHz (Jy) 2.3 4
Flux density at 1465 MHz (Jy) 3.4 ± 0.4 5
Flux density at 1415 MHz (Jy) 4.7 6
Flux density at 1400 MHz (Jy) 3.1 ± 0.3 7
Flux density at 843 MHz (Jy) 4.4 8
Flux density at 408 MHz (Jy) 9.6 4
Spectral index α (Sν ∝ να) −0.6 5
References. (1) Green 2009a; (2) Giacani et al. 2009; (3) This paper; (4) Clark
et al. 1975; (5) Dubner et al. 1993; (6) Caswell et al. 1983; (7) Giacani et al.
2009; (8) Whiteoak & Green 1996.
the fact that MMSNRs all preferentially appear to be interacting
with adjacent molecular clouds. Remarkably, several MMSNRs
appear to feature X-ray emitting plasma that is dominated by
ejecta rather than swept-up material as expected for sources
with ages estimated to be ∼104
yr (the typical estimated age
of an MMSNR). To better understand the X-ray properties of
MMSNRs—and specifically MMSNRs with ejecta-dominated
X-ray emission—we present an analysis of X-ray observations
of the Galactic ejecta-dominated MMSNR G352.7−0.1.
G352.7−0.1 was first classified as an SNR on the basis of
observations made at 408 and 5000 MHz of the source by Clark
et al. (1973) and Clark et al. (1975), using the Molonglo Cross
Radio Observatory and the Parkes 64 Meter Radio Telescope,
respectively. Subsequent radio observations of G352.7−0.1
(Caswell et al. 1983; Dubner et al. 1993; Whiteoak & Green
1996; Giacani et al. 2009) with such observatories as the Fleurs
Synthesis Telescope, the Very Large Array (VLA), and the
Molonglo Observatory Synthesis Telescope at frequencies of
843 MHz and 1400 MHz have revealed a shell-like morphology
of this source that features two loops or lobes. The second
lobe is an incomplete shell seen toward the southwest of the
complete first lobe. The entire angular extent of the SNR is
approximately 8 × 6 arcmin (Green 2009a), and the integrated
spectral index of the SNR is α ∼ −0.6 (Dubner et al. 1993; where
we have adopted the convention for radio flux densities S ∝ να
).
The assumed distances to G352.7−0.1 have ranged from 7.5 ±
0.5 kpc (Giacani et al. 2009) to 8.5 kpc (Kinugasa et al. 1998) to
11 kpc (Dubner et al. 1993) to 16.4 kpc (Caswell et al. 1983). On
the basis of observations that traced the H i absorption profile
in the direction of G352.7−0.1 and considering the Galactic
tangent point velocity, Giacani et al. (2009) derived bounds of
between ∼6.8 kpc and ∼8.4 kpc for the distance to the SNR.
Those authors concluded that a value of 7.5 ± 0.5 kpc is a
satisfactory distance estimate to G352.7−0.1. We adopt this
distance to the SNR in the present paper. In Table 1 we present
a summary of the general physical properties of G352.7−0.1.
A bright unresolved radio source is seen on the eastern edge of
the complete first lobe, and Dubner et al. (1993) speculated that
this source may be a “compact inhomogeneity in the radio shell”
or an unrelated background source seen against the radio shell by
a chance alignment. As pointed out by Giacani et al. (2009), this
radio source was resolved into two separate pointlike sources by
higher angular resolution observations. These two sources have
been cataloged as WBH2005 352.775−0.153 and WBH2005
352.772−0.149 in the “New Catalog of Compact 6 cm Sources
in the Galactic Plane” (White et al. 2005). To further elucidate
the properties of these radio sources, Giacani et al. (2009)
computed a spectral index of the combined emission from the
two sources (because these two sources were unresolved in
the 1.4 GHz map, those authors presented of G352.7−0.1),
of α ∼ −1.1 to −1.3. This estimate of α prompted Giacani
et al. (2009) to conclude that these two sources comprise clouds
of radio-emitting plasma ejecta by a distant active galactic
nuclei (AGNs) seen in projection beyond G352.7−0.1 and thus
physically unrelated to the SNR. Therefore, we do not consider
these radio sources to be associated with G352.7−0.1. We note
that Green et al. (1997) and Koralesky et al. (1998) detected
OH maser emission at 1720 MHz from G352.7−0.1. Such
emission is closely associated with interactions between SNRs
and molecular clouds. MMSNRs (like G352.7−0.1) appear to be
interacting with adjacent molecular clouds, and this interaction
is suspected to help explain the origin of the observed contrasting
X-ray and radio morphologies of these sources. Additional
evidence for an interaction between G352.7−0.1 and adjacent
molecular clouds is supplied by Toledo-Roy et al. (2014), who
explain the observed radio morphology using a model where the
original supernova explosion occurs inside and near a molecular
cloud.
X-ray emission from G352.7−0.1 was first detected by
Kinugasa et al. (1998) on the basis of observations made with the
Advanced Satellite for Cosmology and Astrophysics (ASCA;
Tanaka et al. 1994) as part of the ASCA Galactic Plane Survey
(see Sugizaki et al. 2001, who also reported the detection of
X-ray emission from G352.7−0.1). A spectral analysis of this
SNR as performed by Kinugasa et al. (1998), using extracted
spectra from the Gas Imaging Spectrometers (GISs) and the
Solid State Imaging Spectrometers (SISs) on board ASCA
(see Burke et al. 1993, Serlemitsos et al. 1995, Makishima
et al. 1996, and Ohashi et al. 1996 for more information
about the GISs, the SISs and the X-ray Telescopes), revealed
that the X-ray emitting plasma could be best fit with a non-
equilibrium ionization (NEI) model with an ionization timescale
of τ ∼ 1011
cm−3
s (indicating that the plasma is not in
ionization equilibrium) and a temperature of kT ∼ 2 keV,
which is unusually high for an SNR. Prominent K-shell lines
from highly ionized silicon, sulfur, and argon were also clearly
seen in the extracted spectra. The fitted abundances of silicon
and sulfur were both overabundant relative to solar abundances
(∼3.7 and ∼3.4, respectively), and thus the X-ray emitting
plasma associated with G352.7−0.1 is ejecta dominated. Lastly,
Kinugasa et al. (1998)—who assumed that G352.7−0.1 lies at
a distance of 8.5 kpc and that the SNR is in the Sedov stage
of evolution—estimated the age of the SNR to be t ∼ 2200 yr.
If this age estimate is accurate, then it is remarkable that the
X-ray emitting plasma associated with G352.7−0.1 is still ejecta
dominated. We note that a separate spectral analysis of the
ASCA-detected emission from G352.7−0.1 was conducted by
Reynolds & Keohane (1999), who fit the extracted spectra using
the synchrotron X-ray emission model SRCUT. This model
assumes that all of the observed X-ray continuum emission is
produced by synchrotron radiation and is characterized by the
radio flux density of the SNR at 1 GHz, the radio spectral index
α, and the roll-off frequency νrolloff from energy Emax (the energy
at which the electron energy distribution must steepen from its
slope at radio-emitting energies). On the basis of the results of
2
3. The Astrophysical Journal, 782:102 (14pp), 2014 February 20 Pannuti et al.
their fits to the spectra (which were constrained by the observed
radio properties of G352.7−0.1), those authors estimated a value
of 40 TeV for Emax.
An analysis of a pointed X-ray observation of G352.7−0.1
with the XMM-Newton Observatory (Jansen et al. 2001) is
presented by Giacani et al. (2009). The pn-CCD camera (Str¨uder
et al. 2001) and the Multi-Object Spectrometer cameras (Turner
et al. 2001) (hereafter referred to as the PN, MOS1, and MOS2,
respectively, for the remainder of this paper) on board XMM-
Newton comprise the European Photon Imaging Camera (EPIC).
On the basis of the superior resolution attained by the PN,
MOS1, and MOS2 in imaging G352.7−0.1, Giacani et al. (2009)
disagreed with Kinugasa et al. (1998) (who had concluded
that the X-ray morphology of G352.7−0.1 was shell-like,
similar to its radio morphology) and instead classified the X-ray
morphology as center-filled, thus motivating a classification of
G352.7−0.1 as an MMSNR. Giacani et al. (2009) conducted a
spectral analysis of extracted PN, MOS1, and MOS2 spectra for
the entire angular extent of G352.7−0.1. The extracted spectra
were fit with an NEI model (the same model implemented by
Kinugasa et al. (1998)), and the parameters of the fit to the
spectra were broadly similar to those reported by Kinugasa
et al. (1998). Specifically, Giacani et al. (2009) reported fit
values of kT ∼ 1.9 ± 0.2 keV, τ = 4.5 ± 0.5 × 10¹⁰
cm−3
s
and abundances for silicon and sulfur of 2.4 ± 0.2 and 3.8 ± 0.3
relative to solar, respectively. Giacani et al. (2009) also reported
an overabundance of argon (4.7 ± 1.2 relative to solar) in the
X-ray emitting plasma associated with G352.7−0.1, which is the
first report of an overabundance of argon in the X-ray emitting
plasma associated with this SNR. Lastly, Giacani et al. (2009)
noted the presence of an Fe K emission line at 6.46 ± 0.03 keV
in the extracted spectra. On the basis of the fit values of these
parameters and assuming a distance to this SNR of 7.5 kpc,
Giacani et al. (2009) estimated the electron density of the plasma
to be ne = 0.3 cm−3
, the age of the SNR to be t ∼ 4700 yr, an
X-ray emitting mass of 10 M , and an explosion energy
of 1050
erg. Lastly, Giacani et al. (2009) found no X-ray
counterparts to the radio sources WBH2005 352.775−0.153
and WBH2005 352.772−0.149.
In the present paper we present an imaging and spectroscopic
analysis of the properties of G352.7−0.1 based on pointed
X-ray observations made by XMM-Newton and the Chandra X-
ray Observatory. The present work contains (to the best of our
knowledge) the first analysis of the data set from the Chandra
observation of this SNR. The XMM-Newton and Chandra ob-
servations of G352.7−0.1, as well as the accompanying data
reduction, are presented and described in Sections 2.1 and 2.2,
respectively. In Sections 3.1 and 3.2, we present a spatial
and spectral analysis of the XMM-Newton and Chandra data
sets, respectively. We discuss properties of this SNR in Sec-
tion 4, where we compare our results with previously published
analyses of the SNR (in Section 4.1). We also calculate and dis-
cuss the physical properties of G352.7−0.1—including electron
density, pressure, and X-ray emitting mass—in Section 4.2. In
Section 4.3, we investigate whether the X-ray emitting plasma
associated with G352.7−0.1 is overionized (as seen in the cases
of other Galactic MMSNRs). A search for a neutron star associ-
ated with this SNR through an analysis of the spectral properties
of hard unresolved X-ray sources seen in projection toward the
interior of the SNR is described in Section 4.4. In Section 4.5,
we present the discovery of infrared emission from G352.7−0.1
as observed by the Spitzer Space Telescope, and in Section 4.6
we discuss this SNR within the context of other MMSNRs that
feature ejecta-dominated X-ray emitting plasmas. Finally, our
conclusions are presented in Section 5.
2. OBSERVATIONS AND DATA REDUCTION
2.1. XMM-Newton Observations and Data Reduction
G352.7−0.1 was the subject of a pointed XMM-Newton ob-
servation made on 2002 October 3 with all three EPIC cameras:
the Sequence Number of the observation was 0150220101 (PI:
J. Hughes). The fields of view of the MOS1, MOS2, and PN
are all approximately 30 arcmin; therefore, the entire angular
extent of G352.7−0.1 was easily sampled by a single pointed
observation. The observation was conducted with all three cam-
eras in MEDIUM filter mode; in addition, the PN camera was in
Full Frame mode. The angular resolution of the MOS1, MOS2,
and PN are all approximately 6 arcsec at 1 keV. At the same
energy, the effective collecting areas are 922 cm2
for the two
MOS cameras and 1227 cm2
for the PN camera. These three
cameras are each nominally sensitive to photons with energies
between 0.2 and 12.0 keV.
Data for the observation of G352.7−0.1 were obtained from
the online XMM-Newton data archive.3
To reduce the data, stan-
dard tools in the HEAsoft software package4
(Version 6.12)
and the Science Analysis System (SAS; Gabriel et al. 2004)
software package5
(Version 12.0.0) were used. Specifically, the
SAS tools emchain and mos − filter were used to process
data from the observations made by the MOS1 and MOS2 cam-
eras and to identify good time intervals within the observations.
Likewise, the SAS tools enchain and pn − filter were used
to process data from the observation made by the PN camera
and to identify good time intervals within the observation. Af-
ter filtering, the effective exposure times for the MOS1, MOS2,
and PN observations of G352.7−0.1 were 28639 s, 28650 s, and
16468 s, respectively. We extracted MOS1, MOS2, and PN spec-
tra for both the entire SNR as well as the bright eastern region of
the SNR. To perform the spectral extraction for both the source
and background regions, we used the SAS tool evselect, and
the extracted spectra were grouped to a minimum of 25 counts
per channel. Subsequently, the SAS tool backscale was used
to compute the proper value for the BACKSCAL keyword in the
extracted spectra. Finally, the SAS tools rmfgen and arfgen
were used to generate the response matrix files (RMFs) and
the ancillary response files (ARFs), respectively, for the spectra
required for spectral fitting. An analysis of the XMM-Newton ex-
tracted spectra is presented in Section 3.1. In Table 2 we present
a summary of the XMM-Newton observation of G352.7−0.1.
2.2. Chandra Observations and Data Reduction
G352.7−0.1 was the subject of a pointed observation made
with the Chandra X-ray Observatory (Weisskopf et al. 2002) on
2004 October 6. The corresponding ObsID of this observation
is 4652 (PI: J. Hughes), and the observation was made in
VERY FAINT timed mode with the Advanced CCD Imaging
Spectrometer (ACIS) at a focal plane temperature of −118.54 C.
The ACIS comprises the ACIS-S and ACIS-I arrays of chips:
each chip is approximately 8.3 × 8.3 (see Garmire et al. (2003)
for more details about the properties of the ACIS chips). The
entire angular extent of the X-ray emitting plasma associated
with G352.7−0.1 fits within the field of view of one of the
3 See http://xmm.esac.esa.int/xsa/.
4 See http://heasarc.gsfc.nasa.gov/.
5 See http://xmm.esa.int/sas/.
3
4. The Astrophysical Journal, 782:102 (14pp), 2014 February 20 Pannuti et al.
Table 2
Summary of XMM-Newton MOS1, MOS2 and PN Observations of G352.7−0.1
MOS1 MOS2 PN
Effective MOS1 Effective MOS2 PN Effective
Exposure Count Exposure Count Exposure Count
Sequence Observation R.A. Decl. Time Rate Time Rate Time Rate
Number Date (J2000.0) (J2000.0) (s) (counts s−1) (s) (counts s−1) (s) (counts s−1)
0150220101 2002 Oct 3 17 27 35.0 −35 07 23 28639 9.2 × 10⁻² 28650 9.3 × 10⁻² 16468 2.3 × 10⁻¹
Notes. The units of Right Ascencion are hours, minutes, and seconds, while the units of Declination are degrees, arcminutes, and arcseconds. Count rates are for the
entire angular extent of the diffuse emission and correspond to the energy range from 1.0 keV to 5.0 keV.
ACIS chips (specifically the ACIS-S3 chip). This particular chip
(which is back-illuminated) is sensitive to photons with energies
ranging from 0.3 to 10.0 keV, and the FWHM angular resolution
of this camera at 1 keV is 0.5. Finally, the effective collecting
area of the ACIS-S3 chip for photons with energies of 1.0 keV
is 525 cm2
.
Data for the Chandra observation were obtained from the
online Chandra data archive6
. To reduce the data, standard
tools in the Chandra Interactive Analysis of Observations
(CIAO7
) software package Version 4.4 (CALDB Version 4.4.7)
was used to reduce and analyze the data. The CIAO tool
chandra repro was run to reprocess the data set and to perform
all of the recommended data processing steps. These steps
included the application of the latest temperature-dependent
charge transfer inefficiency correction, the latest time-dependent
gain adjustment, and the latest gain map. The tool also flags
bad pixels (creating a new bad pixel file) and applies additional
filters on the basis of grades and proper status columns. Running
this tool creates a new EVT2 file that we further filtered to
exclude time periods of significant background flare activity.
This particular filtering was accomplished using the CIAO tool
chips.8
After all of the filtering was applied, the effective
exposure time of the processed EVT2 file was 44,583 s. In
Table 3 we present a summary of the Chandra observation of
G352.7−0.1.
To perform a spectral analysis of the X-ray emitting plasma
associated with G352.7−0.1, the tool specextract was used
to generate spectral files—source spectra, background spectra,
ARFs, and RMFs—of both the entire SNR as well as several
regions within the SNR. The extracted spectra were grouped
to a minimum of 15 counts per channel. An analysis of all
of the Chandra-extracted spectra is presented in Section 3.2.
To reduce the effect of point source contamination of the
extracted spectra, the CIAO tool wavdetect—a wavelet-based
source algorithm (Freeman et al. 2002)—was used to identify
unresolved sources detected by the Chandra observation and
exclude them while analyzing the diffuse emission (as described
below).
3. ANALYSIS AND RESULTS
3.1. XMM-Newton Observations of G352.7−0.1:
Imaging and Spectroscopy
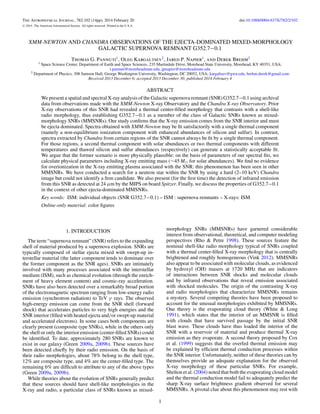
In Figure 1 we present an XMM-Newton MOS1 image of
G352.7−0.1. The image depicts emission detected for the en-
ergy range of 0.5–10.0 keV. The emission has been smoothed
with a Gaussian with a radius of 10 arcsec. Radio emission
6 See http://cda.harvard.edu/chaser/.
7 See Fruscione et al. (2006) and http://cxc.harvard.edu/ciao/.
8 See http://cxc.harvard.edu/chips/index.html.
17:28:00.0 50.0 40.0 30.0 27:20.0
03:00.0
04:00.0
05:00.0
06:00.0
07:00.0
08:00.0
09:00.0
-35:10:00.0
11:00.0
12:00.0
RA (J2000.0)
Dec(J2000.0)
352.775-0.153 and 352.772-0.149
Background Region
Eastern Region
Whole SNR
Figure 1. XMM-Newton MOS1 image (in color) of G352.7−0.1. The image
depicts emission from the SNR as detected from the energy range between
0.5 and 10.0 keV. The brightness range of the image is 0–0.15 counts s−1
arcsec−2. Gaussian smoothing with a radius of 10 arcsec has been applied.
The white contours depict radio emission as detected by the Very Large Array
(VLA) at a frequency of 1.4 GHz (Dubner et al. 1993; Giacani et al. 2009).
The contour levels range from 0.02 to 0.11 Jy beam−1 in steps of 0.01 Jy
beam−1. The location of the background double radio sources WBH 2005
352.775−0.153 and WBH 2005 352.772−0.149 are indicated. The regions of
spectral extraction—namely for the bright eastern region, the whole SNR, and
the background region—are also indicated. Notice that the X-ray morphology
is center-filled but the radio morphology is shell-like. These contrasting
morphologies are the defining characteristics of MMSNRs. See Section 3.1.
(A color version of this figure is available in the online journal.)
as detected by the Very Large Array (VLA) at a frequency of
1.4 GHz (Dubner et al. 1993; Giacani et al. 2009) is depicted
with overlaid contours (this radio map was provided courtesy
of Gloria Dubner and was published in Dubner et al. 1993).
The combined position of the background double radio sources
WBH 2005 352.775−0.153 and WBH 2005 352.772−0.149 (as
seen toward the eastern boundary of the main radio shell) is in-
dicated in the figure. No significant X-ray emission is detected
from these background radio sources (in agreement with the re-
sults of Giacani et al. 2009). As noted by Giacani et al. (2009),
the X-ray emission from G352.7−0.1 is seen inside the main
radio shell, thus motivating its classification as an MMSNR. The
X-ray emitting plasma appears to be broadly uniform in bright-
ness with the exception of a bright region seen toward the eastern
edge.
4
5. The Astrophysical Journal, 782:102 (14pp), 2014 February 20 Pannuti et al.
Table 3
Summary of Chandra ACIS-S Observation of G352.7−0.1
ACIS-S ACIS-S
Sequence Observation R.A. Decl. Roll Effective Exposure Count
Number ObsID Date (J2000.0) (J2000.0) (deg) Time (s) Rate (s)
500471 4652 2004 Oct 6 17 27 41.0 −35 06 45 263 44583 1.4 × 10⁻¹
Notes. The units of Right Ascension are hours, minutes, and seconds, while the units of Declination are degrees, arcminutes, and
arcseconds. Count rates are for the entire angular extent of the diffuse emission and correspond to the energy range from 1.0 keV to
5.0 keV.
0.01
0.1
normalizedcountss−1keV−1
2
−2
0
2
χ
Energy (keV)
Figure 2. Extracted XMM-Newton MOS1, MOS2, and PN spectra (in black, red,
and green, respectively) for the entire diffuse emission of G352.7−0.1 (“whole
SNR”) as fitted with a PHABS×VNEI model with variable silicon and sulfur
abundances. Notice the prominent silicon and sulfur lines at approximately
1.7 keV and 2.3 keV, respectively. The parameters of the fit to the spectrum are
given in Table 4. See Section 3.1.
(A color version of this figure is available in the online journal.)
MOS1, MOS2, and PN spectra were extracted from both the
entire angular extent of the plasma as well as for the bright
eastern region. The extraction region for the whole SNR was
circular and approximately 2.4 in radius, while the extraction
region for the bright eastern region of the SNR was elliptical
with semimajor and semiminor axes of 1.3 and 0.6, respectively.
The background spectrum was extracted from an annular region
concentric with the extraction region for the whole SNR. This
annular region had an inner radius corresponding to the radius
of the source region for the whole SNR and an outer radius of
3.3. The locations of all of these spectral extraction regions are
depicted in Figure 1. The three spectra for the whole SNR were
fitted simultaneously using the thermal model VNEI. This model
is a non-equilibrium collisional plasma model that assumes a
constant temperature, a single ionization parameter, and variable
elemental abundances (Hamilton et al. 1983; Liedahl et al. 1995;
Borkowski et al. 2001). The version of the VNEI model used
in this paper (Version 1.1) implements updated calculations of
ionization fractions using dielectronic recombination rates as
provided by Mazzotta et al. (1998). The choice of the VNEI
model (instead of the NEI model with elemental abundances
frozen to solar values) is motivated by the prominent lines of
silicon and sulfur seen in the spectra (as shown in Figure 2
as well as previous X-ray spectral analyses conducted of this
SNR by Kinugasa et al. (1998) and Giacani et al. 2009). The
VNEI model was multiplied by the PHABS model to account for
photoelectric absorption along the line of sight to G352.7−0.1.
Table 4
Summary of XMM-Newton MOS1+MOS2+PN Spectral Analysis of
G352.7−0.1 (PHABS×VNEI Model)
Parameter Eastern Whole
Region SNR
NH (1022 cm−2) 2.46+0.56
−0.46 2.78+0.24
−0.28
kT (keV) 1.90+1.60
−0.70 1.20+0.34
−0.24
τ (1010 cm−3 s) 3.57+3.43
−1.57 4.07+2.53
−1.17
Si 2.6+1.5
−0.9 2.3+0.6
−0.4
S 4.5+3.5
−1.7 3.5+1.4
−0.8
Normalization (cm−5) 4.9 × 10⁻⁴ 3.5 × 10⁻³
χ2
ν (χ2/dof) 1.19 (84.58/71) 1.15 (444.17/387)
Absorbed flux (erg cm−2 s−1) 2.4 × 10⁻¹³ 8.4 × 10⁻¹³
Unabsorbed flux (erg cm−2 s−1) 1.3 × 10⁻¹² 6.4 × 10⁻¹²
Unabsorbed luminosity (erg s−1) 8.8 × 1033 4.3 × 1034
Notes. All stated error bounds correspond to 90% confidence intervals. Elemen-
tal abundances are expressed with respect to solar abundances. Normalizations
are defined as (10−14/4πd2) nenHdV , where d is the distance to G352.7−0.1
in cm, ne and np are the electron and hydrogen number densities, respectively
(both in cm−3), and V = dV is the total volume of the emitting region
(in cm3). Fluxes and luminosities are expressed for the energy range from
1.0 to 5.0 keV. Luminosities are calculated assuming a distance of 7.5 kpc to
G352.7−0.1. See Section 3.1.
We obtain statistically acceptable fits (with χ2
ν values of ∼1.2
or less) to the extracted MOS1+MOS2+PN spectra for both the
whole SNR as well as the bright eastern region. In Table 4
we present a summary of the fit parameters for the fits to both
regions. We note that the parameters of our fit for the spectra
of the whole SNR are broadly similar to those presented by
Giacani et al. (2009). Regarding the possible presence of spatial
variations in the spectral properties, we find little difference
between the derived fit parameters for the whole SNR compared
with the bright eastern region. Therefore, this region appears to
be simply a bright region of the thermal X-ray emitting plasma
instead of a pulsar wind nebula of a neutron star associated with
G352.7−0.1 as one could assume on the basis of the images.
The lack of obvious spatial variations in the spectral properties
of the plasma is also consistent with the results of Giacani et al.
(2009), who searched and failed to detect any such variations.
In Figure 2 we present the extracted MOS1+MOS2+PN spectra
for the whole SNR (using the extraction regions for the source
spectrum and the background spectrum as shown in Figure 1).
In Figure 3 we present confidence contour plots for the fit with
the PHABS×VNEI fit to the spectra of the whole SNR.
3.2. Chandra Observations of G352.7−0.1:
Imaging and Spectroscopy
The superior angular resolution of the Chandra ACIS-S
compared with the XMM-Newton MOS1, MOS2, and PN
5
6. The Astrophysical Journal, 782:102 (14pp), 2014 February 20 Pannuti et al.
2.4 2.6 2.8 3 3.2
0.811.21.41.61.8
Parameter:kT(keV)
Parameter: nH (1022
)
+
0.8 1 1.2 1.4 1.6 1.8
2×10¹⁰
4×10¹⁰
6×10108×1010
Parameter:Tau(s/cm3)
Parameter: kT (keV)
+
1.6 1.8 2 2.2 2.4 2.6 2.8 3 3.2
3456
Parameter:S
Parameter: Si
+
Figure 3. Confidence contour plots (NH vs. kT , kT vs. τ and Si vs. S) for the PHABS×VNEI fit to the extracted XMM-Newton MOS1+MOS2+PN spectra. The
confidence contours are at the 1σ, 2σ, and 3σ levels. See Table 4 for the fit parameters and Section 3.1 for a discussion of the fit.
(A color version of this figure is available in the online journal.)
55.0 50.0 45.0 17:27:40.0 35.0 30.0 25.0
04:00.0
05:00.0
06:00.0
07:00.0
08:00.0
09:00.0
-35:10:00.0
RA (J2000.0)
Dec(J2000.0)
0.5 - 7.0 keV
Figure 4. Broadband (0.5–7.0 keV) Chandra image of G352.7−0.1 as observed
with the ACIS-S3 chip; the chip gap can be clearly seen toward the bottom of
the figure. The emission has been smoothed with a Gaussian with a radius of
9 arcsec. The green contours depict radio emission as detected by the VLA at
a frequency of 1.4 GHz and are placed at the same levels as in Figure 1. See
Section 3.2.
(A color version of this figure is available in the online journal.)
instruments allows us to perform a more detailed spatially re-
solved X-ray spectroscopic study of G352.7−0.1. Our Chandra
image of this SNR is presented in Figure 4, and in Figure 5 we
follow the example of Giacani et al. (2009) and present images
made of G352.7−0.1 at three different energy cuts—namely
1.7–2.0 keV, 2.3–2.6 keV, and 3.1–3.3 keV—that correspond to
known emission lines of silicon, sulfur, and argon, respectively.
We first extracted a spectrum for the entire SNR; we then di-
vided the angular extent of the SNR into six different regions
and extracted spectra from each region. On the basis of their
apparent locations within the angular extent of G352.7−0.1, we
denoted these smaller regions as “bottom,” “right,” “middle,”
“left,” “top,” and the “crescent” region (this latter region cor-
responds to emission seen in the space between the two radio
loops seen to cleave at the western portion of the SNR). We
note that the “left” region contains most of the “eastern region”
considered previously in our XMM-Newton spectral analysis. A
background spectrum was obtained using an elliptical region lo-
cated north of the angular extent of G352.7−0.1 but still on the
ACIS-S3 chip. The locations of the regions of spectral extraction
are all shown in Figure 6. All of the spectra were extracted using
the CIAO tool specextract. This tool generates all required
spectral files, including the source spectra, background spectra,
and weighted ARFs and RMFs. When source and background
spectral files were extracted, care was taken to exclude counts
from the locations of unresolved sources (primarily background
galaxies) found within the extraction regions. This was accom-
plished by running the CIAO source detection tool wavdetect.
The locations of the sources detected by wavdetect were
noted, and counts from these locations were excluded when
spectra were extracted. We will return to the point sources
detected by wavdetect in Section 4.4 when we discuss the
search for an X-ray emitting neutron star associated with
this SNR.
The spectra of all of the regions were fit with the same VNEI
model (combined with a PHABS model for the photoelectric
absorption) employed to fit the extracted XMM-Newton spectra
as described in the previous section. Again, the abundances of
silicon and sulfur in the VNEI model were thawed, whereas
the abundances of the other elements were left frozen to solar
values. In Tables 5–7 we summarize the results of our fits to all of
the extracted Chandra spectra. In contrast to our results for the
XMM-Newton spectra, a single VNEI component with enhanced
silicon and sulfur abundances cannot adequately fit all of the
extracted Chandra spectra. Unsatisfactory fits (with values for
χ2
ν of more than 1.2) were obtained for the spectra of two of the
smaller regions (namely the “top” and “left” regions) as well
as the spectrum for the whole SNR. A single VNEI component
with the enhanced silicon and sulfur abundances is sufficient to
fit the spectra of the “bottom,” “right,” “middle,” and “crescent”
regions. Inspection of the values for the parameters of the fits
reveals a significant variation in spectral properties across the
whole angular extent of the SNR. For example, we note that the
fitted temperatures range from kT ∼ 0.8 keV for the “bottom”
region to kT ∼ 2.1 keV for the “crescent” region. We also note
that the fitted abundances of silicon and sulfur show a range of
values as well. In every region we considered, the abundances
for these two elements are super-solar. In contrast to the work of
Giacani et al. (2009), we find no evidence for an overabundance
of argon in the spectra of any of the regions that we considered.
When we allowed the abundance of argon to vary, there were
no improvements in any of the values of χ2
ν for any of the fits to
any of the regions. We speculate that the Chandra observation of
this SNR (unlike the XMM-Newton observation) did not detect
enough photons with energies corresponding to the argon line
feature to investigate the putative overabundance of this element
in detail.
6
7. The Astrophysical Journal, 782:102 (14pp), 2014 February 20 Pannuti et al.
55.0 50.0 45.0 17:27:40.0 35.0 30.0 25.0
04:00.0
05:00.0
06:00.0
07:00.0
08:00.0
09:00.0
-35:10:00.0
RA (J2000.0)
Dec(J2000.0)
Ar (3.1 keV - 3.3 keV)
55.0 50.0 45.0 17:27:40.0 35.0 30.0 25.0
04:00.0
05:00.0
06:00.0
07:00.0
08:00.0
09:00.0
-35:10:00.0
RA (J2000.0)
Dec(J2000.0)
S (2.3 keV - 2.6 keV)
55.0 50.0 45.0 17:27:40.0 35.0 30.0 25.0
04:00.0
05:00.0
06:00.0
07:00.0
08:00.0
09:00.0
-35:10:00.0
RA (J2000.0)
Dec(J2000.0)
Si (1.7 keV - 2.0 keV)
Figure 5. Narrowband Chandra images of G352.7−0.1 depicting X-ray emission as produced by different elemental species, specifically (from left to right) silicon
(1.7 keV–2.0 keV), sulfur (2.3 keV–2.6 keV), and argon (3.1 keV–3.3 keV). In each case, the emission has been smoothed with a Gaussian with a radius of 9 arcsec,
and green contours depicting radio emission as detected by the VLA at a frequency of 1.4 GHz are overlaid. The radio contours have been placed at the same levels
as seen in Figure 1.
(A color version of this figure is available in the online journal.)
55.0 50.0 45.0 17:27:40.0 35.0 30.0 25.0
04:00.0
05:00.0
06:00.0
07:00.0
08:00.0
09:00.0
-35:10:00.0
RA (J2000.0)
Dec(J2000.0)
Left
Middle
Bottom
Western Crescent
RightTop
Whole SNR
Figure 6. Three-color Chandra image of G352.7−0.1: the depicted red, green
and blue color scales correspond to soft (1.0–1.6 keV), medium (1.6–2.4 keV),
and hard (2.4–7.0 keV) emission, respectively. The emission at each energy
range has been smoothed with a Gaussian with a radius of 9 arcsec. Regions
of extraction of the diffuse emission for spectral analysis are indicated; the
corresponding background spectrum is located just to the north of the source
and out of the field of view. The entire source and the background region are
contained within the field of view of the ACIS-S3 chip. See Section 3.2 and
Tables 5–7.
(A color version of this figure is available in the online journal.)
To obtain statistically acceptable fits to the spectra of the
“left” region, the “top” region, and the whole SNR, we added
additional components to the spectral fits. We first added a
single power law component, but we failed to obtain statistically
acceptable fits (with χ2
ν 1.2) to the spectra of the “left” region,
the “top” region nor the whole SNR. We then added an NEI
component to our PHABS×VNEI model; we left the abundance
of this NEI component frozen at unity. As an alternative, we also
tried fitting the spectrum with a PHABS×(VNEI+VNEI) model.
In this case, we thawed the abundance of silicon in one VNEI
component and thawed the abundance of sulfur in the other
VNEI component (the abundances of all other elements were
0.01
0.1
normalizedcountss−1keV−1
2
−2
0
2
χ
Energy (keV)
Figure 7. Extracted Chandra ACIS spectrum of the entire diffuse emission of
G352.7−0.1 as fitted with a PHABS×(VNEI+NEI) model. See Section 3.2 and
Table 6.
(A color version of this figure is available in the online journal.)
left frozen at values of unity). In both cases, with the addition of a
second thermal component, we were able to obtain statistically
acceptable fits to the spectra of the two individual regions as
well as the SNR as a whole. In Tables 6 and 7 we present the
results of these fits to the extracted spectra for these regions.
In Figure 7 we present the Chandra spectrum of the diffuse
emission of G352.7−0.1 as fit by the PHABS×(VNEI+NEI)
model. We believe that the presence of this second component
has only manifested itself through the Chandra observation
of G352.7−0.1 (but not the XMM-Newton observation of the
SNR) because of the significantly lower background inherent in
observations made with the ACIS.
4. DISCUSSION
4.1. Physical Interpretation
We comment on the physical plausibility of these two models
for interpreting the spectra of these regions. Regarding the fits
obtained with the PHABS×(VNEI+VNEI) models, we note
that in each case the sulfur-rich thermal component is implied
7
8. The Astrophysical Journal, 782:102 (14pp), 2014 February 20 Pannuti et al.
Table 5
Summary of Chandra ACIS Spectral Analysis of G352.7−0.1 (PHABS×VNEI Model)
Parameter Bottom Right Middle Crescent Left Top Whole
Region Region Region Region Region Region SNR
NH (1022 cm−2) 3.08+0.70
−0.60 3.10+0.95
−0.74 2.68+0.76
−0.64 2.31+1.93
−0.91 2.72+0.50
−0.44 3.24+0.72
−0.78 2.71+0.39
−0.33
kT (keV) 0.80+0.75
−0.25 1.23+1.93
−0.52 1.24+1.30
−0.56 2.03 (>0.54) 1.38+0.82
−0.50 0.68+0.82
−0.24 1.62+0.80
−0.46
τ (1010 cm−3 s) 12.7 (>2.00) 2.74+12.0
−1.21 1.68+1.42
−0.62 1.04+1.10
−0.54 2.46+1.34
−0.66 6.11 (>2.44) 2.01+0.85
−0.41
Si 2.4+1.1
−0.7 2.3+2.9
−1.2 3.4+2.8
−1.5 4.8 (>1.2) 2.2+1.3
−0.8 2.5+2.7
−0.9 1.9+1.3
−0.8
S 5.5+2.3
−1.8 3.8+3.6
−1.3 8.1+2.3
−3.7 9.8 (>2.0) 6.6+3.4
−2.9 6.5+6.5
−3.5 3.6+4.2
−1.6
Normalization (cm−5) 1.2 × 10⁻³ 6.2 × 10⁻⁴ 7.3 × 10⁻⁴ 1.8 × 10⁻⁴ 8.7 × 10⁻⁴ 1.6 × 10⁻³ 3.6 × 10⁻³
χ2
ν 1.07 1.06 1.04 1.02 1.24 1.25 1.28
χ2/dof 70.80/66 63.83/60 78.22/75 70.41/69 104.20/84 76.38/61 266.55/209
Absorbed flux (erg cm−2 s−1) 1.3 × 10⁻¹³ 1.2 × 10⁻¹³ 1.7 × 10⁻¹³ 8.6 × 10⁻¹⁴ 2.4 × 10⁻¹³ 1.1 × 10⁻¹³ 1.1 × 10⁻¹²
Unabsorbed flux (erg cm−2 s−1) 1.4 × 10⁻¹² 1.1 × 10⁻¹² 1.3 × 10⁻¹² 4.3 × 10⁻¹³ 1.7 × 10⁻¹² 1.5 × 10⁻¹² 7.6 × 10⁻¹²
Unabsorbed luminosity (erg s−1) 9.4 × 1033 7.4 × 1033 8.8 × 1033 2.9 × 1033 1.1 × 1034 1.0 × 1034 5.1 × 1034
Notes. All stated error bounds correspond to 90% confidence intervals. Elemental abundances are expressed with respect to solar abundances. Normalizations are
defined as (10−14/4πd2) nenH dV , where d is the distance to G352.7−0.1 in cm, ne and np are the electron and hydrogen number densities, respectively (both
in cm−3), and V = dV is the total volume of the emitting region (in cm3). Fluxes and luminosities are expressed for the energy range from 1.0 to 5.0 keV.
Luminosities are calculated assuming a distance of 7.5 kpc to G352.7−0.1. See Section 3.2.
Table 6
Summary of Chandra ACIS Spectral Analysis of G352.7−0.1 (PHABS×(VNEI+NEI) Model)
Parameter Left Top Whole
Region Region SNR
NH (1022 cm−2) 3.75+0.49
−0.55 4.61+0.79
−0.77 3.18+0.13
−0.11
kT VNEI (keV) 1.18+0.26
−0.20 1.82+2.94
−0.66 3.24+1.40
−0.86
Si 2.1+0.8
−0.6 7.0 ± 3.0 3.4+1.2
−0.9
S 6.3+2.5
−1.9 17.7 ± 4.9 9.4+3.4
−3.0
τVNEI (1010 cm−3 s) 2.8+1.0
−0.6 2.5+47.5
−0.9 1.7 ± 0.3
NormalizationVNEI (cm−5) 1.42 × 10⁻³ 1.93 × 10⁻⁴ 1.58 × 10⁻³
kT NEI (keV) 0.13+0.04
−0.02 0.17+0.11
−0.07 0.24+0.08
−0.05
τNEI (1010 cm−3 s) 7.4+23.6
−5.0 6.8+73.2
−5.2 1.4+1.1
−0.5
NormalizationNEI (cm−5) 6.6 1.7 0.5
χ2
ν (χ2/dof) 1.13 (91.65/81) 1.00 (59.01/59) 1.07 (219.61/206)
Absorbed flux (erg cm−2 s−1) 2.4 × 10⁻¹³ 1.2 × 10⁻¹³ 1.1 × 10⁻¹²
Unabsorbed flux (erg cm−2 s−1) 7.3 × 10⁻¹² 8.7 × 10⁻¹² 1.4 × 10⁻¹¹
Unabsorbed luminosity (erg s−1) 4.9 × 1034 5.9 × 1034 9.4 × 1034
Notes. All stated error bounds correspond to 90% confidence intervals. Elemental abundances are expressed with respect to solar
abundances. Normalizations are defined as (10−14/4πd2) nenHdV , where d is the distance to G352.7−0.1 in cm, ne and np
are the electron and hydrogen number densities, respectively (both in cm−3), and V = dV is the total volume of the emitting
region (in cm3). Fluxes and luminosities are expressed for the energy range from 1.0 to 5.0 keV. Luminosities are calculated
assuming a distance of 7.5 kpc to G352.7−0.1. See Section 3.2.
to be close to thermal equilibrium, whereas the silicon-rich
thermal component is not. We are not aware of a physical
mechanism where two different X-ray emitting plasmas that are
enriched in different elemental abundances featuring different
ionization timescales coexist with each other. Therefore, we
regard this model as not physically plausible. In contrast,
the PHABS×(VNEI+NEI) models may be readily explained
by a plausible model where the VNEI model fits emission
from stellar ejecta, while the NEI model fits emission from
swept-up material. Certainly, the large normalization of this
latter component implies that the amount of swept-up material
associated with this SNR is enormous. We note that a large
swept-up mass may be expected for MMSNRs like G352.7−0.1,
which preferentially appear to be located near molecular clouds
and appear to be interacting with these clouds as well. We
quantify this amount of mass when we discuss the physical
properties of G352.7−0.1 in the next section.
4.2. Physical Properties of G352.7−0.1
We now discuss the physical properties of G352.7−0.1 as
implied by the parameters derived in fits to the extracted
Chandra spectrum for the whole SNR. In our analysis we
will follow the approaches applied by Pannuti et al. (2010)
and Pannuti et al. (2013) to other X-ray-detected Galactic
MMSNRs (namely HB 21 (G89.0+4.7), CTB 1 (G116.9+0.2),
Kes 17 (G304.6+0.1), G311.5−0.3, G346.6−0.2, and CTB 37A
(G348.5+0.1)). We first note that the normalizations N of the
thermal models are defined by the relation
N =
10−14
4πd2
nenpdV, (1)
where d is the distance to G352.7−0.1 (assumed to be 7.5 kpc),
ne and np are the electron and proton number densities (respec-
tively), and V is the volume of the SNR. We will assume that
8
9. The Astrophysical Journal, 782:102 (14pp), 2014 February 20 Pannuti et al.
Table 7
Summary of Chandra ACIS Spectral Analysis of G352.7−0.1 (PHABS×(VNEI+VNEI) Model)
Parameter Left Top Whole
Region Region SNR
NH (1022 cm−2) 2.59+0.14
−0.12 4.22+0.68
−0.60 2.59+0.27
−0.39
kT Si (keV) 1.78+0.32
−0.30 0.22+0.08
−0.06 2.14+3.46
−0.84
Si 6.4 ± 1.5 2.9+11.1
−1.7 7 (>4)
τSi (1010 cm−3 s) 0.71+0.22
−0.19 5.8+64.2
−4.8 0.54+0.16
−0.13
NormalizationSi (cm−5) 5.08 × 10⁻⁴ 0.20 2.57 × 10⁻³
kT S (keV) 0.61+0.07
−0.09 0.76+0.32
−0.28 0.39+0.33
−0.02
S 13.6+11.4
−4.1 9.8(>4.0) 37 (>7)
τS (1010 cm−3 s) 103(>6.8) 950(>1.6) 38 (>2.0)
NormalizationS (cm−5) 1.03 × 10⁻³ 6.92 × 10⁻⁴ 9.7 × 10⁻³
χ2
ν (χ2/dof) 1.17 (94.48/81) 1.04 (61.26/59) 1.05 (215.69/206)
Absorbed flux (erg cm−2 s−1) 2.4 × 10⁻¹³ 1.1 × 10⁻¹³ 1.1 × 10⁻¹²
Unabsorbed flux (erg cm−2 s−1) 1.6 × 10⁻¹² 5.0 × 10⁻¹² 7.4 × 10⁻¹²
Unabsorbed luminosity (erg s−1) 1.1 × 1034 3.4 × 1034 5.0 × 1034
Notes. All stated error bounds correspond to 90% confidence intervals. Elemental abundances are expressed with respect to solar
abundances. Normalizations are defined as (10−14/4πd2) nenH dV , where d is the distance to G352.7−0.1 in cm, ne and np
are the electron and hydrogen number densities, respectively (both in cm−3), and V = dV is the total volume of the emitting
region (in cm3). Fluxes and luminosities are expressed for the energy range from 1.0 to 5.0 keV. Luminosities are calculated
assuming a distance of 7.5 kpc to G352.7−0.1. See Section 3.2.
ne = 1.2 np and that the filling factor of the X-ray emitting gas
is unity (on the basis of the uniform morphology of the diffuse
emission). From this relation we can calculate the values for ne
and—by extension—np as well as the X-ray emitting mass M
of the diffuse emission. Another important physical parameter
to consider is the corresponding pressure P of the SNR. If we
define the total number density of particles ntotal to be the sum
of the number densities of electrons, protons, and helium nuclei
(i.e., ntotal = ne + np + nHe), we can make the approximation
ntotal ≈ 2ne for a plasma with cosmic abundances. Therefore,
we may express P as
P/k = 2neT K cm−3
, (2)
where k is Boltzmann’s constant and T is the temperature of
the SNR expressed in Kelvin. Finally, we estimate the age t of
G352.7−0.1 using the same relation employed by Giacani et al.
(2009) (see Section 1), that is,
t ∼ τ/ne, (3)
where τ is the ionization timescale of the X-ray emitting plasma
(see Borkowski et al. 2001).
We first calculate values for ne for both the ejecta-dominated
component and the ISM-dominated component using the nor-
malizations obtained when using the PHABS×(VNEI+NEI)
model to fit the extracted Chandra spectrum of the whole SNR
(see Table 6). If we approximate the volume of G352.7−0.1
to be a spheroid with radii of 2.4 arcmin × 2.1 arcmin × 2.3
arcmin (corresponding to radii of 5.2 pc × 4.6 pc × 5.0 pc at
the assumed distance of 7.5 kpc to the SNR), the correspond-
ing volume of the SNR is ∼1.1 × 1058
cm−3
. Using Equa-
tion (1), we calculate (for the ejecta-dominated component) an
electron density of ne = 0.33 cm−3
, a proton density of np =
0.28 cm−3
, and an X-ray emitting mass of MX = ne × np ×
V = 2.6 M . Applying the same equation to the ISM-dominated
component, we calculate ne = 6.0 cm−3
, np = 4.9 cm−3
, and
MX = 45 M . While the calculated X-ray emitting mass for
the ejecta-dominated component of the SNR is comparable to
that seen for other Galactic SNRs, the X-ray emitting mass for
the ISM-dominated component of the SNR is remarkably large.
For comparison purposes, Rho & Borkowski (2002) estimated
that the swept-up X-ray emitting mass associated with the MM
SNR W28 was only ∼20–25 M . From Equation (2), we calcu-
late corresponding pressures of the ejecta-dominated component
and the ISM-dominated components to be 2.5 × 10⁷
cm−3
K
and 3.3 × 10⁷
cm−3
K, respectively. These two values are nearly
three orders of magnitude greater than the typical ISM pressure.
We then use Equation 3 to estimate the age of the SNR to be
t ∼ 1.7 × 10¹⁰
cm−3
s/0.33 cm−3
∼ 1600 yr. Finally, we es-
timate the initial explosion energy ESN of this supernova using
the well-known Sedov equation (Sedov 1959)
ESN =
r5
ρ
t2
. (4)
Assuming an age of t = 1600 yr, a radius of r = 4.9 pc, and a
mass density of ρ = npmp (where np = 4.6 cm−3
and mp is the
mass of a proton), we calculated ESN = 2.54 × 1051
erg.
We now compare our computed physical parameters with
those determined by Giacani et al. (2009). Our estimate of the
electron number density ne for the ejecta-dominated component
is quite similar to the value derived for that parameter by
those authors. Our estimate of the swept-up mass is higher
than that calculated by Giacani et al. (2009), whereas our age
estimate is less than half the age derived by those authors and
is comparable to the age estimate given by Kinugasa et al.
(1998). Our estimate of the initial explosion energy is also
an order of magnitude greater than the estimates of the initial
explosion energy provided by Giacani et al. (2009) and Kinugasa
et al. (1998). We attribute differences in part to our use of two
thermal components while fitting the extracted Chandra spectra,
whereas Giacani et al. (2009) only used a single component to
fit the extracted XMM-Newton spectra.
4.3. Is the X-Ray Emitting Plasma Associated With
G352.7−0.1 Overionized?
We now investigate whether the X-ray emitting plasma
associated with G352.7−0.1 is overionized. Here overionization
9
10. The Astrophysical Journal, 782:102 (14pp), 2014 February 20 Pannuti et al.
means that atomic species are observed to be in a higher
ionization state than expected on the basis of the observed
electron temperature of the X-ray emitting plasma. Several
Galactic MMSNRs are known to feature overionized X-ray
emitting plasmas; examples of such MMSNRs include IC
443 (Yamaguchi et al. 2009), W49B (Ozawa et al. 2009),
G346.6−0.2 (Yamauchi et al. 2012), and G359.0−0.1 (Ohnishi
et al. 2011). Reviews of the phenomenon of overionized X-ray
emitting plasmas associated with SNRs is provided by Miceli
et al. (2011) and Vink (2012).
To investigate whether or not the X-ray emitting plasma
associated with G352.7−0.1 is indeed overionized, we follow
the analysis presented by Yamauchi et al. (2012). Using the
SPEX software package (Kaastra et al. 1996), those authors
fitted the Suzaku XIS spectra of the SNR G346.6−0.2 using the
neij model. According to this model (see Yamauchi et al. 2012),
an X-ray emitting plasma may be described such that the initial
ion temperature kT Z and the original electron temperature kT e1
were the same (that is, kT Z = kT e1) and the plasma itself was
in collisional ionization equilibrium. Over time, the electron
temperature drops to kT e2 because of rapid electron cooling.
Such a model can reflect accurately a rapid electron cooling as
predicted in models of SNR evolution.
We used the SPEX (Version 2.03.03) tool trafo (Version
1.02) to convert the extracted Chandra spectral files for the
whole SNR into .spo files suitable for analysis by the software
package. We attempted to fit with the neij model by adopting a
value of 5 keV for the initial electron temperature kT e1 (similar
to the procedure taken by Yamauchi et al. 2012), freezing kT e1 to
this value and thawing the abundances of silicon and sulfur while
allowing the other fit parameters (NH, normalization, kT e2,
kT Z, and τ) to vary. We were unable to generate a statistically
acceptable fit using the neij model that is superior (i.e., with
a lower value for χ2
ν) than that obtained for the thermal models
described above. We therefore conclude that the X-ray emitting
plasma associated with G352.7−0.1 is not overionized.
4.4. Search for Unresolved X-Ray Sources
We next conducted a search for a neutron star associated with
G352.7−0.1, taking advantage of the high angular resolution
capabilities of Chandra. To the best of our knowledge, it
is the first search for the neutron star in G352.7−0.1. As
noted above, G352.7−0.1 is suspected to be interacting with
molecular clouds on the basis of the detection of maser emission;
such a result suggests (but does not prove) that the stellar
progenitor of G352.7−0.1 was formed near a molecular cloud
and is massive. Another robust argument for a massive stellar
progenitor associated with this SNR is the large calculated
swept-up mass of 45 M coupled with the X-ray emitting
ejecta mass of 2.6 M . Therefore, a search for the neutron star
produced in the same supernova explosion that parented this
SNR is warranted. There is also a possibility that the supernova
explosion that produced G352.7−0.1 may also have fostered a
black hole (see, e.g., Kaplan et al. 2004, 2006 for a discussion
on the nondetections of compact objects in several other SNRs).
To conduct our search, we used the CIAO tool dmcopy
to create an event list and a “hard” image for the energy
range from 2.0 to 10.0 keV. We then ran the CIAO tool
wavdetect—a wavelet-based unresolved source detection tool
(Freeman et al. 2002)—with its default parameters on this image
to find unresolved sources seen within the apparent angular
extent of G352.7−0.1. In Figure 8 we present our hard image
of G352.7−0.1 with the locations of the unresolved sources
Figure 8. Hard-band (2–10 keV) Chandra image of G352.7−0.1 with the
locations of the point sources detected using wavdetect marked and labeled.
See Section 4.4 and Table 8.
(A color version of this figure is available in the online journal.)
detected by wavdetect indicated. Six unresolved sources were
detected by this tool at a minimum of an S/N 4 level,
and properties of these sources are listed in Table 8. For the
two brightest detected sources, we performed spectral fitting in
XSPEC using an absorbed power law model with NH fixed at
2.6 × 10²²
cm−2
(the average Galactic value in this direction
for d ∼ 7.5 kpc). Because of the small number of counts, we did
not bin the data and used C-statistics while performing the fits.
Sources 1 and 2 both show extremely hard (albeit uncertain)
spectra with Γ = −0.4 ± 0.3 and Γ = −0.5 ± 0.4, respectively.
If NH is allowed to be free, its value increases by a factor of
two compared with the frozen value (for both sources), and the
photon indices become Γ ∼ 0.3 and Γ ∼ 0.1, respectively.
These parameters are, however, poorly constrained because of
the small total number of counts detected from each source,
especially at energies below 2 keV. Since it is unlikely for the
Galactic NH to be even larger,9
the spectra of these sources must
also be intrinsically hard. Such hard spectra are unusual for
young isolated neutron stars or pulsars, while the large X-ray to
near-infrared (K-band) flux ratio ( 30 in K-band) implies that
both sources are likely to be either heavily obscured (i.e., the
soft component is completely absorbed) magnetic cataclysmic
variables (CVs) in the hard state, obscured remote high mass
X-ray binaries (HMXBs) in the low hard state, or AGNs. The
rest of the sources in Table 8 have even fewer counts, which
precludes any spectral analysis in the X-ray. Sources 5 and 6
have counterparts detected in the near-infrared (by Two Micron
Sky Survey) and/or infrared (by the Spitzer GLIMPSE survey);
therefore, neither of them can be an isolated pulsar or neutron
star related to G352.7−0.1. Finally, very little information is
available about sources 3 and 4. The lack of near-infrared and
infrared counterparts for these sources coupled with their hard
band X-ray luminosities ( 1032
erg s−1
at d = 7.5 kpc) are
in principle consistent with those of isolated pulsars at this
distance. Indeed, as shown in the top panel in Figure 3 from
Kargaltsev et al. (2013), the scatter in the X-ray efficiencies
9 The average Galactic H i column density in this direction is
(1.4–1.6)×1022 cm−2—see Dickey & Lockman (1990).
10
11. The Astrophysical Journal, 782:102 (14pp), 2014 February 20 Pannuti et al.
Table 8
Unresolved Hard X-Ray Sources Detected by Chandra Toward G352.7−0.1
No. Source R.A. Decl. N0.2−10 f abs
0.2−2 f abs
2−10 HR Labs,2−10 Type
(J2000.0) (J2000.0)
1 CXOU J172726.9−350600 17 27 26.97 −35 06 00.2 80 0.1 67.5 1.00 45 mCV?/qHMXB?/AGN?
2 CXOU J172737.7−350616 17 27 37.74 −35 06 16.3 43 0 64.0 1.00 43 mCV?/qHMXB?/AGN?
3 CXOU J172737.9−350724 17 27 37.92 −35 07 24.2 28 0.9 13.3 0.87 8.9 mCV?/AGN?/PSR?/CCO?
4 CXOU J172748.2−350814 17 27 48.22 −35 08 14.4 16 0.1 19.1 0.99 13 mCV?/PSR?
5a CXOU J172744.0−350719 17 27 44.05 −35 07 18.9 14 0 25.6 1.00 17 K/M-dwarf/AGN?
6b CXOU J172743.0−350839 17 27 43.03 −35 08 38.8 13 1.1 14.0 0.85 9.4 AGN/PMS-star?
Notes. The units of Right Ascension are hours, minutes, and seconds, while the units of Declination are degrees, arcminutes, and arcseconds; N0.2−10 is the number
of source counts in 0.2–10 keV. The fluxes (f abs
0.2−2 and f abs
2−10 in 0.2–2 and 2–10 keV, respectively) are absorbed (calculated using the eff2evt CIAO tool; see
http://cxc.harvard.edu/ciao/threads/eff2evt/) in units of 10−15 erg cm−2 s−1. The hardness ratios “HR” are calculated on the basis of the fluxes f abs
0.2−2 and f abs
2−10,
specifically HR = (f abs
2−10 − f abs
0.2−2)/(f abs
2−10 + f abs
0.2−2). The luminosities Labs,2−10 are expressed in units of 1031 erg s−1 and are calculated from f abs
2−10 on the basis of
an assumed distance of 7.5 kpc to G352.7−0.1. The abbreviations for type classification are defined as follows: mCV = magnetic cataclysmic variable in low-hard
state, qHMXB = quasi-high mass X-ray binary, AGN = active galactic nuclei, PSR = pulsar, CCO = central compact object, and PMS-star = pre-main sequence
star. See Section 4.4.
a This source has a near-infrared counterpart detected with an apparent K-band magnitude of 12.0 and an infrared counterpart detected with an apparent 4.5 μm
magnitude of 11.0.
b This source has an infrared counterpart detected with an apparent 4.5 μm magnitude of 12.7.
(ηX = LX/ ˙E) of young (characteristic ages t 10 kyr; spin-
down energy-loss rates ˙E 1037
erg s−1
) pulsars is nearly
five orders of magnitude. Therefore, LX 1032
erg s−1
can
be accommodated by assuming low efficiency ηX 10−4
(although the number of known pulsars exhibiting such low
efficiencies is fairly small). Alternatively, sources 3 and 4 may
be remote faint AGNs whose soft X-ray and optical and near-
infrared emission is severely attenuated by the large absorbing
column along this line of sight.
We also comment on the possibility that a compact central
object (CCO) could be associated with G352.7−0.1. CCOs are
a type of isolated NSs that are found in the centers of their
host SNRs. They exhibit purely thermal emission (with surface
temperatures of kT ∼ 0.2–0.4 keV) and feature luminosities
of LX × 1033
erg s−1
over the 0.5 to 8 keV energy range (de
Luca 2008). Therefore, Source 3 could be an absorbed CCO
associated with G352.7−0.1. Alternatively, if G352.7−0.1 is
farther away than the assumed 7.5 kpc, the CCO (if it exists)
may not be detectable in the existing XMM-Newton and Chandra
data sets.
Since none of these six sources appears to be a particu-
larly promising candidate for a compact object associated with
G352.7−0.1, there remains an open question about the pres-
ence of a compact object leftover from the supernova explosion
(assuming it was indeed a core-collapse supernova and not a
Type Ia supernova). The remaining option would be an isolated
black hole, which can be difficult to detect because of the very
low accretion rate (assuming Bondi–Hoyle accretion) inside the
rarefied hot gas filling the interior of the SNR (Beskin & Karpov
2005).
We also note that none of the sources detected by wavdetect
at a signal-to-noise ratio of four or greater are physically
coincident with the radio sources WBH2005 352.775-0.153
and WBH2005 352.772-0.149 seen toward the eastern rim
of the SNR and speculated to be associated with a distant
AGN (see Section 1). We therefore place an upper limit of
∼10−16
erg cm−2
s−1
on the absorbed X-ray fluxes from these
two radio sources.
4.5. Infrared Emission from G352.7−0.1
We searched for an infrared counterpart to G352.7−0.1 by
examining archival observations of the field that includes this
SNR. We find a counterpart from data collected at a wavelength
of 24 μm made with the Multiband Imaging Photometer (MIPS,
Rieke et al. (2004)) on board the Spitzer Space Telescope
(Werner et al. 2004) as part of the MIPSGAL survey that
sampled the inner Galactic plane at the wavelengths of 24 μm
and 70 μm (Carey et al. 2009). In Figure 9, we present three
images of G352.7−0.1 at different wavelengths—namely a
broadband (0.5–8.0 keV) X-ray image made with Chandra,
an infrared 24 μm image made with MIPS on board Spitzer,
and a radio continuum 6 cm map made with the VLA. As
we previously mentioned, one can clearly see the contrasting
center-filled X-ray morphology and shell-like radio morphology
that categorize G352.7−0.1 as an MMSNR. Also note in these
images the strong correlation between the regions of infrared
emission and regions of radio emission. At both wavelengths,
a nearly complete inner ring of emission is seen along with an
outer incomplete ring of emission seen toward the southeast. A
study of 14 Galactic SNRs detected by MIPS was presented
by Andersen et al. (2011). Those authors found evidence
for interactions between these SNRs and adjacent molecular
clouds on the basis of the detection of [O i] emission ionic
lines and emission from molecular lines. We suspect that the
observed flux as detected by MIPS from G352.7−0.1 probably
has a very similar origin. We also note that—like all of
the sources considered in the survey conducted by Andersen
et al. (2011)—G352.7−0.1 is an MMSNR. We therefore argue
that the detection of infrared emission from this SNR helps
strengthen the link between MMSNRs and SNRs interacting
with adjacent molecular clouds. In a recent work (Pannuti et al.
2013), we found additional evidence for this link in a study of the
X-ray properties of four Galactic MMSNRs that were detected
by Spitzer at shorter infrared wavelengths (such as 4.5 μm) with
the Infrared Array Camera (Fazio et al. (2004)) in the survey
conducted by Reach et al. (2006).
4.6. G352.7−0.1: An Ejecta-dominated
Mixed-morphology SNR
In Table 9 we provide a list of known Galactic MMSNRs
that are known to feature ejecta-dominated X-ray emission. By
“ejecta-dominated,” we mean that the measured abundances
of certain elements (metals) are elevated relative to solar
abundances. Examples of such elements are silicon and sulfur,
11
12. The Astrophysical Journal, 782:102 (14pp), 2014 February 20 Pannuti et al.
Figure 9. Multiwavelength images of G352.7−0.1. (left) A Chandra broadband X-ray image (0.5–8.0 keV) adaptively smoothed with the CIAO tool asmooth. (center)
A Spitzer MIPS 24 micron image. [(right)] VLA 6 cm image. Notice the contrasting X-ray and radio morphologies of the SNR (typical of MMSNRs) and the robust
morphological similarities between the infrared and radio images. See Section 4.5.
(A color version of this figure is available in the online journal.)
Table 9
List of Known Ejecta-dominated Mixed-morphology SNRs
SNR Reference
W44 (G34.7−0.4) Shelton et al. (2004)
W49B (G43.3−0.2) Ozawa et al. (2009)
HB 21 (G89.0+4.7) Lazendic & Slane (2006), Pannuti et al. (2010)
CTB 1 (G116.9+0.2) Lazendic & Slane (2006), Pannuti et al. (2010)
HB 3 (G132.7+1.3) Lazendic & Slane (2006)
IC 443 (G189.1+3.0) Troja et al. (2008), Yamaguchi et al. (2009)
Kes 27 (G327.4+0.4) Chen et al. (2008)
G344.7−0.1 Yamaguchi et al. (2012)
G352.7−0.1 Kinugasa et al. (1998), Giacani et al. (2009), this paper
G359.1−0.5 Ohnishi et al. (2011)
Note. See Section 4.6.
which are seen to be elevated in the X-ray emitting plasmas of
MMSNRs. In Table 9 we list examples of sources of this type.
As shown in this paper and in previous analyses conducted by
Kinugasa et al. (1998) and Giacani et al. (2009), G352.7−0.1
(similar to HB 21 and G359.1−0.1) features silicon and sulfur
abundances that exceed solar.
The origin of ejecta-dominated emission from MMSNRs
remains elusive. Estimates of the ages of MMSNRs often
hover near ∼104
yr. For such ages, the X-ray emitting plasma
associated with an SNR is expected to be dominated by the
swept-up ISM rather than ejecta with elemental abundances
comparable to solar. Ejecta-dominated MMSNRs appear to
represent a new evolutionary scenario through which sources
of this type are formed. As summarized by Vink (2012), a
high metal content in the X-ray emitting plasma may help
explain the observed emission characteristics of MMSNRs for
two reasons. Firstly, metal-rich plasmas produce more X-ray
emission than plasmas that are not metal enhanced; this leads
to a contrast between the X-ray emitting metal-rich interior
and the metal-poor swept-up exterior of the SNR. Secondly,
the uniform temperatures in the interiors of MM SNRs can be
explained using thermal conduction models (Cox et al. 1999).
This explanation is challenged by magnetic fields limiting
thermal conduction along magnetic field lines, but if the interiors
of MM SNRs are dominated by ejecta, then the stellar magnetic
field may be reduced because of the expansion and thus becomes
significantly weakened (to values as low as 10−14
G—see
Vink 2012). At such a low value, conduction across field
lines becomes as efficient as conduction along field lines; thus,
thermal conduction becomes efficient in these conditions but
only to the boundaries between the ejecta-dominated matter
and swept-up matter. At these boundaries, Rayleigh–Taylor
instabilities may contain magnetic fields with elevated strengths,
thus hampering efficient thermal conduction.
Of the SNRs listed in Table 9, the only two that may
possibly host neutron stars are CTB 1 (Pannuti et al. 2010)
and IC 443. However, in the case of IC 443, the observed
neutron star is unlikely to be associated with the SNR because
it is observed to move in the wrong direction (i.e., toward
the center of the SNR—see Swartz et al. 2013). Therefore, it
may be that MMSNRs are such that after the explosion, their
progenitors do not leave a neutron star: either a black hole is
produced or nothing is left. If the ejecta mass is large, then
it is likely that the progenitor star was a massive star and a
black hole was left behind. Such progenitors may explain the
elevated abundances in MMSNRs and the fact that they are
close to molecular clouds (where massive stars are formed more
easily).
We have searched for other characteristics that the SNRs
listed in Table 9 may have in common. For example, we
considered whether the radio morphologies of these SNRs are all
similar, such as bilateral (also known as “barrel-shaped”—see
Kesteven & Caswell 1987); examples of well-known barrel-
shaped Galactic SNRs include G296.5+10.0 (Storey et al. 1992)
and G320.4−1.2 (Dubner et al. 2002). In fact, a seminal study
of Galactic SNRs presented by Kesteven & Caswell (1987) that
classified these sources on the basis of their radio morphologies
did indeed identify one of the SNRs in Table 9—namely
CTB 1—as a “well-developed” barrel. Other SNRs like W44,
HB21, HB3, IC 443, and Kes 27 were described as “difficult
to classify” by those authors. More recently, Keohane et al.
(2007) argued that the SNR W49B should be classified as
a barrel-shaped SNR (it had been classified as a “possible
barrel” by Kesteven & Caswell 1987). More detailed radio
observations and analyses need to be conducted of these SNRs
(and the sample of known ejecta-dominated MMSNRs must
be increased) to determine if the barrel-shape morphology is
consistently seen among these sources.
12
13. The Astrophysical Journal, 782:102 (14pp), 2014 February 20 Pannuti et al.
5. CONCLUSIONS
The conclusions of this paper may be summarized as follows:
1. Complementary XMM-Newton and Chandra observations
of the Galactic SNR G352.7−0.1 confirm a center-filled
thermal morphology with a contrasting shell-like radio
morphology. These observations motivate a classification
of this source as an MMSNR.
2. Analysis of extracted XMM-Newton spectra for the whole
SNR and for the bright eastern region can be fit satisfactorily
with a single thermal component that describes an X-
ray emitting plasma that is not in collisional ionization
equilibrium with enhanced abundances of silicon and sulfur.
This result is consistent with previous analyses of extracted
ASCA and XMM-Newton spectra of this SNR. In contrast,
an analysis (presented here for the first time) of extracted
Chandra spectra of the whole SNR as well as separate
regions of the SNR cannot all be fit satisfactorily with
a single thermal component. In the cases of the “left”
and “top” regions as well as the whole SNR, statistically
acceptable fits are obtained when either a second thermal
component with solar abundances is added or when two
thermal components with different temperatures (one with
enhanced silicon abundance and the other with enhanced
sulfur abundance). We argue that the former scenario is
more physically plausible.
3. We have calculated physical parameters (computed on the
basis of our derived fit parameters) for G352.7−0.1, includ-
ing ne, np, P, M, and t. Most notably, our computed masses
of the X-ray emitting masses of the ejecta-dominated com-
ponent and the ISM-dominated component are 2.6 M and
45 M , respectively. This is a remarkably high swept-up
mass for a Galactic SNR and may indicate a unique evo-
lutionary scenario (involving a massive progenitor star in-
teracting with a dense molecular cloud environment) for
this SNR.
4. We have conducted a spectral analysis of the extracted
Chandra spectrum of the whole SNR to determine if
the X-ray emitting plasma associated with this SNR is
overionized. We cannot obtain a satisfactory fit to the
extracted spectrum using the neij model with parameters
that might indicate overionization. Therefore, we conclude
that the X-ray emitting plasma associated with G352.7−0.1
is not overionized.
5. We have searched for a hard unresolved X-ray source that
may be the neutron star associated with G352.7−0.1. We
find six unresolved X-ray sources seen in projection toward
the interior of the SNR, but none of these sources may
be firmly classified as a neutron star physically associated
with G352.7−0.1. We also find no X-ray counterparts to
the background radio galaxy (with prominent radio lobes)
seen in projection toward the eastern rim of the SNR.
6. We have presented for the first time the detection of
infrared emission (namely emission detected at 24 μm by
the MIPS on board Spitzer) from this SNR. The infrared
morphology is shell-like and strongly resembles the radio
morphology, including the complete inner radio shell and
incomplete outer radio shell. Such emission has been
detected previously from SNRs known to be interacting
with adjacent molecular clouds; this detection helps confirm
that G352.7−0.1 is indeed interacting with an adjacent
molecular cloud.
7. We have compared G352.7−0.1 with other ejecta-
dominated MMSNRs. The origin of ejecta-dominated emis-
sion from MMSNRs remains unknown and may indicate a
new scenario for the evolution of this class of source.
We thank the referee for helpful comments and suggestions
that have improved the quality of this manuscript. This research
has been supported by a grant from the Kentucky Space
Grant Consortium. O.K. acknowledges support from archival
Chandra/NASA award AR3-14017X. T.G.P. thanks Jelle de
Plaa for his assistance with installing and using the SPEX
software package; he also thanks Keith Arnaud for helpful
assistance in the use of the XSPEC software package. T.G.P. also
thanks David Alex May and Tiffany Murray for their assistance
in reducing the Chandra data for G352.7−0.1. We also thank
Gloria Dubner for kindly sharing her radio maps of G352.7−0.1
with us. This research has made use of NASA’s Astrophysics
Data System and the NASA/IPAC Extragalactic Database
(NED), which is operated by the Jet Propulsion Laboratory,
California Institute of Technology, under contract with the
National Aeronautics and Space Administration. This research
has also made use of data obtained from the Chandra Data
Archive and software provided by the Chandra X-ray Center
(CXC) in the application packages CIAO and ChIPS. Finally,
this work is based on observations obtained with XMM-Newton,
an ESA science mission with instruments and contributions
directly funded by ESA Member States and the USA (NASA).
REFERENCES
Andersen, M., Rho, J., Reach, W. T., Hewitt, J. W., & Bernard, J. P. 2011, ApJ,
742, 7
Beskin, G. M., & Karpov, S. V. 2005, A&A, 440, 223
Borkowski, K. J., Lyerly, W. J., & Reynolds, S. P. 2001, ApJ, 548, 820
Burke, B. E., Mountain, R. W., Daniels, P. J., Cooper, M. J., & Dolat, V. S.
1993, Proc. SPIE, 2006, 272
Carey, S. J., Noriega-Crespo, A., Mizuno, D. R., et al. 2009, PASP, 121, 76
Caswell, J. L., Haynes, R. F., Milne, D. K., & Wellington, K. J. 1983, MNRAS,
203, 595
Chen, Y., Seward, F. D., Sun, M., & Li, J. 2008, ApJ, 676, 1040
Clark, D. H., Caswell, J. L., & Green, A. J. 1973, Natur, 246, 28
Clark, D. H., Caswell, J. L., & Green, A. J. 1975, AuJPA, 37, 1
Cox, D. P., Shelton, R. L., Maciejewski, W., et al. 1999, ApJ, 524, 179
de Luca, A. 2008, in AIP Conf. Proc. 983, 40 Years of Pulsars: Millisecond
Pulsars, Magnetars and More, ed. C. Bassa et al. (Melville, NY: AIP), 311
Dickey, J. M., & Lockman, F. J. 1990, ARA&A, 28, 215
Dubner, D. M., Gaensler, B. M., Giacani, E. B., Goss, W. M., & Green, A. J.
2002, AJ, 123, 337
Dubner, G. M., Moffett, D. A., Goss, W. M., & Winkler, P. F. 1993, AJ,
105, 2251
Fazio, G. G., Hora, J. L., Allen, L. E., et al. 2004, ApJS, 154, 10
Freeman, P. E., Kashyap, V., Rosner, R., & Lamb, D. Q. 2002, ApJS, 138, 185
Fruscione, A., McDowell, J. C., Allen, G. E., et al. 2006, Proc. SPIE, 6720, 60
Gabriel, C., Denby, M., Fyfe, D. J., et al. 2004, in Astronomical Data Analysis
Software and Systems (ADASS) XIII, Vol. 314, ed. F. Ochsenbein, M. G.
Allen, & D. Egret (San Francisco, CA: ASP), 759
Garmire, G. P., Bautz, M. W., Ford, P. G., Nousek, J. A., & Ricker, G. R., Jr.
2003, Proc. SPIE, 4851, 28
Giacani, E., Smith, M. J. S., Dubner, G., et al. 2009, A&A, 507, 841
Green, A. J., Frail, D. A., Goss, W. M., & Otrupcek, R. 1997, AJ, 114, 2058
Green, D. A. 2009a, A Catalogue of Galactic Supernova Remnants (2009 March
version), Astrophysics Group, Cavendish Laboratory (Cambridge: Cam-
bridge Univ. Press) (available at http://www.mrao.cam.ac.uk/sureys/snrs/)
Green, D. A. 2009b, BASI, 37, 45
Hamilton, A. J. S., Sarazin, C. L., & Chevalier, R. A. 1983, ApJS, 51, 115
Jansen, F., Lumb, D., Altieri, B., et al. 2001, A&A, 365, L1
Kaastra, J. S., Mewe, R., & Nieuwenhuijzen, H. 1996, in UV and X-ray
Spectroscopy of Astrophysical and Laboratory Plasmas, ed. K. Yamashita &
T. Watanabe (Tokyo: Universal Academy Press), 411
Kaplan, D. L., Frail, D. A., Gaensler, B. M., et al. 2004, ApJS, 153, 269
13
14. The Astrophysical Journal, 782:102 (14pp), 2014 February 20 Pannuti et al.
Kaplan, D. L., Gaensler, B. M., Kulkarni, S. R., & Slane, P. O. 2006, ApJS,
163, 344
Kargaltsev, O., Pavlov, G. G., & Durant, M. 2013, in ASP Conf. Ser. 466,
Electromagnetic Radiation from Pulsars and Magnetars, ed. W. Lewandowki,
O. Maron, & K. Kijak (San Francisco, CA: ASP), 167
Keohane, J. W., Reach, W. T., Rho, J., & Jarrett, T. H. 2007, ApJ, 654, 938
Kesteven, M. J., & Caswell, J. L. 1987, A&A, 183, 118
Kinugasa, K., Torii, K., Tsunemi, H., et al. 1998, PASJ, 50, 249
Koralesky, B., Frail, D. A., Goss, W. M., Claussen, M. J., & Green, A. J.
1998, AJ, 116, 1323
Lazendic, J. S., & Slane, P. O. 2006, ApJ, 647, 350
Liedahl, D. A., Osterheld, A. L., & Goldstein, W. H. 1995, ApJL, 438, L115
Makishima, K., Tashiro, M., Ebisawa, K., et al. 1996, PASJ, 48, 171
Mazzotta, P., Mazzitelli, G., Colafrancesco, S., & Vittorio, N. 1998, A&AS,
133, 403
Miceli, M. 2011, MmSAI, 82, 709
Ohashi, T., Ebisawa, K., Fukazawa, Y., et al. 1996, PASJ, 48, 157
Ohnishi, T., Koyama, K., Tsuru, T. G., et al. 2011, PASJ, 63, 257
Ozawa, M., Koyama, K., Yamaguchi, H., Masai, K., & Tamagawa, T.
2009, ApJL, 706, L71
Pannuti, T. G., Rho, J., Borkowski, K. J., & Cameron, P. B. 2010, AJ, 140,
1787
Pannuti, T. G., Rho, J., Heinke, C. O., & Moffitt, W. P. 2013, AJ, in press
(arXiv:1312.3929)
Reach, W. T., Rho, J., Tappe, A., et al. 2006, AJ, 131, 1479
Rieke, G. H., Young, E. T., Engelbracht, C. W., et al. 2004, ApJS, 154, 25
Reynolds, S. P., & Keohane, J. W. 1999, ApJ, 525, 368
Rho, J., & Borkowski, K. J. 2002, ApJ, 575, 201
Rho, J., & Petre, R. 1998, ApJL, 503, L167
Sedov, L. I. 1959, Similarity and Dimensional Methods in Mechanics
(New York: Academic)
Serlemitsos, P. J., Jalota, L., Soong, Y., et al. 1995, PASJ, 47, 105
Shelton, R. L., Kuntz, K. D., & Petre, R. 2004, ApJ, 611, 906
Storey, M. C., Staveley-Smith, L., Manchester, R. N., & Kesteven, M. J. 1992,
A&A, 265, 752
Str¨uder, L., Briel, U., Dennerl, K., et al. 2001, A&A, 365, L18
Sugizaki, M., Mitsuda, K., Kaneda, H., et al. 2001, ApJS, 134, 77
Swartz, D. A., Weisskopf, M. C., Zavlin, V., et al. 2013, HEAD, 13, 127.05
Tanaka, Y., Inoue, H., & Holt, S. S. 1994, PASJ, 46, L37
Toledo-Roy, J. C., Vel´azquez, P. F., Esquivel, A., & Giacani, E. 2014, MNRAS,
437, 898
Troja, E., Bocchino, F., Miceli, M., & Reale, F. 2008, A&A, 485, 777
Turner, M. J. L., Abbey, A., Arnaud, M., et al. 2001, A&A, 365, L27
Vink, J. 2012, A&ARv, 20, 49
Weisskopf, M. C., Brinkman, B., Canizares, C., et al. 2002, PASP, 114, 1
Werner, M. W., Roellig, T. L., Low, F. J., et al. 2004, ApJS, 154, 1
White, R. L., Becker, R. H., & Helfand, D. J. 2005, AJ, 130, 586
White, R. L., & Long, K. S. 1991, ApJ, 373, 543
Whiteoak, J. B. Z., & Green, A. J. 1998, A&AS, 118, 329
Yamaguchi, H., Ozawa, M., Koyama, K., et al. 2009, ApJL, 705, L6
Yamaguchi, H., Tanaka, M., Maeda, K., et al. 2012, ApJ, 749, 137
Yamauchi, S., Nobukawa, M., Koyama, K., & Yonemori, M. 2012, PASJ, 65, 6
14