SlideShare a Scribd company logo
1 of 1
Are Chlorine Levels in Niagara County Household Water During the Winter /
             Spring Season Within the United States Laws and Regulation Standards: Field
                                              Research
                                                                    Researched by: Jameieka Price
                              Mentored by Research Scientist of the Geography Department and Great Lakes Center: Dr. Charlotte Roehm

                                                                                                                          Free CL Vs. Total CL in Residential Sink Water
                          INTRODUCTION                                                                        1.2
                                                                                                                                                                                                                                                                         DISCUSSION/CONCLUSION
                                                                                                                                                                                                        Max Chlorine
                                                                                                                                                                                                          Levels


      Chlorination’s main purpose is to kill bacteria,                                                          1                                                                                    WHO – 0.3 mg /l                                        The researched determined that the water
   algae, microorganisms and other water borne                                                                                                                                                       SWDA -0.2 mg /l                                   treatment plant in Niagara County is not in


                                                                                   CL Concentration (mg/l)
   pathogens. It sanitizes and oxidizes to keep water                                                        0.8                                                                                     EPA – 0.3 mg/l                                    compliance when treating water with chlorine.
   free of bacteria. Chlorination is used in municipal                                                                                                                                                 Recommended
                                                                                                                                                                                                        Level to kill
                                                                                                                                                                                                                                                       The results of both the questionnaire and
   water treatment plants to disinfect water                                                                 0.6                                                                                         Microbials                                    physical measurements of this study, show that
   particularly for Escherichia coli (E. coli) and                                                                                                                                                   0.3 mg/l – 1.2 mg/l                               some participants are at risk of exposure to
   Cryptosporidium. The problem with chlorination is                                                         0.4                                                                                         Free Cl (cold
                                                                                                                                                                                                                                                       chlorination. The Agricultural area had low
   that the chlorine by-products and the concentration
                                                                                                                                                                                                         water)
                                                                                                                                                                                                                                                       risk factors for the usage of water and the
   of residual chlorine can cause alternative adverse                                                        0.2                                                                                                                                       Urban and Industrial area had intermediate
                                                                                                                                                                                                         Total Cl (cold
   health effects such as cancer and…. As a result                                                                                                                                                       water)                                        health risk factors for using the water on a
   federal regulations have been made to set standards                                                         0                                                                                                                                       daily basis. The household that had the highest
   to minimize these risks. Sink and shower water from
                                                                                                                      1    2   3    4    5     6   7    8    9    10   11     12   13    14   15
                                                                                                                                                                                                                                                       fraction of chlorination levels was in the
                                                                                                                                             Number of Households
   a range of households in Niagara County Household                                                                                                                                                                                                   industrial area and the water appeared cloudy.
                                                                                   Figure 5 Regulation Standards For Cl
   was tested to determine the levels of chlorine in the                                     WH0 – World Health Organization ; SWDA – Safe Water Drinking Act ; EPA- Environmental
                                                                                                                                                                                                                                                       Temperature and pH determines the outcome
   water were high enough to affect public health and                                        Protection Agency                                                                                                                                         of the chlorinated water in this case there was
   if the municipal treatment plants are in compliance                                                       Table 1 Regulation Standards for Chlorine                                                                                                 no correlation between temperature and pH.
   with the laws and regulations.                                                                                    EPA                WHO                 EPA             WHO               SDWA

  Figure 1 Urban Area      Figure 2 Industrial Area   Figure 3 Agricultural Area                              Combined Cl          Combined Cl         Residual Cl Residual Cl Residual Cl
                                                                                                                                                                                                                                                                        Fraction of Free and Total Cl
                                                                                                                                                                                                                                                            100
                                                                                                                    0.5 mg/l            3mg/l            4 mg/l             0.3 mg/l          0.2 mg/l


                                                                                                                                                                                                                           Fraction of Free and Total
                                                                                                                                                                                                                                                             90
                                                                                                                                                                                                                                                             80
                                                                                                                                                                                                                                                             70                                                       Industrial Warm
                                                                                                                                                                                                                                                             60                                                       Agricultural Warm


                                                                                                                                                                                                                                    Cl mg/l
                                                                                                                                                                                                                                                             50
                                                                                                                                                   RESULTS                                                                                                   40
                                                                                                                                                                                                                                                             30
                                                                                                                                                                                                                                                                                                                      Urban Warm
                                                                                                                                                                                                                                                                                                                      Industrial Cold
                                                                                                                                                                                                                                                             20
                                                                                                                                                                                                                                                                                                                      Agricultural Cold
                                                                                                                                                                                                                                                             10
                                                                                                                                                                                                                                                              0                                                       Urban Cold
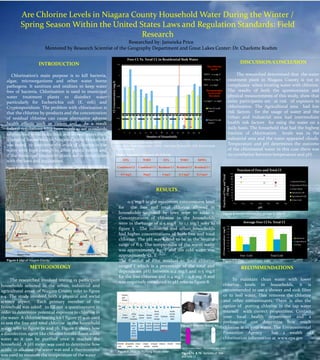
                                                                                                                    0.5 mg/l is the maximum contaminant level                                                                                                     6.3      6.4   6.5   6.6   6.7       6.8      6.9

                                                                                                               for the free and total chlorine allowed in                                                                                                                              pH

                                                                                                               households imposed by laws refer to table 1.                                                                 Figure 8 Percent Contribution of Free & Total Cl
                                                                                                               Concentrations of chlorine in the households
                                                                                                               were in the range of 0.5 mg/l to 1.1 mg/l refer to                                                                                                           Average Free Cl Vs. Total Cl
                                                                                                                                                                                                                                                      0.9
                                                                                                               figure 5 . The industrial and urban households
                                                                                                                                                                                                                           Cl Concentration ( mg/l)
                                                                                                                                                                                                                                                      0.8
                                                                                                                                                                                                                                                      0.7
                                                                                                               had higher concentrations of both free and total                                                                                       0.6
                                                                                                                                                                                                                                                      0.5
                                                           Lasalle                                             chlorine. The pH was found to be in the neutral                                                                                        0.4
                                                                                                                                                                                                                                                                                                                          Industrial
                                                                                                                                                                                                                                                                                                                          Agricultural
                                                                                                                                                                                                                                                      0.3
                                                                                                               range of 6.5. The temperature of the warm water                                                                                        0.2                                                                 Urban
                                                                                                                                                                                                                                                      0.1
                                                                                                               was approximately 89 F and the cold water was                                                                                            0
          Niagara River                                 Water Treatment Plant
                                                                                                               approximately 52 F.                                                                                                                                       Free Cold                 Total Cold
   Figure 4 Map of Niagara County                                                                              The fraction of Free residual to Total chlorine                                                              Figure 9 Average Concentration levels

                      METHODOLOGY                                                                              ranged ( which is a percentage of the total and                                                                                                            RECOMMENDATIONS
                                                                                                               depends on pH) between 0.2 mg/l and 0.5 mg/l
                                                                                                               for the free chlorine and 0.4 mg/l – 0.8 mg /l and
     The researched involved testing 15 participant                                                                                                                                                                              To maintain clean water with lower
                                                                                                               was negatively correlated to pH refer to figure 8.
households selected in the urban, industrial and                                                                                                                                                                            chlorine levels in households, it is
agricultural areas; of Niagara County refer to figure                                                                                                                                                                       recommended to use a shower and sink filter
1-4. The study involved both a physical and social                                                                                                                                                                          or to boil water. This removes the chlorine
science aspect. Each primary member of the                                                                                                                                                                                  and other contaminants. There is also the
household was asked to fill out a questionnaire in                                                                                                                                                                          option of putting chlorine in the tap water
order to determine potential exposure to chlorine in                                                                                                                                                                        yourself with correct proportions. Contact
the water. A chlorine testing kit ( figure 7) was used                                                                                                                                                                      your local health department and a
to test the free and total chlorine in the household                                                                                                                                                                        professional can determine how much
                                                                                                                                                                             Figure 7 Chlorine Testing Kit
water refer to figure 7a and 7b. Figure 6 shows how                                                                                                                                                                         chlorine is in your water. The Environmental
a disinfection agent like chlorine breaks down waste                                                                                                                                                                        Protection Agency         has a wealth of
water so it can be purified once it reaches the                                                                                                                                                                             chlorination information at www.epa.gov
household. A pH meter was used to determine how
                                                                                                                                                                              7a Chlorinated Water   7b Chlorine free Water
acidic or alkaline the water was and a thermometer                                                            Figure 6 Steps for Purifying Waste Water
                                                                                                                                                                              Figure 7a & 7b Samples of free
was used to measure the temperature of the water.                                                                                                                             and total Cl

More Related Content

Featured

Product Design Trends in 2024 | Teenage Engineerings
Product Design Trends in 2024 | Teenage EngineeringsProduct Design Trends in 2024 | Teenage Engineerings
Product Design Trends in 2024 | Teenage EngineeringsPixeldarts
 
How Race, Age and Gender Shape Attitudes Towards Mental Health
How Race, Age and Gender Shape Attitudes Towards Mental HealthHow Race, Age and Gender Shape Attitudes Towards Mental Health
How Race, Age and Gender Shape Attitudes Towards Mental HealthThinkNow
 
AI Trends in Creative Operations 2024 by Artwork Flow.pdf
AI Trends in Creative Operations 2024 by Artwork Flow.pdfAI Trends in Creative Operations 2024 by Artwork Flow.pdf
AI Trends in Creative Operations 2024 by Artwork Flow.pdfmarketingartwork
 
PEPSICO Presentation to CAGNY Conference Feb 2024
PEPSICO Presentation to CAGNY Conference Feb 2024PEPSICO Presentation to CAGNY Conference Feb 2024
PEPSICO Presentation to CAGNY Conference Feb 2024Neil Kimberley
 
Content Methodology: A Best Practices Report (Webinar)
Content Methodology: A Best Practices Report (Webinar)Content Methodology: A Best Practices Report (Webinar)
Content Methodology: A Best Practices Report (Webinar)contently
 
How to Prepare For a Successful Job Search for 2024
How to Prepare For a Successful Job Search for 2024How to Prepare For a Successful Job Search for 2024
How to Prepare For a Successful Job Search for 2024Albert Qian
 
Social Media Marketing Trends 2024 // The Global Indie Insights
Social Media Marketing Trends 2024 // The Global Indie InsightsSocial Media Marketing Trends 2024 // The Global Indie Insights
Social Media Marketing Trends 2024 // The Global Indie InsightsKurio // The Social Media Age(ncy)
 
Trends In Paid Search: Navigating The Digital Landscape In 2024
Trends In Paid Search: Navigating The Digital Landscape In 2024Trends In Paid Search: Navigating The Digital Landscape In 2024
Trends In Paid Search: Navigating The Digital Landscape In 2024Search Engine Journal
 
5 Public speaking tips from TED - Visualized summary
5 Public speaking tips from TED - Visualized summary5 Public speaking tips from TED - Visualized summary
5 Public speaking tips from TED - Visualized summarySpeakerHub
 
ChatGPT and the Future of Work - Clark Boyd
ChatGPT and the Future of Work - Clark Boyd ChatGPT and the Future of Work - Clark Boyd
ChatGPT and the Future of Work - Clark Boyd Clark Boyd
 
Getting into the tech field. what next
Getting into the tech field. what next Getting into the tech field. what next
Getting into the tech field. what next Tessa Mero
 
Google's Just Not That Into You: Understanding Core Updates & Search Intent
Google's Just Not That Into You: Understanding Core Updates & Search IntentGoogle's Just Not That Into You: Understanding Core Updates & Search Intent
Google's Just Not That Into You: Understanding Core Updates & Search IntentLily Ray
 
Time Management & Productivity - Best Practices
Time Management & Productivity -  Best PracticesTime Management & Productivity -  Best Practices
Time Management & Productivity - Best PracticesVit Horky
 
The six step guide to practical project management
The six step guide to practical project managementThe six step guide to practical project management
The six step guide to practical project managementMindGenius
 
Beginners Guide to TikTok for Search - Rachel Pearson - We are Tilt __ Bright...
Beginners Guide to TikTok for Search - Rachel Pearson - We are Tilt __ Bright...Beginners Guide to TikTok for Search - Rachel Pearson - We are Tilt __ Bright...
Beginners Guide to TikTok for Search - Rachel Pearson - We are Tilt __ Bright...RachelPearson36
 
Unlocking the Power of ChatGPT and AI in Testing - A Real-World Look, present...
Unlocking the Power of ChatGPT and AI in Testing - A Real-World Look, present...Unlocking the Power of ChatGPT and AI in Testing - A Real-World Look, present...
Unlocking the Power of ChatGPT and AI in Testing - A Real-World Look, present...Applitools
 
12 Ways to Increase Your Influence at Work
12 Ways to Increase Your Influence at Work12 Ways to Increase Your Influence at Work
12 Ways to Increase Your Influence at WorkGetSmarter
 

Featured (20)

Product Design Trends in 2024 | Teenage Engineerings
Product Design Trends in 2024 | Teenage EngineeringsProduct Design Trends in 2024 | Teenage Engineerings
Product Design Trends in 2024 | Teenage Engineerings
 
How Race, Age and Gender Shape Attitudes Towards Mental Health
How Race, Age and Gender Shape Attitudes Towards Mental HealthHow Race, Age and Gender Shape Attitudes Towards Mental Health
How Race, Age and Gender Shape Attitudes Towards Mental Health
 
AI Trends in Creative Operations 2024 by Artwork Flow.pdf
AI Trends in Creative Operations 2024 by Artwork Flow.pdfAI Trends in Creative Operations 2024 by Artwork Flow.pdf
AI Trends in Creative Operations 2024 by Artwork Flow.pdf
 
Skeleton Culture Code
Skeleton Culture CodeSkeleton Culture Code
Skeleton Culture Code
 
PEPSICO Presentation to CAGNY Conference Feb 2024
PEPSICO Presentation to CAGNY Conference Feb 2024PEPSICO Presentation to CAGNY Conference Feb 2024
PEPSICO Presentation to CAGNY Conference Feb 2024
 
Content Methodology: A Best Practices Report (Webinar)
Content Methodology: A Best Practices Report (Webinar)Content Methodology: A Best Practices Report (Webinar)
Content Methodology: A Best Practices Report (Webinar)
 
How to Prepare For a Successful Job Search for 2024
How to Prepare For a Successful Job Search for 2024How to Prepare For a Successful Job Search for 2024
How to Prepare For a Successful Job Search for 2024
 
Social Media Marketing Trends 2024 // The Global Indie Insights
Social Media Marketing Trends 2024 // The Global Indie InsightsSocial Media Marketing Trends 2024 // The Global Indie Insights
Social Media Marketing Trends 2024 // The Global Indie Insights
 
Trends In Paid Search: Navigating The Digital Landscape In 2024
Trends In Paid Search: Navigating The Digital Landscape In 2024Trends In Paid Search: Navigating The Digital Landscape In 2024
Trends In Paid Search: Navigating The Digital Landscape In 2024
 
5 Public speaking tips from TED - Visualized summary
5 Public speaking tips from TED - Visualized summary5 Public speaking tips from TED - Visualized summary
5 Public speaking tips from TED - Visualized summary
 
ChatGPT and the Future of Work - Clark Boyd
ChatGPT and the Future of Work - Clark Boyd ChatGPT and the Future of Work - Clark Boyd
ChatGPT and the Future of Work - Clark Boyd
 
Getting into the tech field. what next
Getting into the tech field. what next Getting into the tech field. what next
Getting into the tech field. what next
 
Google's Just Not That Into You: Understanding Core Updates & Search Intent
Google's Just Not That Into You: Understanding Core Updates & Search IntentGoogle's Just Not That Into You: Understanding Core Updates & Search Intent
Google's Just Not That Into You: Understanding Core Updates & Search Intent
 
How to have difficult conversations
How to have difficult conversations How to have difficult conversations
How to have difficult conversations
 
Introduction to Data Science
Introduction to Data ScienceIntroduction to Data Science
Introduction to Data Science
 
Time Management & Productivity - Best Practices
Time Management & Productivity -  Best PracticesTime Management & Productivity -  Best Practices
Time Management & Productivity - Best Practices
 
The six step guide to practical project management
The six step guide to practical project managementThe six step guide to practical project management
The six step guide to practical project management
 
Beginners Guide to TikTok for Search - Rachel Pearson - We are Tilt __ Bright...
Beginners Guide to TikTok for Search - Rachel Pearson - We are Tilt __ Bright...Beginners Guide to TikTok for Search - Rachel Pearson - We are Tilt __ Bright...
Beginners Guide to TikTok for Search - Rachel Pearson - We are Tilt __ Bright...
 
Unlocking the Power of ChatGPT and AI in Testing - A Real-World Look, present...
Unlocking the Power of ChatGPT and AI in Testing - A Real-World Look, present...Unlocking the Power of ChatGPT and AI in Testing - A Real-World Look, present...
Unlocking the Power of ChatGPT and AI in Testing - A Real-World Look, present...
 
12 Ways to Increase Your Influence at Work
12 Ways to Increase Your Influence at Work12 Ways to Increase Your Influence at Work
12 Ways to Increase Your Influence at Work
 

Water Treatment Plant Health Effects in Niagara Falls

  • 1. Are Chlorine Levels in Niagara County Household Water During the Winter / Spring Season Within the United States Laws and Regulation Standards: Field Research Researched by: Jameieka Price Mentored by Research Scientist of the Geography Department and Great Lakes Center: Dr. Charlotte Roehm Free CL Vs. Total CL in Residential Sink Water INTRODUCTION 1.2 DISCUSSION/CONCLUSION Max Chlorine Levels Chlorination’s main purpose is to kill bacteria, 1 WHO – 0.3 mg /l The researched determined that the water algae, microorganisms and other water borne SWDA -0.2 mg /l treatment plant in Niagara County is not in CL Concentration (mg/l) pathogens. It sanitizes and oxidizes to keep water 0.8 EPA – 0.3 mg/l compliance when treating water with chlorine. free of bacteria. Chlorination is used in municipal Recommended Level to kill The results of both the questionnaire and water treatment plants to disinfect water 0.6 Microbials physical measurements of this study, show that particularly for Escherichia coli (E. coli) and 0.3 mg/l – 1.2 mg/l some participants are at risk of exposure to Cryptosporidium. The problem with chlorination is 0.4 Free Cl (cold chlorination. The Agricultural area had low that the chlorine by-products and the concentration water) risk factors for the usage of water and the of residual chlorine can cause alternative adverse 0.2 Urban and Industrial area had intermediate Total Cl (cold health effects such as cancer and…. As a result water) health risk factors for using the water on a federal regulations have been made to set standards 0 daily basis. The household that had the highest to minimize these risks. Sink and shower water from 1 2 3 4 5 6 7 8 9 10 11 12 13 14 15 fraction of chlorination levels was in the Number of Households a range of households in Niagara County Household industrial area and the water appeared cloudy. Figure 5 Regulation Standards For Cl was tested to determine the levels of chlorine in the WH0 – World Health Organization ; SWDA – Safe Water Drinking Act ; EPA- Environmental Temperature and pH determines the outcome water were high enough to affect public health and Protection Agency of the chlorinated water in this case there was if the municipal treatment plants are in compliance Table 1 Regulation Standards for Chlorine no correlation between temperature and pH. with the laws and regulations. EPA WHO EPA WHO SDWA Figure 1 Urban Area Figure 2 Industrial Area Figure 3 Agricultural Area Combined Cl Combined Cl Residual Cl Residual Cl Residual Cl Fraction of Free and Total Cl 100 0.5 mg/l 3mg/l 4 mg/l 0.3 mg/l 0.2 mg/l Fraction of Free and Total 90 80 70 Industrial Warm 60 Agricultural Warm Cl mg/l 50 RESULTS 40 30 Urban Warm Industrial Cold 20 Agricultural Cold 10 0 Urban Cold 0.5 mg/l is the maximum contaminant level 6.3 6.4 6.5 6.6 6.7 6.8 6.9 for the free and total chlorine allowed in pH households imposed by laws refer to table 1. Figure 8 Percent Contribution of Free & Total Cl Concentrations of chlorine in the households were in the range of 0.5 mg/l to 1.1 mg/l refer to Average Free Cl Vs. Total Cl 0.9 figure 5 . The industrial and urban households Cl Concentration ( mg/l) 0.8 0.7 had higher concentrations of both free and total 0.6 0.5 Lasalle chlorine. The pH was found to be in the neutral 0.4 Industrial Agricultural 0.3 range of 6.5. The temperature of the warm water 0.2 Urban 0.1 was approximately 89 F and the cold water was 0 Niagara River Water Treatment Plant approximately 52 F. Free Cold Total Cold Figure 4 Map of Niagara County The fraction of Free residual to Total chlorine Figure 9 Average Concentration levels METHODOLOGY ranged ( which is a percentage of the total and RECOMMENDATIONS depends on pH) between 0.2 mg/l and 0.5 mg/l for the free chlorine and 0.4 mg/l – 0.8 mg /l and The researched involved testing 15 participant To maintain clean water with lower was negatively correlated to pH refer to figure 8. households selected in the urban, industrial and chlorine levels in households, it is agricultural areas; of Niagara County refer to figure recommended to use a shower and sink filter 1-4. The study involved both a physical and social or to boil water. This removes the chlorine science aspect. Each primary member of the and other contaminants. There is also the household was asked to fill out a questionnaire in option of putting chlorine in the tap water order to determine potential exposure to chlorine in yourself with correct proportions. Contact the water. A chlorine testing kit ( figure 7) was used your local health department and a to test the free and total chlorine in the household professional can determine how much Figure 7 Chlorine Testing Kit water refer to figure 7a and 7b. Figure 6 shows how chlorine is in your water. The Environmental a disinfection agent like chlorine breaks down waste Protection Agency has a wealth of water so it can be purified once it reaches the chlorination information at www.epa.gov household. A pH meter was used to determine how 7a Chlorinated Water 7b Chlorine free Water acidic or alkaline the water was and a thermometer Figure 6 Steps for Purifying Waste Water Figure 7a & 7b Samples of free was used to measure the temperature of the water. and total Cl