East Baton Rouge Real Estate New Home Sales April 2013 vs April 2014
•
0 likes•195 views

East Baton Rouge Real Estate New Home Sales April 2013 vs April 2014 Published by Bill Cobb, Greater Baton Rouge's Home Appraiser 225-293-1500 http://www.homeappraisalsbatonrouge.com/ GREATER BATON ROUGE REAL ESTATE DATA NOTE: Based on information from Greater Baton Rouge Association of REALTORS®\MLS for period April 2013 to April 2014, extracted on 05/18/2014.

Recommended
Recommended
More Related Content
What's hot
What's hot (20)
Viewers also liked
Viewers also liked (8)
Similar to East Baton Rouge Real Estate New Home Sales April 2013 vs April 2014
Similar to East Baton Rouge Real Estate New Home Sales April 2013 vs April 2014 (20)
More from Bill Cobb, Appraiser
More from Bill Cobb, Appraiser (20)
Recently uploaded
Recently uploaded (20)
East Baton Rouge Real Estate New Home Sales April 2013 vs April 2014
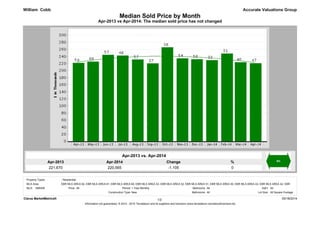
- 1. Median Sold Price by Month Apr-2013 vs Apr-2014: The median sold price has not changed Apr-2014 220,565 Apr-2013 221,670 % 0 Change -1,105 Accurate Valuations Group Apr-2013 vs. Apr-2014 William Cobb Property Types: : Residential MLS: GBRAR Bedrooms: 1 Year Monthly All SqFt: All New Bathrooms: All Lot Size: All Square Footage All Period: Construction Type: Clarus MarketMetrics® 05/18/2014 1/2 Information not guaranteed. © 2014 - 2015 Terradatum and its suppliers and licensors (www.terradatum.com/about/licensors.td). MLS Area: EBR MLS AREA 62, EBR MLS AREA 61, EBR MLS AREA 60, EBR MLS AREA 53, EBR MLS AREA 52, EBR MLS AREA 51, EBR MLS AREA 50, EBR MLS AREA 43, EBR MLS AREA 42, EBR Price:
- 2. William Cobb Accurate Valuations Group Median Sold Price by Month Apr-2013 vs Apr-2014: The median sold price has not changed Time Period Sold Median Price Units Avg DOM Apr-14 220,565 47 110 Mar-14 223,490 48 97 Feb-14 247,900 31 146 Jan-14 229,375 33 85 Dec-13 231,860 56 90 Nov-13 234,362 54 97 Oct-13 265,632 38 105 Sep-13 220,200 37 99 Aug-13 231,310 57 81 Jul-13 242,295 48 88 Jun-13 244,290 57 102 May-13 225,225 68 172 Apr-13 221,670 59 119 2/2 Clarus MarketMetrics® 05/18/2014 Information not guaranteed. © 2014 - 2015 Terradatum and its suppliers and licensors (www.terradatum.com/about/licensors.td).
- 3. Accurate Valuations Group Apr-2013 vs Apr-2014: The median price of for sale properties is up 13% and the median price of sold properties has not changed Apr-2013 vs. Apr-2014 William Cobb Apr-2014 247,900 279,900 13 Median For Sale vs Median Sold Apr-2013 Change % 32,000 Apr-2013 vs. Apr-2014 Apr-2013 Apr-2014 Change % 221,670 220,565 -1,105 0 Property Types: : Residential MLS: GBRAR Bedrooms: 1 Year Monthly All SqFt: All New Bathrooms: All Lot Size: All Square Footage All Period: Construction Type: Clarus MarketMetrics® 1/2 05/18/2014 Information not guaranteed. © 2014 - 2015 Terradatum and its suppliers and licensors (www.terradatum.com/about/licensors.td). MLS Area: EBR MLS AREA 62, EBR MLS AREA 61, EBR MLS AREA 60, EBR MLS AREA 53, EBR MLS AREA 52, EBR MLS AREA 51, EBR MLS AREA 50, EBR MLS AREA 43, EBR MLS AREA 42, EBR Price:
- 4. William Cobb Accurate Valuations Group Median For Sale vs Median Sold Apr-2013 vs Apr-2014: The median price of for sale properties is up 13% and the median price of sold properties has not changed For Sale # Properties Sold # Properties Price Difference Time Period Median For Sale Median Sold Apr-14 279,900 348 220,565 47 -59,335 Mar-14 274,100 345 223,490 48 -50,610 Feb-14 265,900 362 247,900 31 -18,000 Jan-14 243,262 368 229,375 33 -13,887 Dec-13 249,900 332 231,860 56 -18,040 Nov-13 265,550 338 234,362 54 -31,188 Oct-13 250,900 338 265,632 38 14,732 Sep-13 251,400 308 220,200 37 -31,200 Aug-13 253,400 310 231,310 57 -22,090 Jul-13 249,900 324 242,295 48 -7,605 Jun-13 246,600 342 244,290 57 -2,310 May-13 241,550 357 225,225 68 -16,325 Apr-13 247,900 370 221,670 59 -26,230 Clarus MarketMetrics® 2/2 05/18/2014 Information not guaranteed. © 2014 - 2015 Terradatum and its suppliers and licensors (www.terradatum.com/about/licensors.td).
- 5. Sold Properties by Month Apr-2013 vs Apr-2014: The number of Sold properties is down -20% Apr-2014 47 Apr-2013 59 % -20 Change -12 Accurate Valuations Group Apr-2013 vs. Apr-2014 William Cobb Property Types: : Residential MLS: GBRAR Bedrooms: 1 Year Monthly All SqFt: All New Bathrooms: All Lot Size: All Square Footage All Period: Construction Type: Clarus MarketMetrics® 1/2 05/18/2014 Information not guaranteed. © 2014 - 2015 Terradatum and its suppliers and licensors (www.terradatum.com/about/licensors.td). MLS Area: EBR MLS AREA 62, EBR MLS AREA 61, EBR MLS AREA 60, EBR MLS AREA 53, EBR MLS AREA 52, EBR MLS AREA 51, EBR MLS AREA 50, EBR MLS AREA 43, EBR MLS AREA 42, EBR Price:
- 6. William Cobb Accurate Valuations Group Sold Properties by Month Apr-2013 vs Apr-2014: The number of Sold properties is down -20% Time Period Units Median Price Avg DOM Apr-14 47 220,565 110 Mar-14 48 223,490 97 Feb-14 31 247,900 146 Jan-14 33 229,375 85 Dec-13 56 231,860 90 Nov-13 54 234,362 97 Oct-13 38 265,632 105 Sep-13 37 220,200 99 Aug-13 57 231,310 81 Jul-13 48 242,295 88 Jun-13 57 244,290 102 May-13 68 225,225 172 Apr-13 59 221,670 119 Clarus MarketMetrics® 2/2 05/18/2014 Information not guaranteed. © 2014 - 2015 Terradatum and its suppliers and licensors (www.terradatum.com/about/licensors.td).
- 7. Under Contract Properties by Month Apr-2013 vs Apr-2014: The number of Under Contract properties is down -16% Apr-2014 63 Apr-2013 75 % -16 Change -12 Accurate Valuations Group Apr-2013 vs. Apr-2014 William Cobb EBR MLS AREA 62, EBR MLS AREA 61, EBR MLS AREA 60, EBR MLS AREA 53, EBR MLS AREA 52, EBR MLS AREA 51, EBR MLS AREA 50, EBR MLS AREA 43, EBR MLS AREA 42, EBR MLS Bathrooms: All SqFt: New Property Types: Clarus MarketMetrics® 1/2 05/18/2014 Information not guaranteed. © 2014 - 2015 Terradatum and its suppliers and licensors (www.terradatum.com/about/licensors.td). : Residential GBRAR Period: 1 Year Monthly Construction Type: Lot Size: All Square Footage Price: MLS: All All All Bedrooms: MLS Area:
- 8. William Cobb Accurate Valuations Group Under Contract Properties by Month Apr-2013 vs Apr-2014: The number of Under Contract properties is down -16% Time Period Units Median Price Avg DOM Apr-14 63 237,900 133 Mar-14 60 218,770 64 Feb-14 67 223,900 102 Jan-14 56 214,200 117 Dec-13 26 218,942 87 Nov-13 44 237,170 112 Oct-13 44 225,900 120 Sep-13 39 211,700 101 Aug-13 46 242,400 93 Jul-13 43 224,900 102 Jun-13 51 247,300 91 May-13 51 227,900 92 Apr-13 75 259,900 100 Clarus MarketMetrics® 2/2 05/18/2014 Information not guaranteed. © 2014 - 2015 Terradatum and its suppliers and licensors (www.terradatum.com/about/licensors.td).
- 9. New Properties by Month Apr-2013 vs Apr-2014: The number of New properties is down -8% Apr-2014 68 Apr-2013 74 % -8 Change -6 Accurate Valuations Group Apr-2013 vs. Apr-2014 William Cobb Property Types: : Residential MLS: GBRAR Bedrooms: 1 Year Monthly All SqFt: All New Bathrooms: All Lot Size: All Square Footage All Period: Construction Type: Clarus MarketMetrics® 1/2 05/18/2014 Information not guaranteed. © 2014 - 2015 Terradatum and its suppliers and licensors (www.terradatum.com/about/licensors.td). MLS Area: EBR MLS AREA 62, EBR MLS AREA 61, EBR MLS AREA 60, EBR MLS AREA 53, EBR MLS AREA 52, EBR MLS AREA 51, EBR MLS AREA 50, EBR MLS AREA 43, EBR MLS AREA 42, EBR Price:
- 10. William Cobb Accurate Valuations Group New Properties by Month Apr-2013 vs Apr-2014: The number of New properties is down -8% Time Period Units Median Price Apr-14 68 261,200 Mar-14 58 245,400 Feb-14 60 283,450 Jan-14 79 222,042 Dec-13 44 215,592 Nov-13 54 237,670 Oct-13 78 236,900 Sep-13 57 259,900 Aug-13 59 251,900 Jul-13 61 224,900 Jun-13 47 271,446 May-13 79 225,500 Apr-13 74 286,900 Clarus MarketMetrics® 2/2 05/18/2014 Information not guaranteed. © 2014 - 2015 Terradatum and its suppliers and licensors (www.terradatum.com/about/licensors.td).
- 11. For Sale Properties by Month Apr-2013 vs Apr-2014: The number of For Sale properties is down -6% Apr-2014 348 Apr-2013 370 % -6 Change -22 Accurate Valuations Group Apr-2013 vs. Apr-2014 William Cobb Property Types: : Residential MLS: GBRAR Bedrooms: 1 Year Monthly All SqFt: All New Bathrooms: All Lot Size: All Square Footage All Period: Construction Type: Clarus MarketMetrics® 1/2 05/18/2014 Information not guaranteed. © 2014 - 2015 Terradatum and its suppliers and licensors (www.terradatum.com/about/licensors.td). MLS Area: EBR MLS AREA 62, EBR MLS AREA 61, EBR MLS AREA 60, EBR MLS AREA 53, EBR MLS AREA 52, EBR MLS AREA 51, EBR MLS AREA 50, EBR MLS AREA 43, EBR MLS AREA 42, EBR Price:
- 12. William Cobb Accurate Valuations Group For Sale Properties by Month Apr-2013 vs Apr-2014: The number of For Sale properties is down -6% Time Period Units Median Price Avg DOM Apr-14 348 279,900 223 Mar-14 345 274,100 213 Feb-14 362 265,900 202 Jan-14 368 243,262 199 Dec-13 332 249,900 221 Nov-13 338 265,550 210 Oct-13 338 250,900 209 Sep-13 308 251,400 219 Aug-13 310 253,400 215 Jul-13 324 249,900 222 Jun-13 342 246,600 218 May-13 357 241,550 205 Apr-13 370 247,900 201 Clarus MarketMetrics® 2/2 05/18/2014 Information not guaranteed. © 2014 - 2015 Terradatum and its suppliers and licensors (www.terradatum.com/about/licensors.td).
- 13. Expired Properties by Month Apr-2013 vs Apr-2014: The number of Expired properties is down -29% Apr-2014 12 Apr-2013 17 % -29 Change -5 Accurate Valuations Group Apr-2013 vs. Apr-2014 William Cobb Property Types: : Residential MLS Area: EBR MLS AREA 62, EBR MLS AREA 61, EBR MLS AREA 60, EBR MLS AREA 53, EBR MLS AREA 52, EBR MLS AREA 51, EBR MLS AREA 50, EBR MLS AREA 43, EBR MLS AREA 42, EBR MLS: GBRAR Bedrooms: 1 Year Monthly All SqFt: All New Bathrooms: All Lot Size: All Square Footage All Period: Construction Type: Price: Clarus MarketMetrics® 1/2 05/18/2014
- 14. William Cobb Accurate Valuations Group Expired Properties by Month Apr-2013 vs Apr-2014: The number of Expired properties is down -29% Units Median Price Avg DOM Apr-14 12 398,900 252 Mar-14 5 274,100 170 Feb-14 8 369,950 182 Jan-14 10 382,392 182 Dec-13 17 495,000 423 Nov-13 6 338,200 323 Oct-13 10 220,750 322 Sep-13 9 285,500 153 Aug-13 13 339,900 234 Jul-13 30 259,525 298 Jun-13 28 202,900 241 May-13 11 216,900 203 Apr-13 17 290,000 173 Clarus MarketMetrics® 2/2 05/18/2014 Information not guaranteed. © 2014 - 2015 Terradatum and its suppliers and licensors (www.terradatum.com/about/licensors.td).
- 15. Accurate Valuations Group Apr-2013 vs Apr-2014: The number of for sale properties is down -6% and the number of sold properties is down -20% Apr-2013 vs. Apr-2014 William Cobb Apr-2014 370 348 -6 Supply & Demand by Month Apr-2013 Change % -22 Apr-2013 vs. Apr-2014 Apr-2013 Apr-2014 % 59 47 -20 Change -12 Property Types: : Residential MLS: GBRAR Bedrooms: 1 Year Monthly All SqFt: All New Bathrooms: All Lot Size: All Square Footage All Period: Construction Type: Clarus MarketMetrics® 1/2 05/18/2014 Information not guaranteed. © 2014 - 2015 Terradatum and its suppliers and licensors (www.terradatum.com/about/licensors.td). MLS Area: EBR MLS AREA 62, EBR MLS AREA 61, EBR MLS AREA 60, EBR MLS AREA 53, EBR MLS AREA 52, EBR MLS AREA 51, EBR MLS AREA 50, EBR MLS AREA 43, EBR MLS AREA 42, EBR Price:
- 16. William Cobb Accurate Valuations Group Supply & Demand by Month Apr-2013 vs Apr-2014: The number of for sale properties is down -6% and the number of sold properties is down -20% # Properties # Properties Time Period For Sale Sold Apr-14 348 223 47 110 Mar-14 345 213 48 97 Feb-14 362 202 31 146 Jan-14 368 199 33 85 Dec-13 332 221 56 90 Nov-13 338 210 54 97 Oct-13 338 209 38 105 Sep-13 308 219 37 99 Aug-13 310 215 57 81 Jul-13 324 222 48 88 Jun-13 342 218 57 102 May-13 357 205 68 172 Apr-13 370 201 59 119 Avg DOM Avg DOM Clarus MarketMetrics® 2/2 05/18/2014 Information not guaranteed. © 2014 - 2015 Terradatum and its suppliers and licensors (www.terradatum.com/about/licensors.td).
- 17. The Average Days on Market by Month Apr-2013 vs Apr-2014: The average days on market is up 33% Apr-2014 133 Apr-2013 100 % 33 Change 33 Accurate Valuations Group Apr-2013 vs. Apr-2014 William Cobb Property Types: : Residential EBR MLS AREA 62, EBR MLS AREA 61, EBR MLS AREA 60, EBR MLS AREA 53, EBR MLS AREA 52, EBR MLS AREA 51, EBR MLS AREA 50, EBR MLS AREA 43, EBR MLS AREA 42, EBR All 1 Year Monthly MLS Area: Price: Period: Bedrooms: All SqFt: All All Square Footage Construction Type: New Bathrooms: All Lot Size: MLS: GBRAR Clarus MarketMetrics® 1/2 05/18/2014
- 18. William Cobb Accurate Valuations Group The Average Days on Market by Month Apr-2013 vs Apr-2014: The average days on market is up 33% Time Period Avg DOM # UC Units Apr-14 133 63 Mar-14 64 60 Feb-14 102 67 Jan-14 117 56 Dec-13 87 26 Nov-13 112 44 Oct-13 120 44 Sep-13 101 39 Aug-13 93 46 Jul-13 102 43 Jun-13 91 51 May-13 92 51 Apr-13 100 75 Clarus MarketMetrics® 2/2 05/18/2014 Information not guaranteed. © 2014 - 2015 Terradatum and its suppliers and licensors (www.terradatum.com/about/licensors.td).
- 19. Apr-2013 vs Apr-2014: The average months supply of inventory is up 17% Accurate Valuations Group Apr-2013 vs. Apr-2014 Apr-2014 3.7 17 William Cobb 4.3 Months Supply of Inventory Apr-2013 Change % 0.6 Property Types: : Residential MLS: GBRAR Bedrooms: 1 Year Monthly All SqFt: All New Bathrooms: All Lot Size: All Square Footage All Period: Construction Type: Clarus MarketMetrics® 05/18/2014 1/2 Information not guaranteed. © 2014 - 2015 Terradatum and its suppliers and licensors (www.terradatum.com/about/licensors.td). MLS Area: EBR MLS AREA 62, EBR MLS AREA 61, EBR MLS AREA 60, EBR MLS AREA 53, EBR MLS AREA 52, EBR MLS AREA 51, EBR MLS AREA 50, EBR MLS AREA 43, EBR MLS AREA 42, EBR Price:
- 20. William Cobb Accurate Valuations Group Months Supply of Inventory Apr-2013 vs Apr-2014: The average months supply of inventory is up 17% # Units For Sale # UC Units Last Day of Month During Month MSI Time Period UC Avg DOM Apr-14 273 63 4.3 133 Mar-14 280 60 4.7 64 Feb-14 287 67 4.3 102 Jan-14 302 56 5.4 117 Dec-13 289 26 11.1 87 Nov-13 288 44 6.5 112 Oct-13 284 44 6.5 120 Sep-13 260 39 6.7 101 Aug-13 251 46 5.5 93 Jul-13 251 43 5.8 102 Jun-13 263 51 5.2 91 May-13 295 51 5.8 92 Apr-13 278 75 3.7 100 Clarus MarketMetrics® 05/18/2014 2/2 Information not guaranteed. © 2014 - 2015 Terradatum and its suppliers and licensors (www.terradatum.com/about/licensors.td).