

Recommended
Recommended
More Related Content
What's hot
What's hot (20)
Similar to Ch 14 financial management notes
Similar to Ch 14 financial management notes (20)
More from Babasab Patil
More from Babasab Patil (20)
Recently uploaded
Recently uploaded (20)
Ch 14 financial management notes
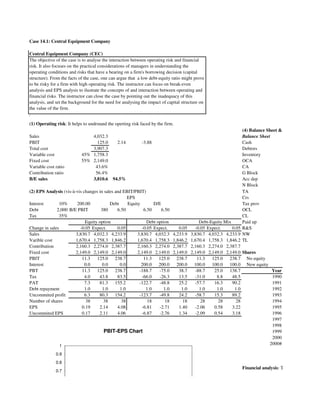
- 1. Case 14.1: Central Equipment Company Central Equipment Company (CEC) The objective of the case is to analyse the interaction between operating risk and financial risk. It also focuses on the practical considerations of managers in understanding the operating conditions and risks that have a bearing on a firm's borrowing decision (capital structure). From the facts of the case, one can argue that a low debt-equity ratio might prove to be risky for a firm with high operating risk. The instructor can focus on break-even analysis and EPS analysis to ilustrate the concepts of and interaction between operating and financial risks. The instructor can close the case by pointing out the inadequacy of this analysis, and set the background for the need for analysing the impact of capital structure on the value of the firm. ` (1) Operating risk: It helps to undrstand the operting risk faced by the firm. (4) Balance Sheet & P&L Analysis: His Sales 4,032.3 Balance Sheet PBIT 125.0 2.14 -3.88 Cash Total cost 3,907.3 Debtors Variable cost 45% 1,758.3 Inventory Fixed cost 55% 2,149.0 OCA Variable cost ratio 43.6% CA Contribution ratio 56.4% G Block B/E sales 3,810.6 94.5% Acc dep N Block (2) EPS Analysis (vis-à-vis changes in sales and EBIT/PBIT) TA EPS Crs Interest 10% 200.00 Debt Equity D/E Tax prov Debt 2,000 B/E PBIT 380 6.50 6.50 6.50 OCL Tax 35% CL Equity option Debt option Debt-Equity Mix Paid up Change in sales -0.05 Expect. 0.05 -0.05 Expect. 0.05 -0.05 Expect. 0.05 R&S Sales 3,830.7 4,032.3 4,233.9 3,830.7 4,032.3 4,233.9 3,830.7 4,032.3 4,233.9 NW Varible cost 1,670.4 1,758.3 1,846.2 1,670.4 1,758.3 1,846.2 1,670.4 1,758.3 1,846.2 TL Contribution 2,160.3 2,274.0 2,387.7 2,160.3 2,274.0 2,387.7 2,160.3 2,274.0 2,387.7 Fixed cost 2,149.0 2,149.0 2,149.0 2,149.0 2,149.0 2,149.0 2,149.0 2,149.0 2,149.0 Shares PBIT 11.3 125.0 238.7 11.3 125.0 238.7 11.3 125.0 238.7 No equity Interest 0.0 0.0 0.0 200.0 200.0 200.0 100.0 100.0 100.0 New equity PBT 11.3 125.0 238.7 -188.7 -75.0 38.7 -88.7 25.0 138.7 Year Tax 4.0 43.8 83.5 -66.0 -26.3 13.5 -31.0 8.8 48.5 1990 PAT 7.3 81.3 155.2 -122.7 -48.8 25.2 -57.7 16.3 90.2 1991 Debt repayment 1.0 1.0 1.0 1.0 1.0 1.0 1.0 1.0 1.0 1992 Uncommited profit 6.3 80.3 154.2 -123.7 -49.8 24.2 -58.7 15.3 89.2 1993 Number of shares 38 38 38 18 18 18 28 28 28 1994 EPS 0.19 2.14 4.08 -6.81 -2.71 1.40 -2.06 0.58 3.22 1995 Uncommited EPS 0.17 2.11 4.06 -6.87 -2.76 1.34 -2.09 0.54 3.18 1996 1997 1998 PBIT-EPS Chart 1999 2000 1 2000# 0.9 0.8 Financial analysis: Th 0.7
- 2. 0.7 great varibility as well 0.6 B/E PBIT and 17.5% in 1997.Ma EPS If the company realise 0.5 dependence on external funds. The firm is 0.4 532 0.3 0.2 0.1 0 0 0 0 0 0 0 0 0 0 0 0 0 0 PBIT 1 2 (3) Operating & Financial Leverage Analysis 3 Break-even sales 3,810.6 94.5% 4 Change in sales -0.05 0.05 -0.05 0.05 5 Change in PBIT -0.91 0.91 -0.91 0.91 6 DOL 18.19 18.19 18.19 18.19 18.19 7 Change in EPS -0.91 0.91 1.52 -1.52 8 DFL 1.00 1.00 -1.67 -1.67 -1.67 9 DCL 18.19 18.19 -30.32 -30.32 -30.32 10 11
- 3. alance Sheet & P&L Analysis: Historical Perspective (E + D) E 8% 89.0 Estd. Projected Projected 16% 180.7 Sales 3,376.9 4,032.3 4,032.3 4% 41.1 PBIT 94.6 125.0 125.0 4% 47.1 PAT 50.3 -101 81.3 31% 357.9 (E + D) E 71% 819.9 Estd. Projected Projected 2% 23.5 S/TA 4.07 4.86 4.86 69% 796.4 PBIT/S 0.03 0.03 0.03 100% 1,154.3 PBIT/TA 11.4% 15.1% 15.1% 2% 15.2 PAT/PBIT 0.53 -0.81 0.65 4% 30.3 TA/NW 1.54 4.67 1.13 15% 121.5 PAT/NW 9.3% -56.7% 11.1% 21% 167.0 22% 180.0 57% 459.6 79% 639.6 640 2,640 100% 807 18.00 38.00 Sales PBIT PAT DIV EPS Sales g PBIT/S PBIT EPS EPS 1,804.0 34.3 17.1 9.0 0.95 1.9% -140 -2.39 -12.28 1,707.8 15.5 7.8 9.0 0.43 -5.3% 0.9% 0 0.00 -7.22 1,894.0 41.2 20.6 9.0 1.14 10.9% 2.2% 140 2.39 -2.17 2,270.8 52.2 26.1 9.0 1.45 19.9% 2.3% 280 4.79 2.89 2,520.0 58.0 29.0 10.8 1.61 11.0% 2.3% 420 7.18 7.94 2,775.0 66.6 33.3 10.8 1.85 10.1% 2.4% 560 9.58 13.00 2,949.2 76.8 38.4 14.4 2.13 6.3% 2.6% 700 11.97 18.06 2,433.8 -5.3 -5.3 9.0 -0.29 -17.5% -0.2% 840 14.37 23.11 3,042.3 82.1 43.5 18.0 2.42 25.0% 2.7% 980 16.76 28.17 3,376.9 94.6 50.3 18.0 2.79 11.0% 2.8% 1,120 19.16 33.22 3,579.5 85.0 55.2 18.0 3.07 6.0% 2.4% 1,260 21.55 38.28 4,032.3 125.0 81.3 38.0 2.14 12.6% 3.1% 1,400 23.95 43.33 AVG 7.5% 1.9% 1,540 26.34 48.39 SD 12.7% 1.0% : The company sales have grown at an average rate of 7.5%. But its shows
- 4. varibility as well. Twice during last decade sales growth was negative, a drop of 5.7% in 1991 7.5% in 1997.Margin has hovered around 2%. The company has high level of current assets. company realises its debtorand uses surplus cash balance, it can perhaps reduce its dence on external funds. The firm is very conservatively financed. S ATM Dep*.35 4,335 -97 699 245 147 100 47 4,660 -91 524 184 92 100 -8 5,009 -84 393 138 53 100 -47 5,385 -77 295 103 26 100 -74 5,789 -69 221 77 8 100 -92 6,223 -61 166 58 -3 100 -103 6,690 -52 124 44 -8 100 -108 7,192 -42 93 33 -9 1,300 -1,309 7,731 -31 70 24 -7 8,311 -20 52 18 -2 8,934 -8 39 14 6