
Recommended
Recommended
More Related Content
What's hot
What's hot (20)
Similar to Financials_FFH.TO_Hold_03_02_2015-3 (FInal Version)
Similar to Financials_FFH.TO_Hold_03_02_2015-3 (FInal Version) (20)
Financials_FFH.TO_Hold_03_02_2015-3 (FInal Version)
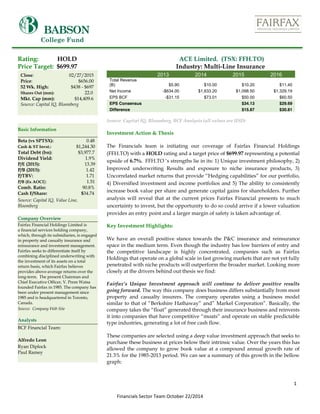
- 1. BABSON College Fund 1 Financials Sector Team October 22/2014 Rating: HOLD ACE Limited. (TSX: FFH.TO) Price Target: $699.97 Industry: Multi-Line Insurance Close: 02/27/2015 Price: $656.00 52 Wk. High: $438 - $697 Shares Out (mm): 22.0 Mkt. Cap (mm): $14,409.6 Source: Capital IQ, Bloomberg 2013 2014 2015 2016 Total Revenue (B) $5.90 $10.00 $10.20 $11.40 Net Income -$634.00 $1,633.20 $1,098.50 $1,329.19 EPS BCF -$31.15 $73.01 $50.00 $60.50 EPS Consensus $34.13 $29.69 Difference $15.87 $30.81 Source: Capital IQ, Bloomberg, BCF Analysis (all values are USD) Investment Action & Thesis The Financials team is initiating our coverage of Fairfax Financial Holdings (FFH.TO) with a HOLD rating and a target price of $699.97 representing a potential upside of 6.7%. FFH.TO ’s strengths lie in its: 1) Unique investment philosophy, 2) Improved underwriting Results and exposure to niche insurance products, 3) Uncorrelated market returns that provide “Hedging capabilities” for our portfolio, 4) Diversified investment and income portfolios and 5) The ability to consistently increase book value per share and generate capital gains for shareholders. Further analysis will reveal that at the current prices Fairfax Financial presents to much uncertainty to invest, but the opportunity to do so could arrive if a lower valuation provides an entry point and a larger margin of safety is taken advantage of. Key Investment Highlights: We have an overall positive stance towards the P&C insurance and reinsurance space in the medium term. Even though the industry has low barriers of entry and the competitive landscape is highly concentrated, companies such as Fairfax Holdings that operate on a global scale in fast growing markets that are not yet fully penetrated with niche products will outperform the broader market. Looking more closely at the drivers behind out thesis we find: Fairfax’s Unique Investment approach will continue to deliver positive results going forward. The way this company does business differs substantially from most property and casualty insurers. The company operates using a business model similar to that of “Berkshire Hathaway” and” Markel Corporation”. Basically, the company takes the “float” generated through their insurance business and reinvests it into companies that have competitive “moats” and operate on stable predictable type industries, generating a lot of free cash flow. These companies are selected using a deep value investment approach that seeks to purchase these business at prices below their intrinsic value. Over the years this has allowed the company to grow book value at a compound annual growth rate of 21.3% for the 1985-2013 period. We can see a summary of this growth in the bellow graph: Basic Information Beta (vs SPTSX): 0.48 Cash & ST Invst.: $1,244.30 Total Debt (bn): $3,977.7 Dividend Yield: 1.9% P/E (2015): 13.39 P/B (2015): 1.42 P/TBV: 1.71 P/B (Ex AOCI): 1.51 Comb. Ratio: 90.8% Cash F/Share: $34.74 Source: Capital IQ, Value Line, Bloomberg Company Overview Fairfax Financial Holdings Limited is a financial services holding company, which, through its subsidiaries, is engaged in property and casualty insurance and reinsurance and investment management. Fairfax seeks to differentiate itself by combining disciplined underwriting with the investment of its assets on a total return basis, which Fairfax believes provides above-average returns over the long-term. The present Chairman and Chief Executive Officer, V. Prem Watsa founded Fairfax in 1985. The company has been under present management since 1985 and is headquartered in Toronto, Canada. Source: Company Web Site Analysts BCF Financial Team: Alfredo Leon Ryan Diplock Paul Ramey
- 2. BABSON College Fund 2 Financials Sector Team October 22/2014 Improved Underwriting Results, due to penetration of untapped markets with niche- like products. The company’s growth in the insurance space has been mainly inorganic growth through acquisitions. The company was early entering the Asian market with Fairfax Asia celebrating its 10 year anniversary in 2012. Fairfax Asia generates about $1 B in gross premiums written. Furthermore, the company is also present in India given the company’s stake (26% interest) in ICICI Lombardi the non-life Indian Insurer that generates $1.2 B in gross premiums. The company is also exposed to China trough Alltrust (15% interest). Over the past couple of years the company has been able to leverage their insurance expertise to the newly acquired companies as evidenced in the improved combined ratio of the companies post-acquisition. Source: CEO Letter to Shareholders 2013 Furthermore, Fairfax is increasing their exposure to new insurance “niche type products” that are less “commodity type” and have room for improved pricing. In 2013 for example, Fair Fax Financial acquired Hartville (pet insurer) for $34 million from a private equity firm. Hartville generates about $40 million of insurance business averaging a combined ratio of 85% for the last 7 years. In the environmental liability field the company also acquired American Safety becoming the market leader in this segment. These type of products proof more profitable because of improved pricing and reduced market penetration. In terms of ability to write premiums, the company also has plenty of dry powder left. Under “bad” market conditions in the insurance space (2002-2005) the company wrote on average 1.5 times statutory surplus. The bellow table shows that at current levels the weighted average is around .9x. If we compare this to (2002-2005) period this means there is additional capacity to write premiums of about $2.7B in a better market. All of these factors combined have allowed for the company to substantially improve their insurance business operation as witnessed by the declining combined ratio. For year end 2014 Fairfax Financial Holding further improved the combined ratio to reach 90.8%. Source: CEO Letter to Shareholders 2013, Company Reports.
- 3. BABSON College Fund 3 Financials Sector Team October 22/2014 Uncorrelated Market Returns, that offer hedging capabilities for the BCF Portfolio. As pointed out by the quant team during the last session the financial sector team is the sector with the highest beta against the S&P 500 with beta of 1.68. This stock offers the opportunity to generate returns that are not correlated with the market. An indicator of this is the stock’s low beta of 0.48. We believe the reason for this might be two-fold. On one hand, the company invest the float generated through the insurance in businesses suitable to a deep value strategy. That is, trying to find companies trading for less than their intrinsic value with a long term investment horizon and offer substantial free cash flow. This is counterintuitive to most companies in Wall Street that focus a lot more on earnings and hence this fact, chase yield. On the other hand at the end in 2014 equities made 19.3% of the investment portfolio of the company, while cash bonds and other low risk financial products 67.7%, as summarized by the bellow pie chart. For year end 2014 the book value of the investment portfolio was standing at $25,109 million. However, Fairfax holds short positions totaling $6,857 million in the S&P 500/TSX 60 and Russell 2000 indexes. This means that the company’s net position is long by $18,252 million. This has to do with the fact that the company’s CEO Mr Watsa, has a bearish stance to the overall markets and feels that they are overvalued at current levels. It is of interest to remember that Mr. Watsa has hold similar short positions ($4.2 Billion) in the past and is most famous for obtaining profits north of $3.3 B when the market crashed back in 2008. He also successfully called the crash of 1987 and the Japanese decline in 1990. Further proof of his Source: Company Reports. investment conviction is that he hold the short position for 5 years before it finally paid off. Also, the investment portfolio is highly concentrated on a reduced number of holdings. This is evident if we look at the bellow pie chart. In conclusion we believe that the combination of these factors provides some explanation as to why the returns are uncorrelated. We see this as a positive for both the stock and the financial sector portion of the BCF portfolio. Source: Company Reports. % of Holdings
- 4. BABSON College Fund 4 Financials Sector Team October 22/2014 Diversified Investments and Income Portfolio. Fairfax diversification ads significant value in terms of the quality of the earnings the company. Being present over a broad set of markets and different type of well-run businesses spreads the risk over a broader sets of assets and will eventually (as long term investments mature) reduce the cyclicality in terms of the cash flows that run to the holding company and ultimately EPS. From a geographical perspective, the company is well diversified with about 80% of the revenues being international. United Sates represents (56%) while Asia and India compromise (24%). The remainder of revenues are derived from Canadian local operations. In terms of revenue streams the company derives about 62% of revenues from their insurance business operations and 38% from the investment portfolio and share of profit form associates. As the two bellow graphs show sources of revenue are well diversified. This mitigates the risk over a broader set of asset classes and markets; providing additional support for the liquidity commitments of the insurance business. . . Source: Capital IQ, Bloomberg. Investment Risks: Risk of Natural Catastrophes: Fairfax Financial Holding’s business model relies on their ability to make underwriting profits; this ability is threatened if large Natural Catastrophes were to occur more frequently or on a larger scale than anticipated. Liquidity Risk: Liquidity is an important factor for any a P/C insurer, because of the insurer’s need to pay claims promptly. Companies that fail to set aside enough cash to face commitments face liquidity issues. In the case of Fairfax Financial, the company faces less risk than most property and casualty insurers because they have been modest in their underwriting practices by only leveraging up to around .9x statutory surplus. Also, they are increasing exposure to niche products and concentrating efforts on low penetrated markets. Pricing and Competitive Landscape: Theoretically, insurance prices should move in the opposite direction of interest rates, given the fact that higher interest rates translates in to higher investment yields on Bond Portfolios (which are a large portion of the earning assets of insurance companies). However, during a period of historically low interest rates, insurance pricing remained competitive. We do not expect this to change on the near future, and in the long run companies who restrain from overexposing themselves to risk will outperform. 0% 20% 40% 60% 80% 100% 120% Revenues by Source Portfolio of Investments and Share of Profit from Associates Insurance Business Revenues by Geography United States Asia and India Canada
- 5. BABSON College Fund 5 Financials Sector Team October 22/2014 General Market Risks: As with any other stock Fairfax Financial Holdings faces investment risks associated with market movements. Moreover, as explained above, because of the investment philosophy of the company 40% of revenues come from assets that are not very correlated to general market conditions. This means that in a down market companies like Fairfax Financial will tend to outperform while companies that have higher betas will underperform. This year, the opposite story might be true given the general positive climate that rains in the U S economy today with unemployment, consumer spending, consumer credit quality and GDP rates at healthy levels. If this were to propel a rally on the markets Fairfax Financial will miss that upside given the company is heavily hedging against a market drop in in the S&P 500/TSX 60 and Russell 2000 indexes. Currency Exchange Risk. With about 80% of revenues coming from International Operations. Fairfax Financial faces potential negative effects derived from currency exchange risks. However, 56% of that 80% comes from the United States so the current trend of the strengthen dollar should not significantly impact the company. If anything the US dollar has been appreciating against the Canadian dollar around 15% in the last 12 months. Despite this, the Fairfax Financial Holdings exposure to the Asian and Indian Markets still merits caution given that the remaining 24% of revenues comes from this geography’s. Geopolitical Risk. The company is exposed to important sources of geopolitical risk for being present in markets such as Asia and India. Moreover, given the investment philosophy of the company many of these investments are long term and are affected by major political and regulatory changes in government. Nonetheless, during the last conference call celebrated February 13th. The CEO, Mr Watsa pointed out that India’s current Prime Minister Mr. Modi has a friendly track record with international businesses and has positive stands toward International capital Inflows. Management suggests that there is a strong possibility that he could get reelected if he fulfills his duties well as prime minister. This is very favorable for Fairfax Financial Holdings as the company recently set up and investment vehicle that manages close to $1B to allocate capital in India over long term investments. Business Overview: Fairfax Financial Holdings Ltd. (“Fairfax”) was incorporated under the Canada Corporations Act on March 13, 1951 and continued under the Canada Business Corporations Act in 1976. Fairfax's original name was Markel Service of Canada Ltd., The name was subsequently changed to Markel Financial Holdings Ltd. and, in May 1987, to their current name of Fairfax Financial Holdings Ltd. The company through its subsidiaries, is engaged in property and casualty insurance and reinsurance and investment management businesses. The company operates under the following business segments: Canadian. Insurance Northbridge Financial, based in Toronto, provides property and casualty insurance products in the Canadian market through its Northbridge Insurance and Federated subsidiaries. In 2013, Northbridge’s net premiums written were Cdn $1,062.1 million. At year-end, the company had statutory equity of Cdn $1,245.5 million and there were 1,491 employees. U.S. Insurance. Crum & Forster (C&F), based in Morristown, New Jersey, is a national commercial property and casualty insurance company in the United States writing a broad range of commercial coverages. Its subsidiary Seneca Insurance provides property and casualty insurance to small businesses and certain specialty coverages. C&F’s other specialty niche property and casualty business and its accident and health insurance business are carried on through its Fairmont Specialty division. In February 2011, C&F acquired First Mercury, which offers insurance products and services primarily related to specialty commercial insurance markets, focusing on niche and underserved segments. In 2013, C&F’s net premiums written were US $1,232.9 million. At year-end, the company had statutory surplus of US$1,141.5 million and there were 1,695 employees. Zenith National, based in Woodland Hills, California, is primarily engaged in the workers’ compensation insurance
- 6. BABSON College Fund 6 Financials Sector Team October 22/2014 business in the United States. In 2013, Zenith National’s net premiums written were US $700.3 million. At year-end, the company had statutory surplus of US $515.8 million and there were 1,480 employees. Asian Insurance. First Capital, based in Singapore, writes property and casualty insurance primarily in Singapore markets. In 2013, First Capital’s net premiums written were SGD 186.3 million (approximately SGD 1.3 = US$1). At year-end, the company had shareholders’ equity of SGD 459.7 million and there were 140 employees. Falcon Insurance, based in Hong Kong, writes property and casualty insurance in niche markets in Hong Kong. In 2013, Falcon’s net premiums written were HK $466.9 million (approximately HK$7.8 = US$1). At year-end, the company had shareholders’ equity of HK $566.6 million and there were 66 employees. Pacific Insurance, based in Malaysia, writes all classes of general insurance and medical insurance in Malaysia. In 2013, Pacific Insurance’s net premiums written were MYR 151.9 million (approximately MYR 3.1 = US$1). At year-end, the company had shareholders’ equity of MYR 256.1 million and there were 207 employees. Other insurance. Fairfax Brazil, based in Sao Paulo, commenced writing insurance in March 2010 in all lines of business in Brazil. In 2013, Fairfax Brazil’s net premiums written were BRL 130.8 million (approximately BRL 2.1 = US$1). At year-end, the company had shareholders’ equity of BRL 78.5 million and there were 71 employees. Reinsurance. OdysseyRe, based in Stamford, Connecticut, underwrites treaty and facultative reinsurance as well as specialty insurance, with principal locations in the United States, Toronto, London, Paris, Singapore and Latin America. In 2013, OdysseyRe’s net premiums written were US $2,376.9 million. At year-end, the company had shareholders’ equity of US $3,809.3 million and there were 790 employees. Advent, based in the U.K., is a reinsurance and insurance company, operating through Syndicate 780 at Lloyd’s, focused on specialty property reinsurance and insurance risks. In 2013, Advent’s net premiums written were US $157.0 million. At year- end, the company had shareholders’ equity of US $148.4 million and there were 81 employees. Polish Re, based in Warsaw, Poland, writes reinsurance in the Central and Eastern European regions. In 2013, Polish Re’s net premiums written were PLN 265.8 million (approximately PLN 3.2 = US$1). At year-end, the company had shareholders’ equity of PLN 264.7 million and there were 42 employees. Group Re primarily constitutes the participation by CRC Re and Wentworth (both based in Barbados) in the reinsurance of Fairfax’s subsidiaries by quota share or through participation in those subsidiaries’ third party reinsurance programs on the same terms and pricing as the third party reinsurers. Group Re also writes third party business. In 2013, Group Re’s net premiums written were US $105.0 million. At year-end, the Group Re companies had combined shareholders’ equity of US $467.7 million. Brit, on February 16th 2015 Fiarfax Financial Holdings announced the agreement to purchase Brit. Brit PLC, through its subsidiaries, provides insurance and reinsurance services focusing on property, casualty, and energy sectors worldwide. Its principal products include property, marine, energy, accident and health, specialty, terrorism, political, aerospace, casualty and specialist liability, and property and casualty treaty insurance. The company wrote around $1.5 billion (about 25% of the premiums currently written By Fair Fax in 2014) in premiums in 2014 and has around 400 employees. Runoff The runoff business comprises the U.S. and the European runoff groups. At year-end, the runoff group had combined shareholders’ equity of US$ 1,597.8 million.
- 7. BABSON College Fund 7 Financials Sector Team October 22/2014 The Resolution Group (TRG) and the River Stone Group (run by TRG management) manage runoff under the River Stone name. At year-end, TRG/River Stone had 222 employees in the U.S., located primarily in Manchester, New Hampshire, and 110 employees in its offices in the United Kingdom. Other Hamblin Watsa Investment Counsel, founded in 1984 and based in Toronto, provides investment management to the insurance, reinsurance and runoff subsidiaries of Fairfax. The bellow graph, will help to better understand the broad set of sectors/asset classes that Fairfax uses to invest the float generated through the insurance business. Source: Capital IQ One fact that is of interest to note is the timing of these investments. Which we believe reflect the companies approach to deep-value investing and emphasis on growing book value on a per share bases. As the bellow graph shows over the last a 17 year period the company invested more heavily in times of financial distress (2008-2009), reflecting the opportunity to purchase assets trading below their intrinsic value. Source: Capital IQ The fact that the company is investing heavily in Europe with the acquisition of (Brit U.K insurer, and QBE Ukrainian
- 8. BABSON College Fund 8 Financials Sector Team October 22/2014 Insurance Company) provides additional support to our thesis, and explains why the company sits with a significant cash (approximately $1.2 B) on the balance sheet to deploy capital when opportunity exists. Industry Analysis: Because most of the operating cash flows come from Fairfax’s Financial P & C Reinsurance operations we decided to focus our analysis on the external factors that impact this space and shape the competitive landscape. Industry at a Glance/Drivers: Source: IBIS World Industry at a Glance. The Global Reinsurance Carriers industry provides support to direct insurance markets all over the world. Reinsurers assume part or all of the liability for one or more insurance policy and compensate insurers within contracted parameters for prescribed losses incurred under that insurance policy. This transfers part or all of the risk to reinsurers, helping insurers to increase their capacity and limit their liability. The global reinsurance market then spreads this risk across more companies and countries, thereby maximizing the spread of risk and protection against unforeseen losses. This improves the capital efficiency of the overall insurance market so that less capital is required to back any unit of risk. Reinsurance carriers generate revenue not just from reinsurance transactions but also through investing their earned premiums. Revenues and Trends. In terms of revenues, the industry is forecasted to experience modest gains of around 4%-5% until 2020. These forecast take into account the following trends: Expansion Projects, the industry as a whole is experiencing a broad consolidation trend where the superior capital position of some reinsurers places them in perfect position to acquire weaker rivals at bargain prices. This will limit the growth in terms of number of operators in the future.
- 9. BABSON College Fund 9 Financials Sector Team October 22/2014 P & C Outlook, here the state of the economy will shape the global demand for Reinsurers. This is because growth in demand for insurance products is tightly related to new purchases of big ticket items such as: houses, housing renovations, automobiles, boats, appliances; that are tied to the public’s ability to purchase and finance such items. This is why an expanding economy would benefit reinsurers at least form a demand perspective. L&H optimism, Demand for life insurance and annuities has been hit as stretched consumers reigned in their overall expenditure. This has occurred despite some market segments experiencing a life insurance renaissance as wealthier consumers shift from wealth accumulation to wealth protection. Interest in life insurance and annuities is expected to surge as consumers who were burnt by the financial turmoil seek out safer wealth management options. Many consumers in the post crisis world, however, will be unable to devote the same level of resources to life insurance and annuities. This will be particularly the case for people nearing retirement. With dwarfed pension plans, those nearing retirement will have fewer dollars to transfer into an annuity. Source: IBIS World Industry Life Cycle. The insurance space is considered to be a mature. Given the following: The industry “value added” is growing at a slower rate than GDP, the industry is ongoing a consolidation trend, and the industry has become saturated by insurance products in the most developed economies. Breakdown of Product and Geography. Product Type. Premiums by Region Source: IBIS World
- 10. BABSON College Fund 10 Financials Sector Team October 22/2014 Cost Structure. If we take a look at the cost structure we see that the biggest components of cost is the “other” category. This segment includes loss and loss adjustment expenses, commission and brokerage costs, administrative costs, legal costs and other operating costs associated with investment income. Source: IBIS World Key Success Factors. IBIS World identifies 250 Key Success Factors for a business. The most important for this industry are: Possession of accurate information: A large database of risk-related information enables reinsurers to price policies accurately and calculate requisite surplus levels. Without accurate information, models defining the price of risk become fundamentally flawed. Market research and understanding: A strong understanding of the market enables reinsurers to challenge competitors without engaging in unsustainable activities, such as dangerous diversification into other reinsurance lines or overly aggressive price-cutting. Having a good technical knowledge of the product: Reinsurance carriers compete with numerous international companies and service providers, and it is vital to have good knowledge and experience in the types of business underwritten. Must comply with government regulations: Reinsurers must meet specific capital requirements. Failing to do so can see the reinsurer's operating license revoked. Ability to effectively manage risk: Reinsurers must seek to limit their exposure to loss on any single agreement through a diversified risk profile, including lines of business, geographic spread of business and the spread of retrocession arrangements. Management: FFH.TO’s management team is well known for their conservative steady growth approach and diligent focus towards strong underwriting premium discipline and investment philosophy. Most of the management team has been together for quite a while the average tenure of the operating team being about 7 years. Key leaders in FFH.TO’s team include: Prem Watsa, has been the Chairman of the Board of Directors and Chief Executive Officer since 1985. He has served as Vice President of Hamblin Watsa Investment Counsel Ltd. since 1985. Mr.Watsa is known to some as the “Warren Buffet of Canada” do to his deep value investment strategy as well as Fair Fax Financial Holding’s resemblance to the operating model Industry Table Summary Trend Competition High and Increasing Barriers of Entry Medium and steady Industry Globalization High and Increasing Capital Intensity Medium Technology & Systems Medium Revenue Volatility Low Regulation and Policy Heavy and increasing
- 11. BABSON College Fund 11 Financials Sector Team October 22/2014 of Berkshire Hathaway. Watsa, successfully predicted, and profited from the 2008 stock market crash. He also correctly called the 1990 Japanese stock market crash and the market crash of 1987. Mr. Paul C. Rivett, has been the President of Fairfax Financial Holdings Limited since July 19, 2013. Mr. Rivett also serves as the Chief Operating Officer at Hamblin Watsa Investment Counsel Ltd. Moreover, Mr. Rivett served as a Vice President of Operations at Fairfax Financial Holdings Ltd. since August 1, 2012 until July 19, 2013, Chief Legal Officer since January 2007 and Vice President since April 2004. David J. Bonham, is Chief Financial Officer & Vice President at Fairfax Financial Holdings Ltd. and Chief Investment Officer at Hamblin Watsa Investment Counsel Ltd. Prior to joining Hamblin Watsa Investment Counsel, Mr. Bonham was employed as a Senior Manager by PricewaterhouseCoopers LLP. We feel confident on the management’s ability to continue to provide positive result for the company by combining underwriting discipline and deep value. Furthermore the team has an excellent track record and a sound company culture based on firm guiding principles. For more information on values and objectives visit: http://www.fairfax.ca/Corporate/guiding-principles/default.aspx Shareholder Structure: Institutions and insiders own about 60% of the shares of FFH.TO’S. Also worth noting, is that the CEO Mr. Watsa is the largest single holder of shares with about 9% of the total shares outstanding. Such large insider ownership is a positive for the stock because it provides reassurance to some extent that management interests are aligned with those of shareholders. Source: Capital IQ Stock Performance: Given the company’s investment philosophy FFH.TO’s stock price displays little correlation (see graph) with both the S&P 500 and the S&P/TSX Composite Index. This is even more noticeable if you consider the low beta the stock (0.48). Furthermore, during this period the stock has outperform the S&P/TSX composite index and underperformed slightly the S&P 500 index with a return of 79.80% versus 30.39% and 91.53% respectively.
- 12. BABSON College Fund 12 Financials Sector Team October 22/2014 Source: Bloomberg Consensus Recommendations: This stock is not highly covered by analysts. That being said, out of the 5 analyst that do cover it 3 of them have “BUY” ratings on it while the reminder of the recommendations appear “restricted” on Bloomberg. The ratings imply an average 12 month return potential of 12.2% and a price target of $729.93. In addition to using Bloomberg for analyst consensus, we contacted two equity analysts to discuss our thesis on the stock. Tom Mackinnon of BMO Capital Markets and Neil Fonseca of EVA Dimensions. While Neil was unable to comment a lot on the performance of the stock as he admitted not to cover it in depth, Tom provided us with the following insights regarding the stock’s performance going forward: Stock Rating. Market Perform. Tom feels that although the stock has an excellent track record at being able to grow book value per share over the last 30 years, form a Valuation Perspective the company is trading slightly higher to where it usually trades. According to the analyst from a price to book perspective the stock is trading now at a 15% premium.
- 13. BABSON College Fund 13 Financials Sector Team October 22/2014 Valuation. Regarding valuation, Tom prefers to use relevant multiples of comparable peers for Fair Fax Financial Holding (mainly P/B, P/TB). This is due to the volatility of EPS the company has had in the past. He restrains form forecasting cash flows given that a substantial amount of revenues (40%) that come in the from of investment gains on portfolios that are hard to model, and assets (equity stakes on partnerships) that have a long term investment horizons and are somewhat less predictable. Competitive Landscape. Regarding competition, Tom expressed that space is getting very competitive and a lot of new players are entering the market. The relatively low amount of catastrophes for P & C insurers has caused a general increase in the number of players. In addition these new players operate under a different structure compared to the conventional insurer. Consider for example, the reinsurance market where a lot of hedge funds have entered recently and started underwriting. By taking advantage of their lower tax rate and overhead, they can invest more aggressively the float and in turn can afford higher loss ratios. This translates into more competitive pricing and is and overall negative for the industry. Growth/Recent Acquisitions. In terms of the company’s ability to continue to grow the business. Tom sees the recent acquisition of Brit the specialty insurer from the U.K for $1.88 B as big plus for the company. Taking 2014 as a reference Fairfax Financial Holdings will now add additional capacity to write premiums of around ($1.5 Billion). This is around 20% of Fairfax’s current underwriting capacity. Considering the increase in underwriting capacity that will generate cash to continue to invest in other assets and that Fair Fax, paid around 10 times earnings (taking in to account Trailing 12 months ending June 2014), the deal was highly accretive for FFH.TO shareholders. Investment Risks. Concerning investment risks, the analyst noticed that as any insurance company Fairfax Financial Holdings could face potential problems if natural Catastrophes (that are at relatively low levels) were to increase substantially. Also, if the competitive landscape remains intense and pricing is weak revenues could be affected due to the inability to command higher prices. Looking know at Fairfax specifically, the other big risk the analyst noted is that returns from the investment portfolio have contributed in the past to a lot of EPS (think of 2008-2009) but tend to be very volatile as the company restrains from chasing yield and invests more in the long term. Benchmarking and Valuation Given the unpredictable nature of about 40% of the cash flows that are spread over a broad set of geographies and asset classes (including investments in equity of associates, portfolio of common stocks and derivatives (hedges). We felt that forecasting cash flows going forward will be too unpredictable to arrive at a proper valuation for the equity in Fairfax Financial. Instead, we decided to use relative valuation techniques (COMPCO) to benchmark the value of the equity against multiples of comparable peers. For peers, we used 4 companies that act like insurance companies with active investment portfolios or mini conglomerates where managers actively allocate capital, and are generally unconcerned with returning a lot of capital through dividends or executing stock splits. To balance the mix we also included 4 insurance companies that operate in similar markets with fairly similar products. Bellow, some of the most relevant metrics of the companies in the peer group that serve as benchmarking tools.
- 14. BABSON College Fund 14 Financials Sector Team October 22/2014 By using a blended compco between price to book and price to earnings ratios (equally weighted) and taking the mean of these multiples we arrive at a fair value of equity for Fairfax Financial of $ 699.97. This implies about 6.7% upside from where the stock is currently trading at. Hence, our HOLD rating on the stock. Our thesis is that due to the volatility of the company’s earnings the stock trades around book value more than anything else, and currently is trading in the upper range of that price to book ratio. If earnings were to stabilize going forward we see a lot of good upside potential for the stock, taking into account for example that last year the company generated EPS of $ 77.09. OPERATING METRICS Company Name LTM EBIT Margin % LTM Net Income Margin % LTM Total Debt/Capital % LTM Total Debt/EBITDA 5 Year Beta RenaissanceRe Holdings Ltd. (NYSE:RNR) 56.2% 42.49% 4.77% 0.3x 0.44 Everest Re Group Ltd. (NYSE:RE) 25.6% 20.71% 7.50% - 0.61 Alleghany Corporation (NYSE:Y) 19.5% 12.98% 19.42% 1.5x 0.71 ACELimited (NYSE:ACE) 19.4% 14.74% 20.33% 2.0x 0.87 The Chubb Corporation (NYSE:CB) 18.2% 15.38% 16.66% 1.3x 0.66 Loews Corporation (NYSE:L) 17.9% 4.13% 30.21% 3.1x 1.05 Berkshire Hathaway Inc. (NYSE:BRK.A) 17.2% 11.04% 23.74% 1.9x 0.49 Markel Corp. (NYSE:MKL) 10.9% 6.26% 23.90% 3.6x 0.75 Fairfax Financial Holdings Limited (TSX:FFH) 25.4% 16.30% 24.60% 1.2x 0.48 Summary Statistics LTM EBIT Margin % LTM Net Income Margin % LTM Total Debt/Capital % LTM Total Debt/EBITDA 5 Year Beta High 56.2% 42.49% 30.21% 3.6x 1.05 Low 10.9% 4.13% 4.77% 0.3x 0.44 Mean 23.1% 15.96% 18.32% 1.9x 0.7 Median 18.8% 13.86% 19.87% 1.9x 0.69 COMPCO OVERVIEW Company Name Day Close Price Latest Market Capitalization Latest LTM Tangible Book Value/Share Berkshire Hathaway Inc. (NYSE:BRK.A) 221,180.0 363,309.7 102,814.05 Markel Corp. (NYSE:MKL) 745.44 10,407.8 385.42 Alleghany Corporation (NYSE:Y) 472.54 7,562.5 450.23 Everest Re Group Ltd. (NYSE:RE) 177.43 7,928.6 166.74 ACE Limited (NYSE:ACE) 114.01 37,821.4 72.61 RenaissanceRe Holdings Ltd. (NYSE:RNR) 102.53 3,930.0 89.95 The Chubb Corporation (NYSE:CB) 100.45 23,189.6 68.02 Loews Corporation (NYSE:L) 41.01 15,304.0 50.48 Fairfax Financial Holdings Limited (TSX:FFH) 524.28 11,516.4 321.24 Summary Statistics Market Capitalization Latest LTM Tangible Book Value/Share High 363,309.7 102,814.05 Low 3,930.0 50.48 Mean 58,681.7 13,012.19 Median 12,855.9 128.35 RELATIVE VALUATION Company Name EPS 2014 EPS 2015 (E) Book Value/Share 2014 Book Value/Share 2015 (E) Fairfax Financial 77.09 50.0 405.0 490.05 P/E2014 P/E2015 (E) P/B 2014 High 33.5x 32.51x 1.5x Low 6.8x 9.52x 0.8x Mean 15.0x 16.36x 1.2x Median 12.6x 13.33x 1.2x = Implied High 35,712.2 16,149.6 Low 10,457.7 8,613.1 Mean 17,971.5 12,785.1 Median 14,643.0 12,381.4 / Shares Outstanding 22.0 22.0 = Implied Price High 1,625.5 735.1 Low 476.0 392.0 Mean 818.0 581.9 Median 666.5 563.6 Weight in 50% 50% High 1180.29 Low 434.02 Mean 699.97 Median 615.03 Final Implied 699.97 Share Price 656.00 Potential 6.70%
- 15. BABSON College Fund 15 Financials Sector Team October 22/2014 Appendix 1: FFH.TO’s Financial Statements Source: Capital IQ Balance Sheet Balance Sheet as of: Restated Dec-31-2009 Restated Dec-31-2010 Reclassified Dec-31-2011 Restated Dec-31-2012 Dec-31-2013 Press Release Dec-31-2014 Currency USD USD USD USD USD USD ASSETS Investment In Debt Securities 11,321.5 12,261.7 11,023.3 10,919.5 9,790.9 11,445.5 Invest. in Equity and Pref. Securities, Total 5,921.9 5,811.7 5,362.1 6,575.9 6,297.9 6,842.6 Total Other Investments 1,166.5 634.7 4,478.4 4,689.3 3,784.3 - Total Investments 18,409.9 18,708.1 20,863.8 22,184.7 19,873.1 18,288.1 Cash And Equivalents 2,388.4 3,260.5 1,903.8 2,769.4 3,752.4 6,668.9 Reinsurance Recoverable 3,818.6 4,145.7 4,626.5 5,896.1 5,502.1 3,982.1 Other Receivables 1,855.4 1,330.5 1,416.2 1,532.3 1,669.7 1,931.7 Deferred Policy Acq. Costs 372.0 357.0 415.9 463.1 462.4 497.6 Net Property, Plant & Equipment 168.6 184.8 210.8 259.9 241.2 - Goodw ill 249.3 575.7 696.3 791.1 851.3 - Other Intangibles 189.5 373.4 418.9 530.1 460.5 1,558.3 Restricted Cash 159.8 113.5 140.9 223.2 352.2 - Other Current Assets 421.9 1,027.0 1,156.1 951.4 742.9 1,396.5 Deferred Tax Assets, LT 318.7 490.5 628.2 607.6 1,015.0 460.4 Other Long-TermAssets 99.9 881.4 929.5 736.5 1,036.0 1,347.6 Total Assets 28,452.0 31,448.1 33,406.9 36,945.4 35,958.8 36,131.2 LIABILITIES Accounts Payable 1,137.9 45.4 23.5 64.1 22.4 2,029.1 Accrued Exp. 100.2 398.6 861.4 761.7 864.4 - Insurance And Annuity Liabilities - 16,049.3 17,232.2 19,648.8 19,212.8 20,438.7 Unpaid Claims 14,766.7 - - - - - Unearned Premiums 1,913.8 2,120.9 2,487.3 2,727.4 2,680.9 - Reinsurance Payable 354.9 722.3 822.4 1,079.8 941.7 461.5 Curr. Port. of LT Debt - 2.5 87.1 182.3 - - Short-termBorrow ings - - - 36.6 6.0 - Long-TermDebt 2,304.7 2,717.5 2,880.9 2,779.2 2,938.0 3,179.0 Trust Pref. Securities 9.1 9.1 50.5 50.5 50.5 - Curr. Income Taxes Payable 70.9 31.7 21.4 70.5 80.1 118.3 Other Current Liabilities 56.9 268.8 230.5 326.4 367.6 160.8 Pension & Other Post-Retire. Benefits - 139.4 154.1 182.0 166.9 - Other Non-Current Liabilities 0.3 268.7 147.1 141.6 167.0 - Total Liabilities 20,715.4 22,774.2 24,998.4 28,050.9 27,498.3 26,387.4 Pref. Stock, Redeemable 227.2 934.7 934.7 1,166.4 1,166.4 1,164.7 Total Pref. Equity 227.2 934.7 934.7 1,166.4 1,166.4 1,164.7 Common Stock 3,058.6 3,251.3 3,247.1 3,247.1 3,646.6 8,361.0 Additional Paid In Capital - - - - - - Retained Earnings 3,468.8 4,394.4 4,153.8 4,389.8 3,551.2 - Treasury Stock (28.7) (52.4) (72.7) (121.1) (140.0) - Comprehensive Inc. and Other 893.1 104.6 99.7 138.9 128.9 - Total Common Equity 7,391.8 7,697.9 7,427.9 7,654.7 7,186.7 8,361.0 Minority Interest 117.6 41.3 45.9 73.4 107.4 218.1 Total Equity 7,736.6 8,673.9 8,408.5 8,894.5 8,460.5 9,743.8 Total Liabilities And Equity 28,452.0 31,448.1 33,406.9 36,945.4 35,958.8 36,131.2 Supplemental Items Total Shares Out. on Filing Date 20.0 20.5 20.4 20.2 21.2 21.2 Total Shares Out. on Balance Sheet Date 20.0 20.5 20.4 20.2 21.2 21.2 Book Value/Share $369.8 $376.33 $364.55 $378.1 $339.0 $394.83 Book Value/Share (Reported) $369.8 $376.33 $364.55 $378.1 $339.0 $394.83 Tangible Book Value 6,953.0 6,748.8 6,312.7 6,333.5 5,874.9 6,802.7 Tangible Book Value/Share $347.84 $329.93 $309.81 $312.84 $277.12 $321.24 Total Debt 2,313.8 2,729.1 3,018.5 3,048.6 2,994.5 3,179.0 Net Debt (74.6) (531.4) 1,114.7 279.2 (757.9) (3,489.9)
- 16. BABSON College Fund 16 Financials Sector Team October 22/2014 Source: Capital IQ Income Statement For the Fiscal Period Ending Reclassified 12 months Dec-31-2009 Restated 12 months Dec-31-2010 Reclassified 12 months Dec-31-2011 Restated 12 months Dec-31-2012 12 months Dec-31-2013 Press Release 12 months Dec-31-2014 Currency USD USD USD USD USD USD Premiums and Annuity Rev. 4,422.0 4,580.6 5,426.9 6,084.9 6,077.3 6,216.2 Total Interest And Dividend Income 712.7 711.5 705.3 409.3 376.9 403.8 Asset Management Fee - - - - - - Gain (Loss) on Sale of Invest., Total (Rev) 944.5 (3.0) 691.2 642.6 (1,564.0) 1,736.2 Non-Insurance Activities Revenue - - - - - - Other Revenue 556.4 595.1 651.6 879.2 1,054.7 1,661.7 Total Revenue 6,635.6 5,884.2 7,475.0 8,016.0 5,944.9 10,017.9 Policy Benefits 3,186.9 3,398.7 4,585.3 4,242.6 3,670.3 3,794.3 Policy Acq. and Underw riting Costs 701.1 707.5 795.4 920.0 969.2 959.9 Depreciation & Amort. - - - - - - Amort. of Goodw ill and Intangibles - - - - - - Selling General & Admin Exp., Total - 973.5 1,148.3 1,119.7 1,140.9 1,227.2 Other Operating Exp. 1,360.2 538.7 636.5 830.3 906.9 1,492.3 Total Operating Exp. 5,248.2 5,618.4 7,165.5 7,112.6 6,687.3 7,473.7 Operating Income 1,387.4 265.8 309.5 903.4 (742.4) 2,544.2 Interest Expense, Total (166.3) (195.5) (214.0) (208.2) (211.2) (206.3) EBT Excl. Unusual Items 1,221.1 70.3 95.5 695.2 (953.6) 2,337.9 Restructuring Charges - - - (12.4) (12.9) - Impairment of Goodw ill (3.6) 83.1 - 6.8 - - Asset Writedow n - - - - (31.2) - Other Unusual Items (11.9) (2.3) (104.2) (40.6) (3.4) - EBT Incl. Unusual Items 1,205.6 151.1 (8.7) 649.0 (1,001.1) 2,337.9 Income Tax Expense 214.9 (186.9) (56.5) 114.0 (436.6) 673.3 Earnings from Cont. Ops. 990.7 338.0 47.8 535.0 (564.5) 1,664.6 Earnings of Discontinued Ops. - - - - - - Extraord. Item & Account. Change - - - - - - Net Income to Company 990.7 338.0 47.8 535.0 (564.5) 1,664.6 Minority Int. in Earnings (133.9) (2.2) (2.7) (8.1) (8.9) (31.4) Net Income 856.8 335.8 45.1 526.9 (573.4) 1,633.2 Pref. Dividends and Other Adj. 51.8 31.4 51.5 60.5 60.8 - NI to Common Incl Extra Items 805.0 304.4 (6.4) 466.4 (634.2) 1,633.2 NI to Common Excl. Extra Items 805.0 304.4 (6.4) 466.4 (634.2) 1,633.2 Per Share Items Basic EPS $43.99 $14.9 ($0.31) $22.95 ($31.15) $77.09 Basic EPS Excl. Extra Items 43.99 14.9 (0.31) 22.95 (31.15) 77.09 Weighted Avg. Basic Shares Out. 18.3 20.4 20.4 20.3 20.4 21.2 Diluted EPS $43.75 $14.82 ($0.31) $22.68 ($31.15) $73.01 Diluted EPS Excl. Extra Items 43.75 14.82 (0.31) 22.68 (31.15) 73.01 Weighted Avg. Diluted Shares Out. 18.4 20.5 20.4 20.6 20.4 22.4 Normalized Basic EPS $34.39 $2.04 $2.79 $20.98 ($29.71) $67.49 Normalized Diluted EPS 34.2 2.03 2.79 20.73 (29.71) 63.92 Dividends per Share $10.0 $10.0 $10.0 $10.0 $10.0 $10.0 Payout Ratio % 17.7% 69.1% 570.7% 50.5% NM NA Supplemental Items EBITDA 1,423.2 305.9 357.5 956.5 (686.6) 2,636.1 EBITA 1,398.5 277.4 328.0 922.0 (721.5) 2,544.2 EBIT 1,387.4 265.8 309.5 903.4 (742.4) 2,544.2 EBITDAR NA 362.4 414.9 1,022.0 (620.4) NA As Reported Total Revenue* 6,635.6 5,967.3 7,475.0 8,022.8 5,944.9 10,017.9 Effective Tax Rate % 17.8% NM NM 17.6% NM 28.8% Total Current Taxes 202.1 16.6 71.6 98.2 (4.8) - Total Deferred Taxes 12.8 (203.5) (128.1) 15.8 (431.8) - Normalized Net Income 629.3 41.7 57.0 426.4 (604.9) 1,429.8 Interest on Long Term Debt 166.3 195.3 213.9 206.0 207.9 NA Non-Cash Pension Expense 2.8 0.3 (1.8) 4.3 3.6 -
- 17. BABSON College Fund 17 Financials Sector Team October 22/2014 Important Disclosures Babson College Fund The Babson College Fund (BCF) is an academic program in which selected students manage a portion of the Babson College endowment. The program seeks to provide a rich educational experience through the development of investment research skills and the acquisition of equity analysis and portfolio management experience. Please visit http://cutler.babson.edu for more information. Analyst Contact Information Alfredo Leon | 7347304664 | rdiplock1@babson.edu Paul Ramey | 6032754515 | pramey1@babson.edu Ryan Diplock| 4136956343| rdiplock1@babson.edu Definition of Ratings BUY: Expected to outperform the S&P500 producing above average returns. HOLD: Expected to perform in line with the S&P500 producing average returns. SELL: Expected to underperform the S&P500 producing below average returns. References Capital IQ Thomson ONE S&P Net Advantage IBIS World Bloomberg FFH.TO Group Company Website, Letters to Shareholders, company reports. Analysts: Tom Mackinnon | BMO Capital Markets | 14163594629. Neil Fonseca| EVA Dimensions| 12126458400.