Infographic vs. Data Visualization
•Download as PPTX, PDF•
1 like•1,316 views

Delivered by Anne Hamland for WiLSWorld 2017 on July 27th, 2017 as part of the presentation, "Uses and Strategies of Data for Libraries."

Recommended
More Related Content
Similar to Infographic vs. Data Visualization
Similar to Infographic vs. Data Visualization (20)
More from WiLS
More from WiLS (20)
Recently uploaded
Recently uploaded (20)
Infographic vs. Data Visualization
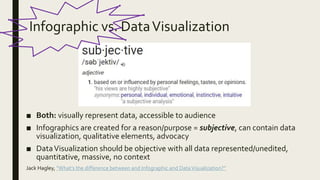
- 1. Infographic vs. DataVisualization ■ Both: visually represent data, accessible to audience ■ Infographics are created for a reason/purpose = subjective, can contain data visualization, qualitative elements, advocacy ■ DataVisualization should be objective with all data represented/unedited, quantitative, massive, no context Jack Hagley, “What’s the difference between and Infographic and DataVisualization?”
- 2. INFOGRAPHICS What,Why, & How Anne Hamland, Communications Coordinator WisconsinValley Library Service,Wausau WiLSWorld July 2017
- 3. What is an infographic? Components ■ Data, icons, images, text, that work together to tell a story. ■ Always a purpose, call to action. ■ The story of the creator,YOU! Libraries matter: 18 fantastic library infographics Pikochart user 26reasonsroad3
- 4. What is an infographic? Types ■ Map: Showcases data trends based on location ■ Versus: Compares two things in a head-to-head study ■ Timeline:Tells a story through a chronological flow ■ List: Supports a claim through a series of steps ■ Flowchart: Provides a specialized answer to a question via reader choices ■ VisualArticle: Makes a piece of writing more visual ■ DataVisualization:Communicates data through charts, graphs, and/or design ■ And more! ■ The 7 CommonTypes of Infographic: Easelly, 2015
- 5. Why? : Real-World Uses for Information Visualization in libraries WHY? “Clearly, and in a compelling manner…information graphics can do more than just present numbers. They offer a medium for individuals to tell their story, engage and convince their readers, and invite them to make a personal connection to the data.” Hsuanwei Michelle Chen. “Real-World Uses for InformationVisualization in libraries.” Chapter 4, LibraryTechnology Reports,April 2017.
- 6. Why? : Purpose Audience ■ Purpose drives design and content ■ What will you use it for? Who is your audience? What do they need to know? <Greatest.com
- 7. Qualitative Data Where can you get Qualitative data? ■ Patron pictures with quotes: jot down quotes with permission, print and online feedback forms for service/programs/website everything! Word, Survey Monkey, Google Forms,Jot Form … ■ Pictures with permission. Does your library have a photography/videography policy you can use? Group pictures! ■ Major projects/hurdles Patron submissions! 1,000 Bks, Programs, Projects ■ Community Partnership impact statements ■ Did you know? Facts.
- 8. Quantitative Data Where can you get Quantitative data? ■ What numbers are important to you and your infographic’s purpose? Examples? ■ Annual reports: library visits, computer usage, program attendance anything BUT circulation PLEASE, okay fine. ■ Library visits, library programs, summer reading participants, circulation reports and more! ■ Community Partnerships, count em up! Include logos and project titles. LibraryVisits Summer Reading Participants Storytimes Per Staff AuthorVisits Database Uses Public Computer Uses Tax Forms
- 9. Qualitative/Quantitative Data L.E. Phillips Memorial Public Library: 2016 Annual Report Get personal! Behind the scenes. Book Bikes!Visuals!
- 10. How? : Prepare I have the data and stories, now what? ■ Think about the story you want to tell. ■ Consult basic design principles. – Creative Bloq, Usability.gov, Adobe Color CC, tons of resources out there with simple search. ■ Sketch it out! Grab a pencil and paper and draw, re-draw, and draw again! ■ What images might match with your content? Icons or pictures? Font? WVLS.org/marketing-infographics/
- 11. How? :Tools ■ Original images, made by you ■ Icons, Images, Galore! ■ No/Low cost images, fonts, graphics, & more! ■ Always check license information and requirements before use. ■ Images – canva.com – flickr.com – pixabay.com – freeimages.com – morgueFile – bing/images – freedigitalphotos.net – freerangestock.com – freephotosbank.com ■ Fonts – dafont.com – impallari.com – fontsquirrel.com ■ Icons/Graphics – The Noun Project – Icons8.com GIMP
- 12. How? : Free Programs ■ BuildYour Infographic- What do you have experience with? ■ Microsoft, Publisher,Word, PowerPoint, check your existing software. ■ Free/FreeVersions – Piktochart – Canva – Venngage – Infogr.am – Postermywall
- 13. Thank you! A big thank you to: ■ Marc Neufeld, DoIT AcademicTechnology, UW-Madison – “Infographics:Turning Data into Narrative”WiLSWorld 2016, workshop ■ Indianhead Federated Library System Anne Hamland comm.coordinator@wvls.org 715-261-7250 Communications Coordinator,WisconsinValley Library Service