
Recommended
More Related Content
What's hot
What's hot (20)
Similar to Forex Trading For Beginners
Similar to Forex Trading For Beginners (20)
Recently uploaded
Recently uploaded (20)
Forex Trading For Beginners
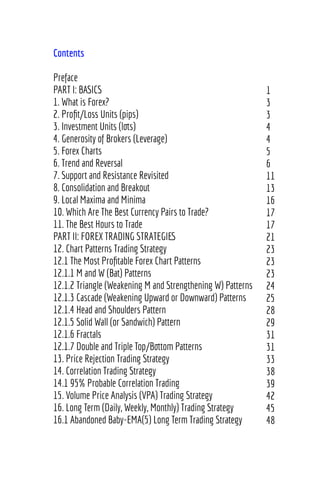
- 3. Preface Forex trading is about having a solid trading strategy, having a sound plan to manage your risks, being able to control your excitements during a trade and having discipline. “The Ultimate Forex Trading System-Unbeatable Strategy to Place 92% Winning Trades” is an attempt to create a balanced system of all these four key factors. The result is a high performance trading system quite adaptable to any trading habit and personal lifestyle. This book includes the following topics. In part one I have explained preliminary but key concepts that every Forex trader need to know. Topics such as support and resistance, consolidation and breakout, the best currency pairs to trade, the best hours for trading and so on. In part two you will find eight essential Forex trading strategies that have passed my strict criteria to be easy to apply, highly profitable and manageable. Chart patterns trading as a classic trading method is the first strategy that I have explained in this book. Only very high probable chart patterns are discussed and real examples help you to discover their trading potential. In this chapter I have focused on training eyes and mind to predict (with high probability) how the next bar(s) will unfold. Price rejection (a subsidiary of price action) is the second trading strategy that I have discussed in this book. Using price rejection pin and twin bars (that reveals the momentum behind the price) is a
- 4. classic skill that every professional trader has to know and benefit from it. The third strategy that I have explained is correlation (negative or positive) between currency pairs. Correlation trading is a very accurate strategy that exploits the discrepancy or time lag between two normally correlated currency pairs. Volume Price Analysis (VPA) is the next strategy that I have explored in this part of the book. Under this topic you will see how very simple rules enable you to interpret volume-price interplay and how it makes a real difference in your trading. For those who cannot be involved to trading 24 hours a day and wish to enter long term trades to have enough time to leave their trading room for a few days (or even weeks), long term trading strategy is the solution. Especially, a very highly probable trading method that I have called it Abandoned Baby EMA(5) is a very promising long term trading strategy. The sixth trading strategy uses real time sentiment charts (buy/sell positions) of worldwide traders to benefit from their opinion to forecast how the market will behave in the next hours. Checking multiple time frames is a good method to double confirm entering a trade. It has been discussed in Multiple Time Frame Trading Strategy chapter. News trading as the last strategy has been treated from a statistical point of view. How estimate your chance to enter a winning trade after or during news releases by studying the price history and market reaction to the medium or high impact news and what measures you have to take to manage this type of trading.
- 5. Part three is the climax of the book because you will learn to combine all your knowledge about Forex basic concepts and various trading strategies to enter only high performance (more than 90% winning rate) trades. Many real trading examples will guide you to reach this level of trading skills. Money and risk management has been discussed around the very practical concept of risk/reward ratio, the only mechanism you need to control your trades, minimize your risks, maximize your profit and do trade in a very relaxed and comfortable state of mind. And under Psychology of Trading you will find the summary of the best advices to control your psychology during trades and maintain a winner mindset. Mostafa Afshari August 2016
- 8. 2
- 9. 3 1. What is Forex? Forex is the knowledge and art of trading currencies in a way to gain some profit. In other words, Forex market is a place where people buy or sell currencies expecting profit. It is clear that we only buy when we expect the value of a currency will rise and sell when we expect it will fall. All the efforts of a Forex trader are in this way that finds some clues to predict the upward or downward movement of a currency price. Currencies are usually represented in pairs with US dollar as the base. Major currency pairs belong to the major economical countries. EUR/USD, GBP/USD, USD/JPY, AUD/ USD, USD/CHF and USD/CAD are the majors. 2. Profit/Loss Units (pips) Pip (or pips in plural) stands for point in percent, means one fourth decimal in a unit of currency. For example if the price (or exchange rate) of USD/CAD goes up from 1.0035 to 1.0085 it has changed 0.0050 unit or 50 pips. So, if you buy USD/ CAD at 1.0035 and sell it at 1.0085 you will profit 50 pips. In recent years, one fifth decimal i.e. 0.00001 unit (or pipette) has been used widely by the references but for practical purposes pip is more convenient.
- 10. 4 3. Investment Units (lots) A lot in Forex means the portion of trading investment in comparison to $100,000. For example if you invest $10,000 in a trade it will be $10,000/$100,000=0.1 lot. It is very important that you choose your trading lot size according to your account balance. Usually investing 3% up to 5% of the total balance in a single trade is considered safe. 4. Generosity of Brokers (Leverage) One of the advantages of Forex market that makes it very attractive is that the brokers usually multiply your investment amount in each trade by 50-500 times. This is called leverage. For example if you invest $50 in a trade with a leverage of 100, actually you will enter to the market with $5,000. In this case your trade lot size will be $5,000/ $100,000=0.05, or if you want to trade 0.1 lot at leverage of 150 you should invest (0.1x$100,000)/150=$66 in this trade. So, your required investment in each trade will be determined by your lot size and the leverage level of the broker. Using the leverage offer of the broker depends on your choice and there are lots of controversies around it because although you can multiply your profit if you leverage your investment, in the same time there is a risk of a great loss (if the currency goes in wrong direction). But to end this argument we have to say if our trading system (or strategy)
- 11. 5 is quite reliable and its profit/loss ratio is high why not use leverage advantage. Leverage is bad in a case which the risk of loss is higher than win. 5. Forex Charts Forex charts are the drawings of currency prices in various time frames. These are drawn in forms of lines or candles (bars). Candle form is traders standard and the most beneficial form for trading purpose because each single candle shows the opening, closing, maximum and minimum of the price in a specific time frame. If a candle body opens at a lower and closes at a higher price it is called bullish or long and is drawn in green (or blue). Maximum and minimum spot prices in the same candle are shown by spikes. If the price opens in a higher and closes in a lower price the candle or chart is called bearish or short and is shown in red. Candle (or bar) charts are the best visual tool to analyze a trading opportunity. In this way, having top quality charts are very important. A good chart should be clear, exact (both in pricing and drawing) and well-scaled. Only on such a quality chart you will be able to spot prices, compare, evaluate or calculate them or realize the patterns. Below you can find four quality online charting tools. You should enable Java on your browser to see the charts. https://www.tradingview.com/e/
- 12. 6 http://www.netdania.com/ (go to five star chart under charts tab) http://www.fxempire.com/ https://www.dukascopy.com/swiss/english/marketwatch/ charts/ Exercise 1. Go to https://www.tradingview.com/e/ and type EURUSD (in the top left search box), check candle forms, prices, pips and timeframes. Exercise 2. Open your trading platform and check its available trading lot sizes and leverages. Exercise 3. You want to risk only $25 of your account balance on trading. If your leverage is x200, which lot size should you trade? 6. Trend and Reversal If a currency goes up or down continually for a long time (a few days or weeks), we say that it is in a trend. Trends are caused by large scale (fundamental) economic events or factors (growth, recession, high impact news, etc.). In each trade we have to consider the trend (which I have called it background trend effect) to increase the chance of our success. When a trend ends and start to reverse we call such thing a reversal.
- 14. 8 Distinguishing a true from a fake reversal is very important in trend trading. There are many simple (Moving Average Cross, Regression Line) or advanced (Hurst Exponent, Market Meanness Index, etc.) indicators and methods that claim to sense the strength of trend and the time of price reversal and signal it to the trader but after study of many of them I concluded that there is not a holy grail method or indicator that tell you precisely if the trend will continue or when the market will reverse. They work but with a significant percentage of error because the price movement has a stochastic and heteroscedastic nature and only God exactly knows what will happen in the future. Also, there is not a meaningful difference between accuracy of advanced and simple methods of trend and reversal prediction. In realizing trend and reversal, maybe experience and a sense of Figure 6.3 A reversal
- 15. 9 intuition are more helpful. However, two very simple methods can be useful and you can use them to identify a reversal with mediocre success. In the first method you can draw two Exponential Moving Averages for example EMA(9) and EMA(15). When the fast EMA(9) cross over or cross under the slow EMA(15), it is a sign of a reversal. The other method is using of two regression lines. In an uptrend draw a regression line tangent to lower lows and one regression line tangent to the latest two higher highs. If these two lines cross each other in some point it can be a potential reversal point and if not, the trend may probably continue. In downtrend, draw a line tangent to higher highs and a line tangent to the latest two lower lows. If two lines cross each other the cross point can be a potential reversal and if not the downtrend more likely will continue. Figure 6.4 Confirming a reversal by cross of two regression lines
- 17. 11 7. Support and Resistance Revisited Many experts believe that support and resistance are the most important concepts in Forex. I explain them and their use here so you can judge yourself how much they may worth. Support is a zone where the currency price can hardly pass it to go down further. It is not a fix price but a price range (or level) that each time the price reaches it, lose momentum and stops there. On the other side, resistance is a zone (or level) where resists the price to go up further. If we draw an hourly or a 4-hour chart for each of the currency pairs we can see top and down levels that price has tested them many times but never has passed them as if those levels act as barriers for it. If we take a closer look at the charts, there are several intermediate support and resistance levels between weekly or monthly high or low prices. Weekly or monthly highs and lows are called major support or resistance levels. The price swings around them for a while and then goes up or down to reach another intermediate level as if it jumps between these levels. If we revisit the charts we understand that as soon as the price unleashes from one level, almost in all times goes non-stop to reach the nearest level, then heads for another level in its neighborhood. This is a point that needs great attention. If this is true, so there is plenty of trading opportunities during a currency movement from one support or resistance level to another one. Actually, experienced traders take the full advantage of this property to make big bucks on Forex.
- 18. 12 In this book I usually use support/resistance because they are interchangeable. One price level once was a support now can act as a resistance and once a resistance level now can act as a support level for the price. However, support and resistance have a deeper meaning. A support occurs when a series of positive economic factors force the price to stop weakening and push it upward. Just the same, resistance takes place when a series of negative economic factors cause an upward price to stop. At these levels, the currency has reached its full potential and cannot proceed further. To go further and pass the barrier it needs more positive or negative economical drives. From this point of view we can resemble support and resistance as the two poles of an electromagnet with the price (like a piece of iron) swings in between. The reason of the iron (or price) swing is the current of electricity (in our case economical drives). Figure 7.1 Support/resistance levels
- 19. 13 When the current increases, the price jumps up and when it decreases, the price falls down. So, a smart trader takes the most out of all these theories. Trading has a very close relationship with probability. So, if we take it to account, the chance of breaking a strong support or resistance is much less than the chance of price rebound. According to this logic, if we buy at support or sell at resistance, with a high probability we will be on the profit side. Math says this and all we know that math is right. Exercise 4. Chart major currencies in various time frames (1, 2, 3, 4-hour and daily) on https://www.tradingview.com/e/ and find their major and intermediate support and resistance levels. Note that the price is released from a level and goes non-stop to rest on another level. 8. Consolidation and Breakout If the price swings in a relatively tight range (15-25 pips) for a long time (a few hours or more) it is said that the currency is in consolidation. If we zoom in a 1-hour consolidation by charting shorter time frames (for example 15-minute charts), we can see several zigzag moves. As soon as we zoom out the same consolidation to a 4-hour chart, that consolidation transforms to a single 4-hour small body candle (that may have equal head and tail pins). So, different charting time frames can hide or show a consolidation. Moreover, any short body (child) equilateral pin bar in any time frame is a consolidation if it is broken down to smaller time frames.
- 20. 14 Having a look at the behind scene, it will be found that consolidation actually happens when economic forces (or supply-demand pressure) reach a very tight balance. Positive and negative forces fight each other to overcome and push the price up or pull it down. During a consolidation period this does not take place until one of the forces wins and causes a fast, big move. Such an explosive move is called breakout. In other words, breakout is the release of currency from a tight consolidation range and heading fast upward or downward seeking to reach new price levels (usually at a major support or resistance). General rule is that the momentum of a breakout is proportionate to the duration of its consolidation. Longer time consolidations usually signal that bigger breakouts are on the way. Now, the question is: when a breakout will happen and what will be the direction of the move? The answer is: a breakout happens when the involving economic forces get out of balance and it goes to the direction that the winner forces determine. To know about these forces we need to learn more about economy, and currency dynamics. In fact, the challenge of breakout trading is realizing the direction of the breakout. If we know this beforehand with a good probability, trading breakouts will be turned to an enjoyable fun. Fortunately, we have a leading signal that solves this difficulty. Yes, the correlated currency pairs (see chapter 14 for details about correlation). Because global markets are not synchronous in all times, in many cases a currency pair correlated (positively or negatively) to our
- 21. 15 intended currency pair has started its move sooner and signals us the tendency of the market. We can follow this leading signal and buy or sell our target currency pair. See the below examples for more clarification. Figure 8.1 A consolidation/breakout trading opportunity Figure 8.2 A consolidation/breakout trading opportunity
- 22. What you read is a free sample of “The Ultimate Forex Trading System-Unbeatable Strategy To Place 92% Winning Trades.” You Can Download This Book Here: