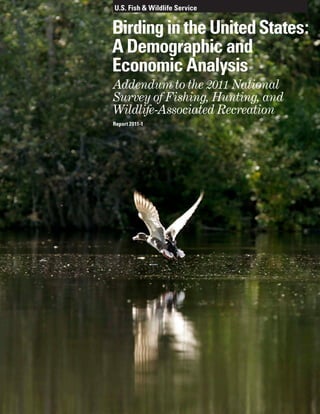
Birding in the United States: A Demographic and Economic Analysis
•
1 like•970 views

Addendum to the 2011 National Survey of Fishing, Hunting and Wildlife-Associated Recreation.

Recommended
Recommended
More Related Content
Similar to Birding in the United States: A Demographic and Economic Analysis
Similar to Birding in the United States: A Demographic and Economic Analysis (20)
More from usfws
More from usfws (13)
Recently uploaded
Recently uploaded (20)
Birding in the United States: A Demographic and Economic Analysis
- 1. U.S. Fish & Wildlife Service Birding in the UnitedStates: A Demographic and Economic Analysis Addendum to the 2011 National Survey of Fishing, Hunting, and Wildlife-Associated Recreation Report 2011-1
- 3. U.S. Fish & Wildlife Service December 2013 Erin Carver U.S. Fish and Wildlife Service Division of Economics Arlington VA This report is intended to complement the National and State reports from the 2011 National Survey of Fishing, Hunting, and Wildlife-Associated Recreation. The conclusions are the author’s and do not represent official positions of the U.S. Fish and Wildlife Service. The author thanks Sylvia Cabrera, Richard Aiken, and Matthew Fuller for their input into this report. Birding in the UnitedStates: A Demographic and Economic Analysis Addendum to the 2011 National Survey of Fishing, Hunting, and Wildlife-Associated Recreation Report 2011-1
- 4. 2 Birding in the United States: A Demographic and Economic Analysis Contents Introduction.. . . . . . . . . . . . . . . . . . . . . . . . . . . . . . . . . . . . . . . . . . . . . . . . . . . . . . . . . . . . . . . . . . . . . . 3 Birders. . . . . . . . . . . . . . . . . . . . . . . . . . . . . . . . . . . . . . . . . . . . . . . . . . . . . . . . . . . . . . . . . . . . . . . . . . . 4 Where and What are They Watching?�������������������������������������������� 10 Avidity������������������������������������������������������������������������� 10 The Economics of Bird Watching. . . . . . . . . . . . . . . . . . . . . . . . . . . . . . . . . . . . . . . . . . . . . . . . . . 12 Total Industry Output����������������������������������������������������������� 14 Employment and Employment Income������������������������������������������� 14 Federal and State Taxes��������������������������������������������������������� 14 Conclusion.. . . . . . . . . . . . . . . . . . . . . . . . . . . . . . . . . . . . . . . . . . . . . . . . . . . . . . . . . . . . . . . . . . . . . . 15 References.. . . . . . . . . . . . . . . . . . . . . . . . . . . . . . . . . . . . . . . . . . . . . . . . . . . . . . . . . . . . . . . . . . . . . . 16
- 5. Birding in the United States: A Demographic and Economic Analysis 3 Introduction The following report provides up-to- date information so birders and policy makers can make informed decisions regarding the management of birds and their habitats. This report identifies who birders are, where they live, how avid they are, and what kinds of birds they watch. In addition to demographic information, this report also provides an economic measure of birding. It estimates how much birders spend on their hobby and the economic impact of these expenditures. By understanding who birders are, they can be more easily reached and informed about pressures facing birds and bird habitats. Conversely, by knowing who is likely not a birder, or who is potentially a birder, information can be more effectively tailored. The economic values presented here can be used by resource managers and policy makers to demonstrate the economic might of birders, the value of birding – and by extension, the value of birds. All data presented here are from the wildlife-watching section of the 2011 National Survey of Fishing, Hunting, and Wildlife-Associated Recreation (FHWAR). It is the most comprehensive survey of wildlife recreation in the United States. Overall, about 9,300 detailed wildlife-watching interviews were completed with a response rate of 67 percent. The Survey focused on 2011 participation and expenditures by U.S. residents 16 years of age and older. AlMilliken/USFWS
- 6. 4 Birding in the United States: A Demographic and Economic Analysis Birders In 2011, there were 47 million birdwatchers (birders), 16 years of age and older, in the United States – about 20 percent of the population. What is a birder? The National Survey uses a conservative definition. To be counted as a birder, an individual must have either taken a trip one mile or more from home for the primary purpose of observing birds and/or closely observed or tried to identify birds around the home. Thus, people who happened to notice birds while they were mowing the lawn or picnicking at the beach were not counted as birders. Trips to zoos and observing captive birds also did not count. Backyard birding or watching birds around the home is the most common form of bird-watching. Eighty-eight percent (41 million) of birders are backyard birders. The more active form of birding, taking trips away from home, is less common with 38 percent (18 million) of birders partaking. The average birder is 53 years old and more than likely has a better than average income and education. She is slightly more likely to be female and highly likely to be white. There is also a good chance that this birder lives in the south in an urban area. Does this paint an accurate picture of a birder? Like all generalizations, the description of an “average” birder does not reflect the variety of people who bird, with millions falling outside this box. The tables and charts show numbers and participation rates (the percentage of people who participate) of birders by various demographic breakdowns. The tendency of birders to be middle-age or older is reflected in both the number of birders and participation rates. Looking at the different age categories in Table 1, the greatest number of birders were in the 55 plus age group. People over the age of 55 had the highest participation rates while the participation rate was particularly low for people ages 16 to 24. Chart 1. Birders in the United States: 2011 (16 years of age and older.) Total Birders 47 million Around-the-home 41 million Away-from-home 18 million Note: Detail does not add to total because of multiple responses. Table 1. Age Distribution of the U.S. Population and Birders: 2011 (Population 16 years of age and older. Numbers in thousands.) Age U.S. Population Number of Birders Participation Rate 16 to 24 34,169 1,939 6% 25 to 34 41,613 4,767 11% 35 to 44 40,779 6,799 17% 45 to 54 46,167 10,396 23% 55 plus 76,586 22,840 30% Chart 2. Birders’ Participation Rate by Age: 2011 U.S. Average: 20% ▼ 16 to 24 6% 25 to 34 11% 35 to 44 17% 45 to 54 23% 55 plus 30%
- 7. Birding in the United States: A Demographic and Economic Analysis 5 The higher the income and education level the more likely a person is to be a birder. Birders with incomes above the median participated at a higher rate than the average birder while birders with incomes below the median participated at a lower rate. Education, which is often highly correlated with income, shows the same trend. People with less than high school education participated at 11 percent – far below the national average – while people with a college degree had the highest participation rate at 28 percent. See Tables 2 and 3 for more information. Unlike hunting and fishing where men were overwhelmingly in the majority, a larger percent of birders were women – 56 percent in 2011 (See Chart 5). Chart 3. Birders’ Participation Rate by Income: 2011 U.S. Average: 20% ▼ Less than $20,000 15% $20,000 to $29,99916% $30,000 to $49,99919% $50,000 to $74,99925% $75,000 or more24% Chart 4. Birders’ Participation Rate by Education: 2011 U.S. Average: 20% ▼ 11 years or less11% High School Graduate15% Some College20% College Graduate +28% Chart 5. Percent of Birders by Gender: 2011 (Population 16 years of age and older.) Table 2. Income Distribution of the U.S. Population and Birders: 2011 (Population 16 years of age and older. Numbers in thousands.) Income U.S. Population Number of Birders Participation Rate Less than $20,000 30,550 4,455 15% $20,000 to $29,999 23,154 3,661 16% $30,000 to $49,999 40,036 7,734 19% $50,000 to $74,999 33,850 8,432 25% $75,000 or more 66,177 15,862 24% Table 3. Educational Distribution of the U.S. Population and Birders: 2011 (Population 16 years of age and older. Numbers in thousands.) Education U.S. Population Number of Birders Participation Rate 11 years or less 31,574 3,340 11% High School Graduate 81,984 12,462 15% Some College 55,014 10,849 20% College Graduate + 70,740 20,089 28% Male 44% Female 56% SteveHillebrand/USFWS
- 8. 6 Birding in the United States: A Demographic and Economic Analysis Excluding people that categorize their race as “Other”, birders are not a racially or ethnically diverse group. Ninety-three percent of birders identified themselves as white. The scarcity of minority birders is not just a reflection of their relatively low numbers in the population at large; it’s also a function of low participation rates. The participation rates of Hispanics, African-Americans, Asians, and “Other” were all 8 percent or lower while the rate for whites, 24 percent, was slightly above the 20 percent national average. The sparser populated an area, the more likely its residents were to watch birds. The participation rate for people living in small cities and rural areas was 22 percent – 2 percent above the national average. Whereas large metropolitan areas (1 million residents or more) had the greatest number of birders, their residents had the lowest participation rate, 12 percent. See Table 5. Chart 6. Birders’ Participation Rate by Race and Ethnicity: 2011 U.S. Average: 20% ▼ Hispanic8% White24% African American7% Asian4% All Others5% Table 4. Racial and Ethnic Distribution of the U.S. Population and Birders: 2006 (Population 16 years of age and older. Numbers in thousands.) Race U.S. Population Number of Birders Participation Rate Hispanic 32,557 2,578 8% White 182,872 43,323 24% African American 23,402 1,697 7% Asian 11,647 410 4% All Others 21,392 1,105 5% Table 5. Percent of U.S. Population Who Birded by Residence: 2011 (Population 16 years of age and older. Numbers in thousands.) Metropolitan Statistical Area U.S. Population Number of Birders Participation Rate 1,000,000 or more 127,462 15,141 12% 250,000 to 999,999 48,157 7,479 16% Less than 249,000 48,406 7,085 15% Outside MSA 15,288 3,410 22% SteveHillebrand/USFWS
- 9. Birding in the United States: A Demographic and Economic Analysis 7 Participation rates are varied across the United States. However, the highest participation rates are prevalent in the northern half of the country (with the exception of West Virginia), where the top 5 States include Vermont, Wisconsin, West Virginia, Wyoming, and Alaska. See Chart 7 for more details. RobertBurton/USFWS Chart 7. Birding Participation Ratees by State Residents: 2011 U.S. Average: 20% ▼ Vermont 39% Wisconsin 33% West Virginia 33% Wyoming 31% Alaska 30% Connecticut 29% Idaho 29% New Hampshire 27% Oklahoma 26% Colorado 26% Minnesota 25% Maine 24% Michigan 24% Pennsylvania 24% South Dakota 24% Washington 24% Arkansas 24% Indiana 23% Oregon 23% Tennessee 23% Montana 22% Georgia 22% Kentucky 22% Missouri 22% North Carolina 21% New Mexico 21% Kansas 21% Iowa 20% New York 20% Delaware 19% Virginia 19% Rhode Island 19% Arizona 18% Mississippi 18% Nebraska 18% Massachusetts 18% Maryland 18% Ohio 17% Illinois 16% California 16% Nevada 16% Alabama 16% New Jersey 15% Florida 15% Louisiana 15% Utah 13% Texas 11% South Carolina 11% Hawaii7%
- 10. 8 Birding in the United States: A Demographic and Economic Analysis There were more participants in the South (34 percent) compared to the rest of the United States (see Figure 1). The Midwest had the second highest participation at 24 percent. The West and Northeast had lower participation of 22 percent and 20 percent, respectively. Figure 1. Participation by Region of Residence: 2011 (Population 16 years of age and older.) West 22% 34% 24% 20% Midwest South Northeast Alaska Washington Idaho Oregon California Hawaii Nevada Utah Arizona New Mexico Colorado Wyoming Montana North Dakota Minnesota Iowa Wisconsin Ohio Kentucky Virginia Tennessee Georgia Illinois Missouri South Dakota Nebraska Kansas Oklahoma Arkansas Texas Alabama Indiana Louisiana Mississippi South Carolina North Carolina Florida West Virginia Delaware New Jersey Connecticut Rhode Island Massachusetts New Hampshire Vermont Maryland Pennsylvania Maine New York Michigan SteveMaslowski©
- 11. Birding in the United States: A Demographic and Economic Analysis 9 Bird watching by state residents tells only part of the story. Many people travel out-of-state to watch birds, and some states are natural birding destinations. Hawaii reaped the benefits of this tourism with 73 percent of their total birders coming from other states. Three other states (Alaska, Wyoming, and Maine) had more than 60 percent of their total birders coming from other states. (See Table 6.) USFWS Table 6. Birding by State Residents and Nonresidents: 2011 (Population 16 years of age and older. Numbers in thousands). State Total Birders Percent State Residents Percent Nonresidents Alabama 607 94% – Alaska 512 31% 69% Arizona 1,110 82% 18%* Arkansas 539 98% – California 4,864 94% 6% Colorado 1,188 85% 15% Connecticut 873 93% 7%* Delaware 171 80% – Florida 2,966 75% 25% Georgia 1,903 87% 13%* Hawaii 254 27% 73%* Idaho 419 81% 19%* Illinois 1,811 90% 10%* Indiana 1,175 99% – Iowa 531 89% – Kansas 476 95% – Kentucky 827 90% 10%* Louisiana 712 71% – Maine 689 38% 63% Maryland 934 84% 16%* Massachusetts 1,238 75% 25% Michigan 2,015 93% 7%* Minnesota 1,112 93% 7%* Mississippi 456 87% – Missouri 1,110 92% 8%* Montana 291 60% 40%* Nebraska 273 89% – Nevada 447 72% 28%* New Hampshire 527 55% 45%* New Jersey 1,195 87% 13%* New Mexico 415 78% 22%* New York 3,272 93% 7% North Carolina 1,854 84% 16% Ohio 1,583 97% – Oklahoma 773 97% – Oregon 892 79% 21%* Pennsylvania 2,699 89% 11% Rhode Island 201 80% 20% South Carolina 536 72% 28%* South Dakota 235 64% 36% Tennessee 1,382 82% 18% Texas 2,238 95% 5%* Utah 410 69% 31% Vermont 292 69% 31%* Virginia 1,425 81% 19%* Washington 1,516 83% 17%* West Virginia 547 88% – Wisconsin 1,678 89% 11%* Wyoming 417 31% 69% Note: A hyphen (–) denotes sample sizes that are too small to report reliably (9 or less). An asterisk (*) denotes an estimate based on a sample size of 10 to 29. This sample size criteria is consistent with the “2011 National Survey of Fishing, Hunting, and Wildlife-Associated Recreation.”
- 12. 10 Birding in the United States: A Demographic and Economic Analysis Where and What are They Watching? Backyard birding is the most prevalent form of birding with 88 percent of participants watching birds from the comfort of their homes. Thirty-eight percent of birders travel more than a mile from home to bird visiting both private and public lands. What kinds of birds are they looking at? Seventy-five percent of away-from-home birders reported observing waterfowl (ducks, geese, etc.), making those the most watched type of bird. Birds of prey (hawks, eagles, etc.) were also popular with 72 percent of birders watching them, followed in popularity by songbirds such as cardinals and robins (68 percent) and other water birds such as herons and shorebirds (60 percent). See Chart 8. Avidity All people identified as birders in this report said that they took an active interest in birds – defined as trying to closely observe or identify different species. But what is the extent of their interest? In order to determine their “avidity” the number of days spent bird watching was considered. Chart 8. Types of Birds Observed by Away-From-Home Birders: 2011 Total, all birders 100% Waterfowl 75% Birds of Prey 72% Songbirds 68% Other water birds* 60% Other birds** 38% * shorebirds, herons, etc. **pheasants, turkeys, etc. Table 7. National Birding Trends 2006 2011 Percent Change* Total Birders 47,693 46,741 –2% Around-the-home 41,821 41,346 –1% Away-from-home 19,860 17,818 –10%* Total Days 5,473,398 5,161,909 –6% Around the home 5,202,536 4,923,873 –5% Away-from-home 270,861 238,036 –12% Note: An asterisk denotes the change is significant at the 95% level. All other “percent changes” are not statistically significant. LavondaWalton/USFWS
- 13. Birding in the United States: A Demographic and Economic Analysis 11 Presumably because of the relative ease of backyard birding, birders around the home spent nine times as many days watching birds as did people who traveled more than a mile from home to bird watch. In 2011, the mean number of days for all birders was 110, for backyard birders it was 119, and for away-from- home birders it was 13. Avidity for all birders is shown in Chart 9. Although avidity is varied across the country, birders’ avidity in 11 States was higher than the national average. Most notably, Mississippi averaged 155 days per birder. Table 7 shows how avidity has changed from 2006 to 2011. The only change that is significant at the 95 percent level is “Total Away-from-Home Birders.” As shown, the number of away-from-home birders has decreased 10 percent as less birders are traveling to observe birds. Chart 9. Birding Avidity by State: 2011 (Population 16 years of age and older.) U.S. Average: 110 days ▼ Mississippi 155 days Connecticut 133 days Texas 132 days Ohio 130 days Arkansas 130 days Alabama 129 days Iowa 126 days Indiana 122 days Illinois 121 days New Mexico 116 days Idaho 114 days New York 110 days Kansas 109 days Rhode Island 108 days Delaware 108 days Georgia 108 days Missouri 106 days Michigan 105 days Tennessee 102 days Oregon 98 days Wisconsin 95 days Maryland 95 days Washington 95 days Nevada 93 days Florida 92 days Arizona 92 days Kentucky 92 days Oklahoma 91 days Massachusetts 91 days New Jersey 90 days Minnesota 87 days Louisiana 86 days Nebraska 86 days California 85 days Virginia 83 days North Carolina 81 days Vermont 77 days Montana 73 days West Virginia 72 days New Hampshire 71 days Pennsylvania 67 days South Dakota 67 days Maine 64 days Colorado 63 days South Carolina 60 days Utah 57 days Wyoming 42 days Hawaii 34 days Alaska 31 days Note: North Dakota is not included due to small sample sizes. USFWS
- 14. 12 Birding in the United States: A Demographic and Economic Analysis The Economics of Bird Watching Birders spend money on a variety of goods and services for their trip-related and equipment-related purchases. Trip-related expenditures include food, lodging, transportation, and other incidental expenses. Equipment expenditures consist of binoculars, cameras, camping equipment, and other costs. By having ripple effects throughout the economy, these direct expenditures are only part of the economic impact of birding. The effect on the economy in excess of direct expenditures is known as the multiplier effect. For example, an individual may purchase a bird house to enhance birding at home. Part of the purchase price will stay with the local retailer. The local retailer, in turn, pays a wholesaler who in turn pays the manufacturer of the bird houses. The manufacturer then spends a portion of this income to pay businesses supplying the manufacturer. In this sense, each dollar of local retail expenditures can affect a variety of businesses. Thus, expenditures associated with birding can ripple through the economy by impacting economic activity, employment, and household income. To measure these effects, a regional input-output modeling method1 is utilized to derive estimates for total industry output, employment, employment income, and tax revenue associated with birding. 1 The estimates for total industry output, employment, employment income, and federal and state taxes were derived using IMPLAN, a regional input-output model and software system. DavidHaggard/USFWS
- 15. Birding in the United States: A Demographic and Economic Analysis 13 Table 8 highlights birders’ trip-related and equipment-related expenditures in 2011.2 Birders spent an estimated $15 billion on their trips and $26 billion on equipment in 2011. For trip expenditures, 52 percent was food and lodging, 34 percent was transportation, and 14 percent was other costs such as guide fees, user fees, and equipment rental (Chart 10). Equipment expenditures were relatively evenly distributed among wildlife watching equipment (29 percent), special equipment (37 percent), and other items (30 percent) (Chart 11). Auxiliary equipment accounted for only 4 percent of all equipment expenditures. 2 The Survey does not have an expenditure category for birding. Therefore, expenditures are prorated by multiplying wildlife watching expenditures by a ratio to derive birding expenditures. For trip- related expenditures, the ratio includes only away-from-home birders and is (total number of away-from-home days watching birds)/(total number of away-from-home days watching wildlife). For equipment- related expenditures, the ratio includes both away-from-home birders and around- the-home birders. The equipment-related expenditure ratio is (total number of days watching birds)/(total number of days watching wildlife). Table 8. Trip and Equipment Expenditures for Birding by Category: 2011 Total Trip and Equipment Expenditures $40,942,680,033 Trip-Related Expenditures*, total $14,868,424,740 Food $4,625,942,734 Lodging $3,105,418,864 Transportation $5,084,858,642 Other $2,052,204,500 Equipment**, total $26,074,255,293 Wildlife-watching equipment $7,573,105,647 Auxilliary equipment $1,034,484,181 Special Equipment $9,534,331,263 Other Items $7,932,334,202 *Trip-related expenditures include food, drink, lodging; public and private transportation; and other trip-related costs such as guide fees, pack trip or package fees, public and private land use access fees, equipment rental, boating costs, and heating and cooking fuel. **Wildlife-watching equipment expenditures include: bird food, nest boxes, bird houses, bird baths, binoculars, cameras and camera equipment, photo processing, day packs, carrying cases, special clothing and other wildlife-watching items such as field guides and maps. Auxiliary equipment includes tents, tarps, frame packs, and backpacking equipment, and other camping equipment, and other auxiliary equipment such as blinds and GPS devices. Special Equipment includes big ticket items such as boats and boat accessories, campers, trucks, and cabins. Other items include land leasing and ownership, plantings, membership dues and contributions, and magazine books, and DVDs. Chart 10. Trip-Related Expenditures (Total Expenditures: $14.9 billion) Chart 11. Equipment Expenditures (Total expenditures: $26.1 billion) Food $4.6 billion 31% Wildlife-watching equipment $7.6 billion 29% Lodging $3.1 billion 21% Auxilliary equipment $1.0 billion 4% Transportation $5.1 billion 34% Special equipment $9.5 billion 37% Other $2.1 billion 14% Other items $7.9 billion 30% USFWS
- 16. 14 Birding in the United States: A Demographic and Economic Analysis Total Industry Output Table 9 lists the economic effect of bird watching expenditures in 2011. The trip and equipment expenditures of $41 billion in 2011 generated $107 billion in total industry output across the United States. Total industry output includes the direct, indirect, and induced effects of the expenditures associated with bird watching. Direct effects are the initial effects or impacts of spending money; for example, an individual purchasing a bird house is an example of a direct effect. An example of an indirect effect would be the purchase of the bird house by a retailer from the manufacturer. Finally, induced effects refer to the changes in production associated with changes in household income (and spending) caused by changes in employment related to both direct and indirect effects. More simply, people who are employed by the retailer, by the wholesaler, and by the birdhouse manufacturer spend their income on various goods and services which in turn generate a given level of output (induced effects). Employment and Employment Income Table 9 shows that birding expenditures in 2011 created 666,000 jobs and $31 billion in employment income. Jobs include both full-time and part-time jobs, with a job defined as one person working for at least part of the calendar year. Employment income consists of both employee compensation and proprietor income. Federal and State Taxes Federal and State tax revenue are derived from birding-related recreational spending. In 2011, $6 billion in State tax revenue and $7 billion in Federal tax revenue were generated. DaveMenke/USFWS Table 9. Summary of Economic Impacts Birders 46,741,000 Total Expenditures $40,942,680,000 Total Output $106,977,730,000 Jobs 666,000 Employment Income $31,391,977,000 State Tax Revenues $6,000,203,000 Federal Tax Revenues $7,089,387,000
- 17. Birding in the United States: A Demographic and Economic Analysis 15 Conclusion This report presented information on the participation and expenditure patterns of 47 million birders in 2011. Trip-related and equipment-related expenditures associated with birding generated nearly $107 billion in total industry output, 666,000 jobs, and $13 billion in local, state, and federal tax revenue. This impact was distributed across local, state, and national economies. USFWS
- 18. 16 Birding in the United States: A Demographic and Economic Analysis References MIG, Inc. IMPLAN System (2008 Data and Software). 1940 South Greeley Street, Suite 101, Stillwater, MN 55082. 2008. U.S. Department of the Interior, U.S. Fish and Wildlife Service, and U.S. Department of Commerce, U.S. Census Bureau. 2011 National Survey of Fishing, Hunting, and Wildlife- Associated Recreation. USFWS
- 20. U.S. Department of the Interior U.S. Fish Wildlife Service http://wsfrprograms.fws.gov December 2013 Coverphoto:SteveHillebrand/USFWS