1. Investment management
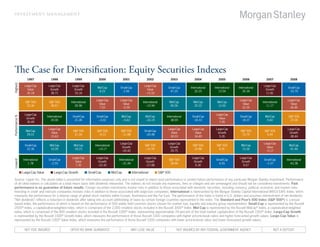
The Case for Diversification: equity securities Indexes
1997 1998 1999 2000 2001 2002 2003 2004 2005 2006 2007 2008
Highest
Large-Cap Large-Cap Large-Cap Large-Cap Large-Cap
Mid-Cap Small-Cap Small-Cap International International International Small-Cap
Value Growth Growth Value Growth
8.25 2.49 47.25 20.25 13.54 26.34 -33.79
35.18 38.71 33.16 –15.52 11.81
Large-Cap Large-Cap Large-Cap Large-Cap
S&P 500 S&P 500 International International Mid-Cap Mid-Cap Mid-Cap International
Value Value Value Value
33.36 28.57 26.96 –15.94 40.06 20.22 12.65 11.17
7.02 –5.59 22.25 -36.85
Large-Cap Large-Cap
International Small-Cap Small-Cap Mid-Cap Mid-Cap International Small-Cap Small-Cap Mid-Cap S&P 500
Performance %
Growth Value
20.00 21.26 –3.02 –5.62 –16.19 38.59 18.33 18.37 5.60 -37.00
30.49 7.05
Large-Cap Large-Cap Large-Cap Large-Cap Large-Cap
Mid-Cap S&P 500 S&P 500 S&P 500 Small-Cap S&P 500 S&P 500
Value Value Value Growth Growth
29.01 21.04 –9.12 –11.88 –20.48 15.79 5.49
15.63 30.03 16.49 5.26 -38.44
Large-Cap Large-Cap Large-Cap
Small-Cap Mid-Cap Mid-Cap International S&P 500 S&P 500 S&P 500 Mid-Cap Mid-Cap
Growth Growth Value
22.36 10.09 18.23 –14.17 –22.09 10.88 4.91 15.26 -41.46
–20.42 29.75 –0.17
Large-Cap Large-Cap Large-Cap Large-Cap Large-Cap
International Small-Cap International S&P 500 Small-Cap Small-Cap International
Lowest
Value Growth Growth Growth Growth
1.78 –2.55 –21.44 28.68 4.55 –1.57 -43.38
7.35 –22.42 –27.88 6.30 9.07
n Large-Cap Value n Large-Cap Growth n Small-Cap n Mid-Cap n International n S&P 500
Source: Lipper Inc. The above table is presented for information purposes only and is not meant to depict past performance or predict future performance of any particular Morgan Stanley investment. Performance
of all cited indexes is calculated on a total return basis with dividends reinvested. The indexes do not include any expenses, fees or charges and are unmanaged and should not be considered investments. Past
performance is no guarantee of future results. Foreign securities investments involve risks in addition to those associated with domestic securities, including currency, political, economic and market risks.
Investing in small- and mid-size companies involves risks in addition to those associated with large-size companies. International is represented by the Morgan Stanley Capital International (MSCI) EAFE Index, which
measures the performance for a diverse range of global stock markets within Europe, Australasia and the Far East. The performance of the index is listed in U.S. dollars and assumes reinvestment of net dividends.
“Net dividends” reflects a reduction in dividends after taking into account withholding of taxes by certain foreign countries represented in the index. The Standard and Poor’s 500 Index (S&P 500®) is a broad-
based index, the performance of which is based on the performance of 500 widely held common stocks chosen for market size, liquidity and industry group representation. Small-Cap is represented by the Russell
2000® Index, a capitalization-weighted index, which is comprised of the 2,000 smallest stocks included in the Russell 3000® Index. Mid-Cap is represented by the Russell Midcap® Index, a capitalization-weighted
index, which is comprised of the 800 smallest stocks included in the Russell 1000® Index, representing approximately 24 percent of the total market capitalization of the Russell 1000® Index. Large-Cap Growth
is represented by the Russell 1000® Growth Index, which measures the performance of those Russell 1000 companies with higher price-to-book ratios and higher forecasted growth values. Large-Cap Value is
represented by the Russell 1000® Value Index, which measures the performance of those Russell 1000 companies with lower price-to-book ratios and lower forecasted growth values.
NOT FDIC INSURED OFFER NO BANK GUARANTEE MAY LOSE VALUE NOT INSURED BY ANY FEDERAL GOVERNMENT AGENCY NOT A DEPOSIT