Downloaded 61 times

![Amazon is #1 in Europe and in the US with a
revenue of US$136 billion in 2016
4
Industry Insights
Amazon revenue development from foundation to 2016 in million US$
Source: Company information
1 61014816
2016
135,987
2015
107,006
2014
88,988
2013
74,452
2012
61,093
2011
48,077
2010
34,204
2009
24,509
2008
19,166
2007
14,835
2006
10,711
2005
8,490
2004
6,921
2003
5,264
2002
3,933
2001
3,122
2000
2,762
1999
1,640
1998199719961995
Mission statement:
‘Earth’s biggest book store’
Vision statement:
‘Our vision is to be earth's most
customer centric company […]’](https://image.slidesharecdn.com/e-commercechinavsuswhitepaper2017-180207112419/85/e-Commerce-China-vs-the-US-4-320.jpg?cb=1518002828)
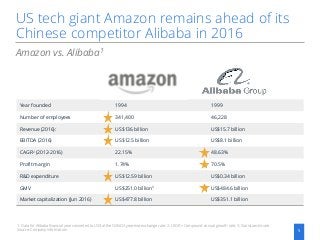
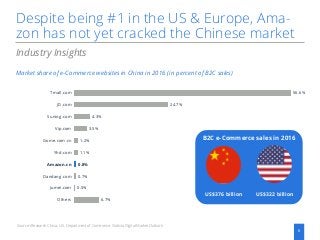


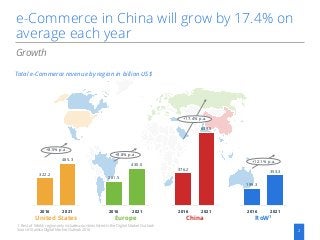
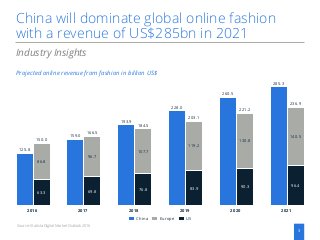
This whitepaper provides an insight into the e-Commerce market and its performance in China and the US and also includes a comparison of Amazon and Alibaba. Key Takeaways: • e-Commerce in China will grow by 17.4% on average each year; growth in the US will be significantly smaller • China will dominate the global online fashion market with a revenue of more than US$285bn in 2021 • Amazon is#1 in Europe and in the US with a revenue ofUS$136 billion in 2016 • US tech giant Amazon remains ahead of its Chinese competitor Alibaba in 2016 • Despite being #1 in the US & Europe, Amazon has not yet cracked the Chinese market


