SlideShare a Scribd company logo
1 of 23
Download to read offline
Concern Worldwide/Nutrition Survey, Dowa, 17th
to 25th
of February, 2004 1
Concern Worldwide Nutrition Survey1,
Dowa District, Malawi
Final Draft
Authors:
Alem Hadera Abay, Nutritionist, Concern Worldwide
Ken Chilingulo, Data Manager, Concern Worldwide May 2004
1 This survey was funded by ECHO
Concern Worldwide/Nutrition Survey, Dowa, 17th
to 25th
of February, 2004 2
TABLE OF CONTENTS
EXECUTIVE SUMMARY .................................................................................................... 4
Acute Malnutrition: ........................................................................................................... 4
Mortality and Orphan hood:............................................................................................ 5
Immunization:.................................................................................................................... 5
Chronic Malnutrition and Household Economy:.......................................................... 5
INTRODUCTION .................................................................................................................. 6
Background:...................................................................................................................... 6
Survey Objectives:........................................................................................................... 6
METHODOLOGY ................................................................................................................. 6
Survey Design: ................................................................................................................. 6
Sampling Procedure:....................................................................................................... 7
Training and Field Testing: ............................................................................................. 7
Selection of Villages, Households and Children: ........................................................ 7
Data Collected:........................................................................................................................ 7
Children Anthropometric Questionnaire: ...................................................................... 7
Mortality Questionnaire: .................................................................................................. 7
RESULTS AND DISCUSSION............................................................................................. 8
Distribution of the Sample by Age and Sex: ................................................................ 8
Under-five Children Nutritional Status: ......................................................................... 8
Chronic Malnutrition:...................................................................................................... 11
Immunization:.................................................................................................................. 12
Mortality: .......................................................................................................................... 13
Household Food Security:............................................................................................. 13
CONCLUSION..................................................................................................................... 14
RECOMMENDATIONS...................................................................................................... 15
Annex 1: Summary of Findings of the DOWA Nutrition Survey, February 2004 . 16
Annex-2: Forms used for data collection.................................................................... 18
Annex 3: Maps of DOWA Showing Selected Clusters (VH), February, 2004 ...... 22
LIST OF TABLES AND FIGURES
Table 1 Major findings of nutrition, morbidity, mortality, household level food security
conditions in, February, 2004
Table-2 Trends of Acute Malnutrition and Children Under-five Mortality in Dowa District
Table 3 Distribution by age and sex of sample, Dowa District
Table 4 Prevalence of acute malnutrition based on weight for height z-score
Table 5 Cross-tables of MUAC and WHZ among Children Under-five in Dowa District
Table 6 Prevalence of Selected Childhood Illnesses in Dowa District
Figure-1 Trends of Acute Malnutrition & U5MR in Dowa District
Figure-2: A graph showing the Sensitivity and Specificity of MUAC
Figure 3 HAZ Comparisons of Dowa and Reference Children
Figure 4 WAZ Comparisons of Dowa and Reference Children
Figure 5 Causes of Under-five Mortality in Dowa District, February 2004
Concern Worldwide/Nutrition Survey, Dowa, 17th
to 25th
of February, 2004 3
ACRONYMS
BCG Bacille Callmette Guerin(Vaccine for tuberculosis)
CHAM Christian Health Association of Malawi
CI Confidence Interval
CMR Crude Mortality Rate
CTC Community Therapeutic Care
DHO District Health Office
DHS Demographic and Health Survey
EPI Extended Programme on Immunization
GAM Global Acute Malnutrition
GVH Group Village Headman
HAZ Height-for-Age Z-score
HAS Health Surveillance Assistant
HH Household
IMR Infant Mortality Rate
MoHP Ministry of Health and Population
NGO Non Governmental Organization
DOWA Dowa
NSO National Statistics Office
RR Risk Ratio
RTI Respiratory Tract Infection
SAM Severe Acute Malnutrition
U5MR Under 5 Mortality Rate
UNICEF United Nations Children Fund
WAZ Weight for Age Z-score
W/H Weight for Height
WHZ Weight for Height Z-score
WHO World Health Organization
Concern Worldwide/Nutrition Survey, Dowa, 17th
to 25th
of February, 2004 4
EXECUTIVE SUMMARY
Dowa district is located in the Central region of Malawi with a total population of 469,924 as per the
1998 Malawi Population census. The district is considered one of the most densely populated and
food insecure districts in the region. A joint nutrition survey team composed of HSAs and nurses
from MoHP, CHAM and Concern Worldwide conducted a 30x30 cluster nutrition survey from 17th
to
25th
of February, 2004 in Dowa District Central Region of Malawi. The survey team has collected
anthropometric, household food security, mortality and morbidity data using a structured
questionnaire. Table 1 indicates the major finds of this survey and the detailed data analysis is
found in annex 1.
Table-1: Major findings of the nutrition, morbidity, mortality and household level food
security conditions in, February, 2004
INDICATORS PROP 95% CI n
Under-five Children Nutritional status indicators:
Global acute malnutrition (WHZ) 2.6% 1.4% - 4.7% 951
Severe acute malnutrition (WHZ) 0.7% 0.2% - 2.2% 951
Global acute malnutrition WH percentile median 2.1% 1.1% - 3.9% 951
Sever acute malnutrition WH percentile median 0.7% 0.2% - 2.2% 951
Weight-for-Age(underweight) 30.5% 26.4% - 34.9% 951
Height-for-Age(stunting) 61.2% 56.6% - 65.6% 951
Prevalence of Oedema 0.6% 0.2% - 2.0% 951
Mean weight-for-Height z-score -0.08 -0.14 to 0.02 951
Demographic, Morbidity, Mortality Orphanhood Indicators
% of children under-five 21.2% 19.5% - 22.9% 951
Percent household practicing Polygamy 15.5% 12.4% - 19.1% 951
Under-five morbidity 62.3% 57.7% - 66.6% 951
Under-five Mortality Rate (10,000/day) 0.46 0.07 - 1.66 962
Crude Mortality Rate(10,000/day) 0.22 0.06 - 0.51 4544
Orphanhood 1.1% 0.4% - 2.6% 951
Vaccination coverage indicators
Measles vaccination 78.4% 74.4% - 82.0% 951
BCG vaccination 95.8% 93.5% - 97.3% 951
Vitamin A supplementation 79.4% 75.4% - 82.9% 951
Household Food Security and water and sanitation indicators:
% HHs reported maize as staple food in Pre-harvest(Feb/’04) 96.9% 91.7% - 99.0% 257
% HHs that reported maize as staple in Post-harvest(July/’03) 99.6% 95.7%- 100.0% 257
% HHs that maintained maize as staple in Pre-harvest 96.4% 91.2% - 98.8% 256
% HHs that shifted from maize to cassava in pre-harvest 3.1% 1.0% - 8.3% 256
% HHs reported using Wild Food in pre-harvest(Feb/’04) 15.6% 10.0% - 23.3% 257
% HHs with radio ownership 52.1% 43.2% - 61.0% 257
% HHs with ox-cart ownership 8.2% 4.3% - 14.7% 257
% HHs with bicycle ownership 43.2% 34.6% - 52.2% 257
% HHs that owned chicken 56.8% 47.8% - 65.4% 257
% household with goat 34.2% 26.2% - 43.2% 257
% household with cow 6.2% 2.9% - 12.3% 257
Average family meal per day 2.04 2.0% - 2.1% 257
% Unprotected well as a major water source 20.2% 13.9% - 28.4% 257
% HHs accessing water from protected source 73.2% 64.5% - 80.4% 257
% HHs with out toilet facilities 11.7% 6.9% - 18.8% 257
% HHs using soap in the past month 86.0% 78.5% - 91.3% 257
Acute Malnutrition:
The current level of global (2.6%) and severe (0.7%) acute malnutrition as in Figure-1 were lower
compared to global (4.5%) and severe (1.1%) acute malnutrition in January 2003. The difference in
the global acute malnutrition rates was statistically significant (See Table-2). This could be due to
the decentralized Community Therapeutic Care (CTC) programme, which addressed acute
malnutrition since August 2002 and the good harvest in 2003 harvest. The CTC programme in
Dowa encompassed biweekly targeted take home supplementary feeding for moderately
malnourished children and pregnant and lactating mothers, outpatient therapeutic care for non-
Concern Worldwide/Nutrition Survey, Dowa, 17th
to 25th
of February, 2004 5
complicated severely malnourished children on a weekly check-up visits in 17 nearby health centres
and inpatient therapeutic care for severely malnourished children with complications in 3 NRUs.
The level of global acute malnutrition during this year hunger period in a country with one farming
season is not alarming; however the level of severe acute malnutrition is proportionally higher
compared to the level of global acute malnutrition. As can be seen from Table-1, this could be due
to other factors such as high prevalence of illnesses among children under-five (62.3%), significant
number of households accessing their water from unprotected source (26.8%) and poor hygiene
14.0% have reported to be unable to use soap in the past month and 11.7% with no toilet facilities.
Table-2: Trends of Acute Malnutrition and Children Under-five Mortality in Dowa District
Indicators
6 – 59 Months
Jun-Jul 2002
(95%C. I.)
Jan 2003*
(95%C. I.)
Feb 2004*
(95%C. I.)
P-value*
Global Malnutrition
Z score < -2/oedema
3.8%
(2.3% - 5.3%)
4.5%
(2.6% - 6.4%)
2.6%
(1.4 – 4.7) <.05
Severe Malnutrition
Z score < -3/oedema
1.0%
(0.1% - 1.8%)
1.1%
(0.1% - 2.0%)
0.7%
(-0.1 – 1.0) NS
Under-five Mortality
Per 10,000/day
1.18 1.57
(0.99 – 2.15)
0.46
(0.07 – 1.66) <.05
- P-value less than 0.05 indicate a statistical significant difference between the two periods.
Mortality and Orphan hood:
Crude and under-five child mortality rates were 0.22 per 10,000 per day and 0.46 per 10,000 per
day, which is low compared to the same period under-five mortality rate of 1.57 per 10,000 per day
last year. This could be perhaps due to the decentralized management of acute malnutrition using
the CTC approach. The prevalence of Orphanhood (1.1%) was low compared to Nkhotakota district
(4.8%). With this rate, about 1,100 children under-five are estimated to be orphans in Dowa district
based on the projected district population figure of 469,924.
Morbidity:
Overall prevalence of childhood illness (62.3%) is very high with fever and diarrhoea contributing to
35.1% and 15.9% of the childhood illnesses respectively(See Table 6). Generally there is a
seasonal increase in febrile and diarrhoeal diseases during the period of the survey.
Immunization:
Vaccination and vitamin A supplementation are currently good in the district. As in Table 1 and
Annex 1 BCG, measles and vitamin A supplementation coverage are 95.8%, 78.4% and 79.4%
respectively. The success of the immunization programme is due, perhaps, to the decentralized
modality of service provision using existing primary health structures. We can capitalize on the
efforts accrued thus far by immunization programmes if we are able to integrate health service
delivery such as EPI plus and delivery of essential drugs with decentralized management of acute
malnutrition.
Chronic Malnutrition and Household Economy:
Stunting (61.2%) and underweight (30.5%) rates are very high indicating extreme level of poverty
that prevails in the district. These results are consistent with the high prevalence of childhood
illnesses, inadequate dietary intake and HH level food insecurity indicators found in the district
including 1) Poor Dietary Intake: About 64.6% of young children eat their meal once or twice per
day. 2) Childhood Illness: More than half of under-five children suffer one or more ailments in the
past two weeks period 3) Ownership of assets: 56.8% of HHs reported having chickens, 6.2%
cows, 16.3% pigs, 8.2% ox-cart and 20.2% of respondents having no shoes. 4) Water and
sanitation: 26.8% of HHs access water from unprotected source and 11.7% of HHs are without a
toilet facility.
There was no indication that there was alarming levels of acute malnutrition that could be
considered as emergency. However, there was a seasonal food stress which most households are
coping by resorting to market. About 51.0% of households sourced their staple (maize) from the
market. However, the seasonal (‘normal’) food stress is evident by the fact that 65.2% of households
Concern Worldwide/Nutrition Survey, Dowa, 17th
to 25th
of February, 2004 6
are buying their staple by entering in to ‘Ganyu’ labour and 16.7% of young children eating one meal
per day. On the other hand, a significant number of households considered the prospects of the next
harvest as precarious, that is, 23.3% of households expect to source their staple from market and
exchange in the coming three months.
INTRODUCTION
Background:
Dowa district is located in Central region of the Malawi, bordered by Lilongwe in the South, by
Kasungu in the north, Ntchisi and Salima in the east. The administrative center Dowa Boma is
located some 52 km from Lilongwe the capital and covers an area of 2,770 sq km (Dowa District
Socio-economic Profile, 2002). It is further divided into 7 Traditional Authority (TAs), namely Dzoole,
Mkukula, Kayembe, Chakhaza, Mponela, Chiwere and Msakambewa (see map in annex 2). The
population is 469,924 as per the projections of the NSO 1998 census; with a population density of
135 persons per km2
making it the one of the most densely populated district in the central region
whose average is 114 persons per km2
. The population annual growth rate is estimated at 3.55%
greater than the 1.98% national average2.
People in the district mainly depend on agriculture with a limited contribution from livestock (See
Annex-1 for livestock ownership). There are two seasons; wet and dry seasons. The wet season
occurs between November and April/May and the dry season between May to October. The main
food crops produced in the district are maize, cassava, sweet potatoes, Irish white potatoes,
groundnuts, beans, Soya beans, leaf vegetables and fruits like oranges and bananas and the main
cash crops are tobacco, paprika and legumes3. DOWA is considered as one of the poorest districts
in the central region with 49.8% of HHs living below the average national poverty line (NSO and
IFPRI, 2002). Concern Worldwide began work in 2002 in response to the food crisis with two
programmes, namely general food aid and community therapeutic care (CTC) to address special
nutritional needs of vulnerable groups. The food aid programme was phased out in 2003 following
what is considered to be a relatively good harvest. The CTC programme has been operational to
date and was designed to manage acute malnutrition in 17 health centres and 3 NRUs currently
implemented by MoH and CHAM partners.
Survey Objectives:
• Determine prevalence of acute malnutrition for children 6-59 months across district.
• Determine prevalence of chronic malnutrition for children 6-59 months across district.
• Determine mortality rates and major causes of death in children under-five across district with in
a period of 3 months.
• Determine morbidity patterns among children under-five years of age.
• Help in programme planning, monitoring and implementation.
METHODOLOGY
Survey Design:
A cross-sectional 30x30-cluster survey was conducted between 17h
and 25th
February, 2004 in
Dowa district by Concern Worldwide in collaboration with Dowa DHO and CHAM. The tools
employed to collect data in this survey, as per the Malawi Nutrition survey guideline, include
anthropometric, household food security and mortality questionnaires. Some modifications were
made to the household food security questionnaire to suit the objectives of this survey. The group
village headman was the smallest administration unit where population figures could be found at
district level. A two stage cluster survey was used based on a population sampling frame of 227
GVH. Thirty clusters were randomly selected by assigning probability proportional to population size.
All data was analyzed using the EPI6 software and EPINUT. Flagged records that could not be
cleaned by rechecking the data collection format were excluded from analysis.
2 Based on the 1998 population census report by NSO.
3 Dowa District Socio Economic Profile, December 2003, Decentralization Office.
Concern Worldwide/Nutrition Survey, Dowa, 17th
to 25th
of February, 2004 7
Sampling Procedure:
Based on the population figure by GVH obtained from the DHO, the cumulative population was
calculated and a sampling interval determined for the under-five children population which is
estimated at 20% of the total population. Thirty clusters were randomly selected by assigning
probability proportional to population size. A total of 960 children under-five were measured for
anthropometry (30 clusters constituting 32 children per cluster), out of which 9 records were flagged
and excluded from analysis, leaving a total of 951 children as a sample size for the anthropometric
survey. The sample size for the mortality survey was 900 HHs, corresponding to 4,544 individuals.
Each household regardless of the presence of children under-five was interviewed using the
mortality questionnaire.
Training and Field Testing:
One-day refreshment training was provided to enumerators from the DHO, CHAM, and Concern
staff by Concern Worldwide nutritionist. A total of 6 teams composed of 5 members, including: team
leader, registrar, interviewer and two measurers, were also given half day practical training in near
by village.
Selection of Villages, Households and Children:
A village headman was selected randomly from a list of villages within a GVH and the centre of the
village was located as the starting point. A direction was selected randomly by spinning a pen and
houses in this direction to the end of the village were counted. One house was randomly selected
and every subsequent household to the right direction of the first household was visited. If the edge
of the village was reached before 30 children had been measured, the team returned to the centre
and again selected a random direction. Mothers or any adult member of the household were
interviewed. Those aged six to fifty-nine months were then measured. Where feasible, absent
children were followed up with a second visit. All children meeting the inclusion criteria in the final
household were measured.
Data Collected:
Children Anthropometric Questionnaire:
• Age Children aged 6 - 59 months were then measured. In the absence of a card mothers
verbal report was taken.
• Weight 25kg Salter spring scale used, weight recorded to the nearest 100g.
• Height Children <85cm measured lying down. > 85cm in standing position. Height was
recorded with 0.1cm precision.
• Oedema Only bilateral oedema was considered to be an indicator of malnutrition. Oedema
was diagnosed by applying medium thumb pressure on the front of both shin or the upper side
of the foot, for 3 seconds. Oedema was diagnosed if a bilateral depression remained after the
pressure was released.
• Weight Height Median Assessed using tables after each team arrived from field. All
severely malnourished individuals were referred to nearest health centre, clinic or NRU where
possible. Moderately malnourished individuals referred to Concern SFP where possible. Where
referral was not possible teams offered some advice to the family on the status of the child and
the need for additional appropriate nutrition.
• Vaccination Respondents were asked to bring vaccination cards of the indexed child
and in the absence of a card verbal confirmation were sought.
• Morbidity Respondents were asked if their child had suffered from any of the listed symptoms
in the last 2 weeks.
• Breast Feeding Respondents asked if the indexed child is currently on breast feeding.
• Feeding Programme Respondents were asked if the indexed child in currently enrolled in
any of the following feeding programme; NRU, OTP, SFP, GR and other external feeding
arrangements for the child.
• Orphan hood Respondents asked if one or both parents of indexed child have deceased.
Mortality Questionnaire:
• No. of individuals in the household - After discussion with the survey teams on local norms
and practices it was decided that this would be defined as the number of people who ‘normally’
share meals in the house and have done so for over 1 month period.
Concern Worldwide/Nutrition Survey, Dowa, 17th
to 25th
of February, 2004 8
• Retrospective mortality (under 5 and total population) The total number of deaths during the
previous 3 months was recorded retrospectively for all households and then the number of
deaths of under 5’s recorded separately. Cause of death was recorded for under-5 deaths if
known.
• Household Food Security Questionnaire: Qualitative and quantitative information was
collected on the current and future food security situation, asset ownership, coping mechanisms
and water and sanitation conditions in the District. Data was collected, at every 4th household
visited.
• Quality Control: The quality of the survey was maintained by undertaking comprehensive
training and field practice of the survey teams. Field Supervision visits provided a further check
on procedures. All data sheets were checked at the end of the cluster by team leaders and at
the end of the day by the survey supervisor. All flagged data were checked for errors of data
entry by cross checking with the original record sheets and those that can not be cleaned were
excluded from analysis.
RESULTS AND DISCUSSION
Distribution of the Sample by Age and Sex:
As in Table 3, the sex distribution in the sample is more or less evenly distributed with a sex ratio of
0.94. The older age group (54 to 59) is less represented in the sample which typically happens in
cluster nutrition surveys.
Table 3: Distribution by age & sex of sample, Dowa District, Central Region Malawi
AGE CLASS BOYS GIRLS TOTAL SEX RATIO
N % N % N %
06-17 112 50.7% 109 49.3% 221 23.2% 1.03
18-29 109 44.5% 136 55.5% 245 25.8% 0.80
30-41 107 46.9% 121 53.1% 228 24.0% 0.88
42-53 100 51.8% 93 48.2% 193 20.3% 1.08
54-59 34 53.1% 30 46.9% 64 6.7% 1.13
TOTAL 462 48.6% 489 51.4% 951 100.0% 0.94
Under-five Children Nutritional Status:
Acute Malnutrition:
The prevalence of global acute malnutrition in Dowa district was estimated at 2.6 % with 95% CI
between 1.4% and 4.7%. The mean WHZ was -0.07 which is lower than the Nkhotakota district (-
0.20) and the difference between the two means is significant at P < 0.004. As can be seen in
Figure-1 there was also a significant decline in global acute malnutrition compared to 2003 at the
same period but the decline in severe acute malnutrition was not found to be statistically significant
(See also Table 2) .
Concern Worldwide/Nutrition Survey, Dowa, 17th
to 25th
of February, 2004 9
Figure-1 Trends of Acute Malnutrition & U5MR in Dowa District
0
0.5
1
1.5
2
2.5
3
3.5
4
4.5
5
Jun-Jul 2002 Jan 2003* Feb 2004*
GAM
SAM
U5MR
The prevalence of global and severe acute malnutrition in the age group less than 29 month of age
was higher indicating the early weaning period and its associated risks (See Table 4). The
prevalence of GAM in the age group between 6 to 29 months was found to be 3.2% (95% CI: 1.4%-
6.7%) and SAM was1.1% (95% CI: 0.2%-3.7%). The only visible difference between the two districts
was the fact that Dowa has a decentralized CTC programme covering the entire district and NKK
have no such decentralized programme at the time of the survey and perhaps there might be also
other factors related to food security and health contributing for such difference. Concern Worldwide
and VALID experience in Dowa shows that such levels of acute malnutrition can be address on a
long-term basis with in the existing primary health care structures. Thus, there is a need to continue
the long-term management of acute malnutrition through the existing DHO and CHAM structures.
However, there were challenges faced in the road to wards sustainable management of acute
malnutrition including lack of resources at the DHO level, vigilance of primary health workers to take
up nutrition as their routine duties, different expectations in the programme which started as NGO
lead emergency response and the slow process to evolve in to a long-term community-based
nutrition programme.
According to the WHO classification of severity of acute malnutrition4, GAM of less than 5% is
considered acceptable and hence the nutrition condition in Dowa is within an acceptable range. But
the difficulty in using such classification is that, it does not take in to account the proportional
disparity in the prevalence of oedema. It is known that oedema is strongly associated with high risk
of mortality and the WHO classification does not indicate the degree or cut-off point at which
nutrition interventions geared at management of severe acute malnutrition are deemed necessary.
In deed it is very difficult to come up with one figure as a cut of point which could be applicable to
different context and scenarios. Moreover, the WHO classification does not take in to account the
specific root causes of malnutrition in every context. The WHO classification is useful in an
emergency context to initiate rapid response but not in a context of chronic poverty like Malawi with
> 60% of households living below a poverty line.
In Malawi there is a trend of higher level of SAM compared to GAM levels. Unlike many countries,
most surveys in Malawi have reported proportionally higher rates of SAM and that also most of the
SAM cases are oedematous (Consolidated National Nutrition Survey Report, April-May 2003,
UNICEF). This need, however to be further explored and it might possibly hints to the aetiology of
oedema. Precluding oedema from the classification of severity of malnutrition in a country where
most severely malnourished children are oedematous (85.7% of the sample children in this survey
in Dowa were oedematous) limits addressing acute malnutrition on a long-term basis and hence
reducing infant and child mortality.
4 The management of nutrition in major emergencies, WHO, 2000.
Concern Worldwide/Nutrition Survey, Dowa, 17th
to 25th
of February, 2004 10
Such a disparity between severe and moderate acute malnutrition in Dowa might be due to the high
prevalence of childhood illnesses (62.3%) such as diarrhoeal disease (15.9%), febrile including
malaria (35.1%) and possibly HIV/AIDS and perhaps due to extreme dependency of households on
starch diet like maize (96.9%) with little input from animal diet such as milk and milk products.
Overall, the current global acute malnutrition rate (2.6%) in Dowa was lower compared to
neighbouring district survey results in February 2004 in Nkhotakota (3.4%) by Concern Worldwide
and in 2003 (3.9% in Lilongwe and 3.2% in Dedza districts) by interagency survey compiled in the
Consolidated National Nutrition Survey Report by UNICEF.
Table 4 Prevalence of acute malnutrition based on weight for height z-score
Severe Moderate Normal
<-3 STD >=-3&<-2 STD >=-2 STD OEDEMA
Age N n % n % n % n %
06-17 221 0 0.0% 6 2.7% 214 96.8% 1 0.5%
18-29 245 1 0.4% 4 1.6% 237 96.7% 3 1.2%
30-41 228 0 0.0% 6 2.6% 221 96.9% 1 0.4%
42-53 193 0 0.0% 2 1.0% 190 98.4% 1 0.5%
54-59 64 0 0.0% 0 0.0% 64 100.0% 0 0.0%
TOTAL 951 1 0.1% 18 1.9% 926 97.4% 6 0.6%
The prevalence of acute malnutrition in Dowa using MUAC was estimated at 18.3 %( See Table 5)
compared to 2.6% using weight-for-height z-score. Such a big difference will have an impact on
programme design, mobilization of resources, managing and monitoring the programme. MUAC
was used as one of the admission criteria in to the CTC programme and it is important to review the
validity of this indices
The data in this survey indicates the sensitivity (the ability of a test to detect true positives) and
specificity (the ability of a test to detect true negatives) of MUAC to be 64.0% and 82.3%
respectively assuming WHZ as golden criterion (See Table-5 below). This data supports the use of
MUAC for screening at community levels using trained volunteers to identify majority of mothers
who needs to stay at home(true negatives) and significantly minimize the disappointments of
mothers whose children were unable to be admitted in to the programme using the golden standard.
Some mothers do not understand why their own child is not admitted in to the programme especially
when the mothers think the criteria of admission is poverty status. It is very difficult to convince poor
mothers who travel an average of 20 kilometres that her child could not be admitted to the
programme because the weight of the child is not as low as the few ones admitted to the
programme. Concern Worldwide encourages screening mothers by volunteers using MUAC tape if
possible before they come to the health centre but sustaining volunteer motivation in the district has
proven to be a challenge.
Table 5 Cross-tables of MUAC and WHZ among Children Under-five in Dowa District
MUAC WHZ score
< -2 z-score/Oedema >= -2 z score/no oedema
Total
< 13 cm 16
9.2%
64.0%
158
90.8%
17.1%
174
18.3%
>= 13 cm 9
1.2%
36.0%
768
98.8%
82.9%
777
81.7%
Total 25
2.6%
926
97.4%
951
100%
However, the decision whether to use MUAC as admission criteria depends on the nature of every
context; Infant and child mortality rates, distance mothers have to travel to the distribution site and
Concern Worldwide/Nutrition Survey, Dowa, 17th
to 25th
of February, 2004 11
availability of resources. The data here shows positive correlation between MUAC and WHZ (See
Figure-3) with Pearson correlation of r=0.71. In general the trend of the data indicates that there a
need to use MUAC as screening criterion and carefully review its use as admission and discharge
criteria. In an area where there is high infant and child mortality the benefit of using MUAC as
admission criteria might outweighs especially in famine and disease outbreak situations.
Figure-2: A graph showing the Sensitivity and Specificity of MUAC
Chronic Malnutrition:
Stunting levels is very high in Dowa district with prevalence of height-for-age being 61.2%, which is
higher than the national prevalence of 49.0% (DHS, 2000). As in Figure 4, the curve for the sample
children significantly deviates to the left from the reference children indicating high levels of stunting
n the district. Similarly, the prevalence of underweight was 30.5%, which is higher than the national
average of 25.4%(DHS, 2000).
Consistent with this high level of stunting the district is characterized by food insecurity and poverty
at household level. Ownership of assets such as livestock is extremely low making the household
very vulnerable during a hunger season or when a shock occurs. The contribution of livestock to
household economy in very minimal; only 5.4%, 6.2%, 16.3% and 34.2% of households own oxen,
cow, pig and goat respectively.
The high prevalence of chronic malnutrition in Dowa district requires a concerted effort of
addressing root causes of poverty in the district. According to the 2002 NSO and IFPRI Malawi
Poverty mapping survey, 49.8% of the people in Dowa live below the poverty line. Efforts to reduce
and control childhood illnesses and extreme poverty have to go hand in hand with management of
acute malnutrition in order to improve the wellbeing of the people in the district.
MUAC
20
18
16
14
12
10
8
6
4
WHZ
3
2
1
0
-1
-2
-3
-4
r =.71
‘True Positives’:
Mal. cases by
both indicators
‘False Positives’:
Mal. cases by
MUAC only
Concern Worldwide/Nutrition Survey, Dowa, 17th
to 25th
of February, 2004 12
Figure-3: HAZ Comparisons of Dowa & Figure-4: WAZ Comparisons of Dowa &
Reference Children Reference Children
Figure-4: HAZ Comparisons of Dowa
and Reference Children
-5
0
5
10
15
20
25
-4.75
-4.25
-3.75
-3.25
-2.75
-2.25
-1.75
-1.25
-0.75
-0.25
0.25
0.75
1.25
1.75
2.25
2.75
3.25
3.75
4.25
Z-score
Proportion
Reference Sex Combined
Boys Girls
Figure-5: WAZ Comparisons of
Dowa and Reference Children
-5
0
5
10
15
20
25
-4.75
-4.25
-3.75
-3.25
-2.75
-2.25
-1.75
-1.25
-0.75
-0.25
0.25
0.75
1.25
1.75
2.25
2.75
3.25
3.75
4.25
Z-score
Proportions
Reference Sex Combined
Boys Girls
Morbidity:
The overall prevalence of childhood illness (62.3%) was high in Dowa indicating the need to address
febrile (35.1%), diarrhoeal illnesses (15.9%) and respiratory tract infections (7.5%). Generally there
is a seasonal increase in febrile and diarrhoeal diseases during the period of the survey. This seems
however inconsistent with the low prevalence of mortality found in the district and this could be
attributed to the decentralized services of CTC and its significant impact in reducing child mortality.
Morbidity among children under-five was significantly related with global acute malnutrition and
underweight in DOWA. The association between diarrhoea and WHZ was significant at p<0.005 with
RR of 2.98, which means children in Dowa district with diarrhoea were 3 times more likely to be
wasted than children with no diarrhoea. The high prevalence of diarrhoeal illnesses could be due to
water and sanitation problems, poor hygienic and child care practices. About 27%% of HHs reported
sourcing their water from unprotected sources like river, lake, untreated tanker and unprotected well,
and also about 36% of households use unsanitary toilet system such as bush and uncovered toilet
or pits.
Table 6: Prevalence of Selected Childhood Illnesses in Dowa District, Malawi, 2004
Type of Illnesses Prevalence 95% CI DHS 2000
n=949 Central Region
Fever 35.1% 30.9% - 39.6% 43.6%
RTI 7.5% 5.2% - 10.0% -
Diarrhoea 15.9% 12.8% - 19.5% 9.1%
Others 10.4% 7.9% - 13.6% -
Overall morbidity: 62.3% 57.7% - 66.6% -
Immunization:
Immunization coverage for polio (93.0%), BCG (95.8%), measles (78.4%) and vitamin A (79.4%)
were higher than the central region prevalence of 73.8%, 90.4%, 76.9% and 65.4% respectively.
Moreover, 80.7% of HHs have shown vaccination card on request. This is high compared to 75.0%
who showed vaccination card during 2000 Demographic & Health Survey. The success of
immunization plus is perhaps in the relentless effort to decentralized EPI services, which is
logistically very complex. We can capitalize on the efforts accrued by immunization programmes if
we are able to integrate health service delivery with decentralized management of acute malnutrition
using the existing structures.
Concern Worldwide/Nutrition Survey, Dowa, 17th
to 25th
of February, 2004 13
Mortality:
Mortality rates did not signify a crisis situation according to a USAID classification5. CMR as per the
method used in emergency assessment (i.e. using cluster sampling expressed in number of deaths
per 10,000 per day) was 0.22 deaths per 10,000 people per day. Similarly, Under-five Mortality Rate
in DOWA was 0.46 per 10,000 per day, which is below the average for developing countries
reported by USAID that is 1 death per 10,000 people per day.
As in Table-2, Under-five Mortality rate has significantly declined from 1.57/10,000 in January 2003
to 0.46/10,000 in February 2004. This is perhaps due to the highly decentralized management acute
malnutrition put in place using the CTC approach since July 2003 and also improved harvest during
2003. The CTC programme encompasses, in addition to the distribution specially design food for the
severely and moderately malnourished children, a wide range of activities including distribution of
routine drugs such as antibiotic, de-worming and micronutrient supplements and health education
session focusing on the top causes of childhood morbidity and mortality in the programme area.
These activities managed to maintain a very low mortality levels in the outpatient and inpatient
therapeutic care. The mortality rate in the outpatient therapeutic care programme (OTP) at the time
of the survey was 2.6% which is below the SPHERE minimum standard indicator of < 10%.
Pelletier,1994 in his study indicated that malnutrition as an underlying factor contribute to more than
50% child mortality in about 28 developing countries selected for the study including Malawi. Thus
the need for sustainable management of malnutrition side by side with other child survival
programmes such as EPI and manage acute malnutrition on a sustainable basis is greater than
ever. Despite the improvement attained thus far in other child survival programmes nutrition is totally
neglected and seem to have no clear structure and owner in the existing government structures. It
has been indicated in the UNICEF 2003 annual review that “nutrition is everywhere but no where”.
Orphanhood:
The prevalence of Orphanhood in DOWA was 1.1%. That is, about 1% of children under-five
reported that one or both parents are deceased. This result is low compared to the prevalence of
Orphanhood in Nkhotakota district but still can be considered as an alarming indicator of impeding
social and health crisis. Using this rate, about 1,100 children under-five are estimated to be orphans.
With the current HIV/AIDS prevalence of 14.33% nationally and 9.7% in the central Region (NAC
Lead Work Group, 2003), orphan hood, as a proxy indicator for adult chronic illness such as
HIV/AIDS, can become among the leading socio-economic and health problems in the district if not
addressed properly.
Household Food Security:
The staple crop in the district is maize with 96.9% of households reporting maize as their current
staple during the hunger season. On the other hand cash crops such as tobacco are commonly
grown by farmers. Around 67% households reported planting tobacco of which 38% reported having
planted their own entire field with tobacco only.
Contrary to our expectation a strong association was found between malnutrition and tobacco
growing. Households who planted a large proportion of their land with tobacco in Dowa district were
at high risk of having malnourished children. Households who planted tobacco in 2003 were 5 times
more likely to have wasted children than households who did not plant tobacco in the same year.
Similarly the risk ratio for household who planted tobacco in 2004 were 2.66 with 95% CI 0.32 < RR
< 21.89, that is households who planted tobacco this year had three times more likely to have
acutely malnourished child than households that did not plant tobacco. Tobacco growing was also
strongly associated with underweight and this could be perhaps due to the fact that households who
relied totally on tobacco becomes very vulnerable to food stress especially when the market price of
tobacco is low. On the other hand, households that do not diversify their crop are more likely to
depend on market to source their food during hunger season. Such households could be in
precarious situation for two reasons; market price of staple food usually increases during hunger
season and households’ access to cash is limited during hunger season compared to post-harvest
5 According to this classification, CMR less than 1.0 is considered not critical and the average CMR for
developing countries is reported to be 0.27 deaths per 10,000 people per day (USAID, 2000)
Concern Worldwide/Nutrition Survey, Dowa, 17th
to 25th
of February, 2004 14
season. For farmers to make the best out of cash corps continued efforts are necessary to promote
appropriate management of post-harvest and diversify crop production and household economy. A
total reliance on tobacco by itself can also pose threats to poor households who tend to sell their
goods at low price determine by corporate organizations.
The HH food security situation during the survey period is characterized by seasonal food stress
which is normal during the lean months of December to April. A significant number of HHs seem to
have coped with the food stress using the normal coping mechanism such as seasonal wild food
(15.6%) and resorting to markets to access staple food (51.0%) of which 65.2%) of the resource to
buy food come from ‘ganyu’ labour and a significant number of children, pregnant and lactating
women was in the CTC programme; there were 57 children in the NRU, 291 in the OTP and 1,481
in the SFP and 170 in pregnant and lactating mothers in the programme during the survey period in
Dowa). Only a small proportion of households (3.1%) shifted their staple from maize to cassava
compared to 18.8% in Nkhotakota this is perhaps due to the fact that cassava as a staple is less
commonly used in Dowa compared to Nkhotakota district and also the availability of decentralized
SFP in 17 Health centre-based distribution sites reaching nutritionally vulnerable groups could have
minimized the need to shift to other staple. Overall, there was no indication of an alarming HH food
security crisis with 96.9 % households still using maize as their staple during the current hunger
season, of which 44% were sourcing this staple from own production. This is consistent with the low
prevalence of global acute malnutrition.
There is a clear indication, however that most people live in very poor HHs characterized by little or
no assets and poor living condition. About 43.2% of HHs have reported having no chicken, no
shoes (20.2%) and no radio (47.9%), only 16.3% have pigs and less than 10% HHs have ox-cart,
treadle pump and cows (Table1 and annex 1). The HH economy is fragile and will not be able to
cope with a major shock between now and the next harvest. The next harvest appears to be in poor
standing compared to last year harvest as per the prospect indicated by most HHs. Households
reported the rain fall for this season has started late and ended earlier than usual.
CONCLUSION
Overall, the current nutrition condition (wasting) in Dowa District is lower than last year about the
same period. Global acute malnutrition and severe acute malnutrition rates were 2.6% and 0.7%
respectively. The prevalence of global and severe acute malnutrition among the high risk age group
(6 – 29 months of age) were 3.2% and 1.1% respectively. This requires a continued effort through
the CTC programme, which addresses the root causes of malnutrition on a long-term basis and at
the same time manage acute malnutrition to contribute significantly to child survival in the district.
Prevalence of stunting (61.2%) and underweight (30.5%) were very high and was consistent with
household economy indicators such as ownership of assets and living conditions. The high
prevalence of chronic malnutrition in Dowa district requires a concerted effort of addressing the root
causes of poverty on a sustainable basis.
Concern Worldwide/Nutrition Survey, Dowa, 17th
to 25th
of February, 2004 15
RECOMMENDATIONS
I. Continue the community-based nutrition programme in Dowa district that will address and
manage acute malnutrition on a sustainable basis at community level through a CTC
approach.
II. Continue to advocate for the sustainable management of acute malnutrition using existing
MoH structures at all levels.
III. Incorporate projects that aim at controlling and preventing childhood illnesses with the
existing CTC programme.
IV. Continue to promote crop diversification projects through the livelihood programme.
V. Continue to promote various appropriate methods of post-harvest management including
improved local storage facilities and post-harvest resource management skills.
VI. Design water and sanitation projects at a community level that will address the prevailing
WATSAN problems in the next budget year.
VII. Create managerial, supervision and logistical capacity for the CTC partners in order to
successfully roll out the programme to partners.
VIII. Monitor the nutrition condition in the district twice per annum (one in the post-harvest period
and the other in the pre-harvest period)
IX. Actively involve MoH and CHAM at all levels in the planning and implementation of the CTC
roll out.
X. Continue to monitor the CTC programme though a small and efficient CTC monitoring team
which will continue to provide technical support and undertake assessments including
nutrition survey in collaboration with the partners.
XI. Concern Worldwide Nutrition Programme should continue to identify resources though
potential donors and link them with its implementation partners.
Concern Worldwide/Nutrition Survey, Dowa, 17th
to 25th
of February, 2004 16
Annex 1: Summary of Findings of the DOWA Nutrition Survey, February 2004
Variables Prop.
/Mean
95% CI N Variables Prop.
/Mean
95% CI N
I. Household Economy, Coping strategies and Demographic Indicators:
Under-five children in the population 21.2% 19.5%-22.9% 951 Use of Wild Food 15.6% 10.0%-23.3% 257
Sex Proportion of sampled children Male
Female
48.6% 44.1%-53.2% 951 Household with Bicycle ownership 43.2% 34.6%-52.2% 257
51.4% 46.8%-56.0% 951 Household with Radio ownership 52.1% 43.2%-61.0% 257
Respondents Male
Female
15.2% 9.7%-22.8% 257 Houses with corrugated Iron roof 10.5% 6.0%-17.5% 257
84.8% 77.2%-90.3% 257 Household with Hoe ownership 98.1% 93.4%-99.6% 257
Female Headed Households* 19.7% 13.0%-28.7% 218 Household with Axe ownership 67.3% 58.4%-75.2% 257
Average Family size(Mean) 5.05 4.9 – 5.2 900 Household with ‘Motondo’ 42.8% 34.2%-51.8% 257
Under-five household composition: Two
Three
One
Four
26.2% 22.3%-30.6% 900 Households with ‘Panga’ 63.8% 54.8%-72.0% 257
2.1% 1.1%-4.0% 900 People with shoe 79.8% 71.6%-86.1% 257
47.2% 42.5%-51.9% 900 Household with watering can 56.8% 47.8%-65.4% 257
0.2% 0.01%-1.4% 900 Household with oxen 5.4% 2.4%-11.3% 257
Current(Jan-Feb) staple food Maize
Cassava
96.9% 91.7%-99.0% 256 Households with ownership of Bed 11.3% 6.6%-18.4% 257
3.1% 1.0%-8.3% 256 Household with ox cart 8.2% 4.3%-14.7% 257
Household with treadle pump 2.7% 0.8%-7.7% 257
Current Major source of staple Own product
Bought
Business
Exchange
44.0% 35.3%-53.0% 257 Household with grass made door 5.1% 2.2%-10.8% 257
51.0% 42.0%-59.8% 257 Household with pail 89.1% 82.1%-93.7% 257
1.2 0.1%-5.5% 257 Household with chicken 56.8% 47.8%-65.4% 257
3.5% 1.2%-8.8% 257 Household with pig 16.3% 10.6%-24.1% 257
Major source for buying staple ‘Ganyu’
Employment
Small business
Sales of Assets
Sales of F/w/Charcoal
Remittance
65.2% 52.5%-76.1% 135 Household with goat 34.2% 26.2%-43.2% 257
3.7% 0.8%-12.3% 135 Household with cow 6.2% 2.9%-12.3% 257
20.7% 12.2%-32.7% 135 Meals per day: young child Once
Twice
Three
Four
16.7%
47.9%
34.6%
0.8%
10.9%-24.6%
39.0%-56.8%
26.6%-43.6%
0.04%-4.8%
257
257
257
257
7.4% 2.8%-12.1% 135
2.2% 0.3%-10.2% 135
0.7% -0.0 -7.9% 135
Planted Tobacco last year 53.1% 44.1%-62.0% 254 Meals per day for the family Once
Twice
Three
16.0%
64.2%
19.8%
10.3%-23.7%
55.2%-72.3%
13.5%-28.0%
257
257
257
% planted tobacco last year Quarter
Half
¾ Quarter
Whole
18.4% 10.6%-29.8% 141 Main staple food in July last year Maize
Rice
99.6% 95.7%-100.0% 257
36.2% 25.3%-48.5% 141 0.4% -0.0%-4.3% 257
2.1% 0.3%-9.8% 141 % tobacco planted this year Quarter
Half
¾ Quarter
Whole
28.4% 19.6%-39.2% 176
43.3% 31.7%-55.6% 141 30.1% 21.0%-41.0% 176
Planted Tobacco this year 66.9% 58.0%-74.9% 254 3.4% 0.9%-10.3% 176
Percent household practicing Polygamy 15.5% 12.4%-19.1% 951 38.1% 28.1%-49.1% 176
Prospects of Next Harvest :Staple Maize 98.4% 93.9%-99.7% 257 Prospects: source: Own production 76.7% 68.2%-83.5% 257
Concern Worldwide/Nutrition Survey, Dowa, 17th
to 25th
of February, 2004 17
Cassava
Others
0.8% 0.04%-4.9% 257 Bought
Exchange
21.4% 14.9%-29.7% 257
0.8% 0.04%-4.9% 257 0.8% 0.04%-4.9% 257
II. Mortality, Morbidity, malnutrition, Vaccination and Water and Sanitation indicators:
Under five mortality rate (per 10,000 per day) 0.46 0.07 – 1.66 962 Major water source Borehole or pump 70.4% 61.6%-78.0% 257
Crud Mortality per 10,000 per day or (%) 0.22 0.06 – 0.51 4544 Protected well 1.2% 0.1%-5.5% 257
Under-five morbidity 62.3% 57.7%-66.6% 951 Unprotected well 20.2% 13.9%-28.4% 257
Percent of children with fever 35.1% 30.9%-39.6% 951 River/lake 6.2% 2.9%-12.3% 257
Percent of children with diarrheal 15.9% 12.8%-19.5% 951 Tap 1.6% 0.2%-6.1% 257
Percent of children with Respiratory Infect. 7.3% 5.2%-10.0% 951 Time in fetching water < 30 minutes 88.3% 81.1% - 93.1% 257
Global acute malnutrition 2.6% 1.4%-4.7% 951 30 – 60 min 10.1% 5.7% - 17.0% 257
Severe acute malnutrition 0.7% 0.2%-2.2% 951 60 – 120 min 1.6% 0.3% - 6.1% 257
Weight for Age (underweight) 30.5%. 26.4%-34.9% 951 > 120 min 0.0% 0.0% - 3.6% 257
Height-for-Age(stunting) 61.2% 56.6%-65.6% 951 Toilet use Bush
Covered latrine
Uncovered
11.7% 6.9%-18.8% 257
Prevalence of Oedema 0.6% 0.2%-2.0% 951 64.2% 55.2%-72.3% 257
Height-for-Age(stunting) 61.2% 56.6%-65.6% 951 24.1% 17.2%-32.6% 257
Mean weight-for-Height z-score -0.08 -0.14 to -0.02 951 Did you use soap during this month period 86.0% 78.5%-91.3% 257
Households visited by HSAs 40.1% 31.6%-49.1% 257 Percent of children < 1 year breastfed 84.2% 72.8%-91.6% 133
Vaccination card shown 80.7% 76.7%-84.0% 951 Percent of children > 1 and < 2 years breastfed 76.9% 65.9%-85.3% 160
Polio coverage 93.0% 90.2%-95.0% 951 Percent of children > 2 years breastfed 11.4% 8.1%-15.6% 616
Measles coverage 78.4% 74.4%-82.0% 951
BCG coverage 95.8% 93.5%-97.3% 951
Vitamin A supplementation 79.4% 75.4%-82.9% 951
Concern Worldwide/Nutrition Survey, Dowa, 17th
to 25th
of February, 2004 18
Annex-2: Forms used for data collection
Nutrition Survey - 6-59 months questionnaire
District: _______________________ TA: ___________________ Cluster no: _______________ Date: _______________
Village/GVH: _______________________ Team Leader: _______________
HH
ID
Child
ID
Polygamy Age
(mths)
6-59
mnths
Sex
(M/F)
Weight
(kg)*
Height
(cm)
65-
115cm
**
WT/HT Oedema
(Y/N)
MUAC
(cm)
Vac.
card
(Y/N)
Vaccination status Supp Morbidity (last 2 wks) B.feeding
(Y/N)
Currently Enrolled in
Feeding prog
Orphanage
%
Polio
(Y/N)
Measles
(Y/N)
BCG
(Y/N)
Vit.
A
(Y/N)
ILL
(Y/N)
Fever
(Y/N)
Diarrhea
(Y/N)
RTI
(Y/N)
Other
(Y/N)
No=0,NRU=1,OTP=2,
SFP=3,GR=4,Other=5 Y/N
1
2
3
4
5
6
7
8
9
10
11
12
13
14
15
16
17
18
19
20
21
22
23
24
25
26
27
28
29
30
* to nearest 0.1 kg ** to nearest 0.1cm
Concern Worldwide/Nutrition Survey, Dowa, 17th
to 25th
of February, 2004 19
Date : …………………………………………………………………………...District:……………………………..
Cluster number:…………………………………………………………………TA :…………………………
Team number:…………………………………………………………………..Village:………………………………
Household
N°
Total no in
h/h
Total no.
children <
5yrs
Total no.
>5yrs in h/h
Total no. deaths
1-59 months
Causes of Death
1-59 months
(1-9)*
Total no. deaths
>5yrs in h/h
Causes of Death
>5yrs in h/h
(1-9)*
TOTAL
* 1=Diarrhoea; 2=Bloody Diarrhoea; 3=Measles; 4=Fever; 5=Cough with difficulty breathing;
6=Malnutrition; 7=Accident; 8=Other (please specify) 9=Unknown
MORTALITY SURVEY (in the Past 90 days)
Concern Worldwide/Nutrition Survey, Dowa, 17th
to 25th
of February, 2004 20
District : ___________________ TA: ____________________
Village/Cluster:______________ Cluster No:________ Date:_____________
Household ID: ___________ Team Leader:________________________
Question Answer
(circle one or fill in spaces unless it
is otherwise indicated)
1. What is the sex of the head of the household? 1=Male 2=Female
2. Is the interviewer the head of the household? 1=Yes 2=No
3. In the last week (7 days), how many meals per day did your family
usually eat?
4. Have you been visited by an HSA in the past six months? 1=Yes 2=No
5. In the last 7 days, how many meals per day did the young children
usually eat?
6. In the last 7 days, how many meals per day did you usually eat?
7. What was your main staple food in July last year (2003)?
Specify “other”_______________________________________
1=maize , 2=cassava,
3=rice, 4=sweet
potato,
5=beans, 6=groundnuts
7=potato 8=other
8. What is your main staple food during this month in this year?
Specify “other”_______________________________________
1=maize , 2=cassava,
3=rice, 4=sweet
potato,
5=beans, 6=groundnuts
7=potato 8=other
9. What is the main source of staple food during this month this
year?
Specify “other”_______________________________________
1=Own production, 2=Bought
food,
3=Food Aid, 4=Borrowed,
5=Gift food, 6=Exchange,
7=Other
10. If bought, what was the main source of money?
1=Ganyu
2=Employment
3=Business 4=Sale of
assets
5=Sale of fire wood/charcoal
6=Remittance 7=Others
11. Did you plant tobacco last year? 1=yes 2=no
12. What was the proportion of land planted with tobacco last year?
1=Quarter 2=Half 3=Three-
quarter
4=Whole
13. Do you currently plant tobacco in your field this year? 1=yes 2=no
14. What is the proportion of land planted with tobacco this year?
1=Quarter 2=Half 3=Three-
quarter
4=Whole
15. What will the household’s main staple food be during the next 3
months?
Specify “other”_______________________________________
1=maize , 2=cassava,
3=rice, 4=sweet
potato,
5=beans, 6=groundnuts
7=potato 8=other
16. What will the main source of staple food be during the next 3
months ?
Specify “other”________________________________________
1=Own production, 2=Bought
food,
3=Food Aid, 4=Borrowed,
5=Gift food, 6=Exchange,
7=Other
17. Did you use wild food currently? 1=Yes 2=No
Concern Worldwide/Nutrition Survey, Dowa, 17th
to 25th
of February, 2004 21
If yes, list in ascending order starting from the most commonly used
____________________________________________________
18. Do you currently have one or more of the following assets in your
household?( circle more than one as appropriate)
1=bicycle 8. Hoe
2=Radio 9. Axe
3=TV 10. Mtondo
4=Iron corrugated roof 11. Panga
5=Shoes 12. Watering
can
6=Bed 13. Ox cart
7=grass door 14. Treadle
pump 15= Pail
16.Others
19. Do you own one of the following animals in your house?
If Others, Specify ____________________________________
1=Chicken
2=Pigs
3=Goat/Sheep
4=Cow
5=Oxen
6=Others
20. What is the major water source for your household?
Others, Specify ______________________________________
1=Tap
2=Borehole/pump
3=Treated tanker 4=Untreated
tanker
5=Protected well 6=Unprotected
well
7=River/lake 8= Madambo
9= Others
21. How long will it take you to and from the major water to your
house by foot (in minutes)?
22. Where do you usually go when you need to go to the toilet?
1=Bush 2=covered
latrine
3=uncovered latrine 4=Flushing
toilet
23. Did you use soap (washing/bathing) during this one month period? 1=yes 2=no
Concern Worldwide/Nutrition Survey, Dowa, 17th
to 25th
of February, 2004 22
Annex 3 Maps of DOWA Showing Selected Clusters (VH), February, 2004
Concern Worldwide/Nutrition Survey, Dowa, 17th
to 25th
of February, 2004 23

More Related Content

Similar to Dowa Nutrition Survey Report Final Draft (1).pdf

POSHAN District Nutrition Profile_Unnao_Uttar Pradesh
POSHAN District Nutrition Profile_Unnao_Uttar PradeshPOSHAN District Nutrition Profile_Unnao_Uttar Pradesh
POSHAN District Nutrition Profile_Unnao_Uttar PradeshPOSHAN
 
COMMON NUTRITIONAL PROBLEMS BY BABALOLA.pptx
COMMON NUTRITIONAL PROBLEMS BY BABALOLA.pptxCOMMON NUTRITIONAL PROBLEMS BY BABALOLA.pptx
COMMON NUTRITIONAL PROBLEMS BY BABALOLA.pptxChristabelAguinede
 
Chris Auricht - overview of population undernutrition
Chris Auricht - overview of population undernutritionChris Auricht - overview of population undernutrition
Chris Auricht - overview of population undernutritionACIAR
 
Monday 2: Orange-fleshed sweetpotato adoption improved dietary quality: evide...
Monday 2: Orange-fleshed sweetpotato adoption improved dietary quality: evide...Monday 2: Orange-fleshed sweetpotato adoption improved dietary quality: evide...
Monday 2: Orange-fleshed sweetpotato adoption improved dietary quality: evide...African Potato Association (APA)
 
Severe acute malnutrition by efe obasohan
Severe acute malnutrition by efe obasohanSevere acute malnutrition by efe obasohan
Severe acute malnutrition by efe obasohanefederek
 
POSHAN District Nutrition Profile_Kandhamal_Odisha
POSHAN District Nutrition Profile_Kandhamal_OdishaPOSHAN District Nutrition Profile_Kandhamal_Odisha
POSHAN District Nutrition Profile_Kandhamal_OdishaPOSHAN
 
Public health importance of malnutrition
Public health importance of malnutritionPublic health importance of malnutrition
Public health importance of malnutritionMarwa Salem
 
Emusire presentation
Emusire presentationEmusire presentation
Emusire presentationDoctor Okto
 
Early-Life Undernourishment in Developing Countries: Prevalence, Impacts over...
Early-Life Undernourishment in Developing Countries: Prevalence, Impacts over...Early-Life Undernourishment in Developing Countries: Prevalence, Impacts over...
Early-Life Undernourishment in Developing Countries: Prevalence, Impacts over...Young Lives Oxford
 
Nutrition surveillance for sudan
Nutrition surveillance for sudanNutrition surveillance for sudan
Nutrition surveillance for sudanKazuko Yoshizawa
 
Dietary Intake and Nutritional Status of the Elderly in Osun State (2)
Dietary Intake and Nutritional Status of the Elderly in Osun State (2)Dietary Intake and Nutritional Status of the Elderly in Osun State (2)
Dietary Intake and Nutritional Status of the Elderly in Osun State (2)iosrjce
 
WFP Angola Nutrition Work
WFP Angola Nutrition WorkWFP Angola Nutrition Work
WFP Angola Nutrition WorkCatherine Hsu
 
Prevalence of anemia among teenage pregnant girls attending antenatal clinic ...
Prevalence of anemia among teenage pregnant girls attending antenatal clinic ...Prevalence of anemia among teenage pregnant girls attending antenatal clinic ...
Prevalence of anemia among teenage pregnant girls attending antenatal clinic ...Alexander Decker
 
POSHAN District Nutrition Profile_Balesore_Odisha
POSHAN District Nutrition Profile_Balesore_OdishaPOSHAN District Nutrition Profile_Balesore_Odisha
POSHAN District Nutrition Profile_Balesore_OdishaPOSHAN
 
Nicaragua ort project presentation
Nicaragua ort project presentationNicaragua ort project presentation
Nicaragua ort project presentationImelda Medina, MD
 

Similar to Dowa Nutrition Survey Report Final Draft (1).pdf (20)

SMAMP Poster 151019
SMAMP Poster 151019SMAMP Poster 151019
SMAMP Poster 151019
 
POSHAN District Nutrition Profile_Unnao_Uttar Pradesh
POSHAN District Nutrition Profile_Unnao_Uttar PradeshPOSHAN District Nutrition Profile_Unnao_Uttar Pradesh
POSHAN District Nutrition Profile_Unnao_Uttar Pradesh
 
How to use must
How to use mustHow to use must
How to use must
 
COMMON NUTRITIONAL PROBLEMS BY BABALOLA.pptx
COMMON NUTRITIONAL PROBLEMS BY BABALOLA.pptxCOMMON NUTRITIONAL PROBLEMS BY BABALOLA.pptx
COMMON NUTRITIONAL PROBLEMS BY BABALOLA.pptx
 
Chris Auricht - overview of population undernutrition
Chris Auricht - overview of population undernutritionChris Auricht - overview of population undernutrition
Chris Auricht - overview of population undernutrition
 
Child health
Child healthChild health
Child health
 
Monday 2: Orange-fleshed sweetpotato adoption improved dietary quality: evide...
Monday 2: Orange-fleshed sweetpotato adoption improved dietary quality: evide...Monday 2: Orange-fleshed sweetpotato adoption improved dietary quality: evide...
Monday 2: Orange-fleshed sweetpotato adoption improved dietary quality: evide...
 
Severe acute malnutrition by efe obasohan
Severe acute malnutrition by efe obasohanSevere acute malnutrition by efe obasohan
Severe acute malnutrition by efe obasohan
 
POSHAN District Nutrition Profile_Kandhamal_Odisha
POSHAN District Nutrition Profile_Kandhamal_OdishaPOSHAN District Nutrition Profile_Kandhamal_Odisha
POSHAN District Nutrition Profile_Kandhamal_Odisha
 
Public health importance of malnutrition
Public health importance of malnutritionPublic health importance of malnutrition
Public health importance of malnutrition
 
Emusire presentation
Emusire presentationEmusire presentation
Emusire presentation
 
Early-Life Undernourishment in Developing Countries: Prevalence, Impacts over...
Early-Life Undernourishment in Developing Countries: Prevalence, Impacts over...Early-Life Undernourishment in Developing Countries: Prevalence, Impacts over...
Early-Life Undernourishment in Developing Countries: Prevalence, Impacts over...
 
Nutrition surveillance for sudan
Nutrition surveillance for sudanNutrition surveillance for sudan
Nutrition surveillance for sudan
 
Healthy Weights
Healthy WeightsHealthy Weights
Healthy Weights
 
Dietary Intake and Nutritional Status of the Elderly in Osun State (2)
Dietary Intake and Nutritional Status of the Elderly in Osun State (2)Dietary Intake and Nutritional Status of the Elderly in Osun State (2)
Dietary Intake and Nutritional Status of the Elderly in Osun State (2)
 
WFP Angola Nutrition Work
WFP Angola Nutrition WorkWFP Angola Nutrition Work
WFP Angola Nutrition Work
 
Prevalence of anemia among teenage pregnant girls attending antenatal clinic ...
Prevalence of anemia among teenage pregnant girls attending antenatal clinic ...Prevalence of anemia among teenage pregnant girls attending antenatal clinic ...
Prevalence of anemia among teenage pregnant girls attending antenatal clinic ...
 
Monday theme 2 1545 1600 room 11 bocher
Monday theme 2 1545 1600 room 11 bocherMonday theme 2 1545 1600 room 11 bocher
Monday theme 2 1545 1600 room 11 bocher
 
POSHAN District Nutrition Profile_Balesore_Odisha
POSHAN District Nutrition Profile_Balesore_OdishaPOSHAN District Nutrition Profile_Balesore_Odisha
POSHAN District Nutrition Profile_Balesore_Odisha
 
Nicaragua ort project presentation
Nicaragua ort project presentationNicaragua ort project presentation
Nicaragua ort project presentation
 

More from ssuserb3b109

Guideline for developing National Multisectoral Nutrition Plans for Sudan Fin...
Guideline for developing National Multisectoral Nutrition Plans for Sudan Fin...Guideline for developing National Multisectoral Nutrition Plans for Sudan Fin...
Guideline for developing National Multisectoral Nutrition Plans for Sudan Fin...ssuserb3b109
 
Final Koraro MVP( Millennium Villages Project) summary report.pdf
Final Koraro MVP( Millennium Villages Project) summary report.pdfFinal Koraro MVP( Millennium Villages Project) summary report.pdf
Final Koraro MVP( Millennium Villages Project) summary report.pdfssuserb3b109
 
Food fortification of Wheat Flour Considerations in the context of Ethiopia.pdf
Food fortification of Wheat Flour Considerations in the context of Ethiopia.pdfFood fortification of Wheat Flour Considerations in the context of Ethiopia.pdf
Food fortification of Wheat Flour Considerations in the context of Ethiopia.pdfssuserb3b109
 
Workshop report on community based managment of acute malnutrition-june-2006(...
Workshop report on community based managment of acute malnutrition-june-2006(...Workshop report on community based managment of acute malnutrition-june-2006(...
Workshop report on community based managment of acute malnutrition-june-2006(...ssuserb3b109
 
Integrating CTC in health care delivery systems in Malawi (Special Supplement...
Integrating CTC in health care delivery systems in Malawi (Special Supplement...Integrating CTC in health care delivery systems in Malawi (Special Supplement...
Integrating CTC in health care delivery systems in Malawi (Special Supplement...ssuserb3b109
 
National consultation seminar on management of severe acute malnutrition, Mal...
National consultation seminar on management of severe acute malnutrition, Mal...National consultation seminar on management of severe acute malnutrition, Mal...
National consultation seminar on management of severe acute malnutrition, Mal...ssuserb3b109
 
Community Based Approaches to Managing Severe Acute Malnutrition
Community Based Approaches to Managing Severe Acute MalnutritionCommunity Based Approaches to Managing Severe Acute Malnutrition
Community Based Approaches to Managing Severe Acute Malnutritionssuserb3b109
 

More from ssuserb3b109 (7)

Guideline for developing National Multisectoral Nutrition Plans for Sudan Fin...
Guideline for developing National Multisectoral Nutrition Plans for Sudan Fin...Guideline for developing National Multisectoral Nutrition Plans for Sudan Fin...
Guideline for developing National Multisectoral Nutrition Plans for Sudan Fin...
 
Final Koraro MVP( Millennium Villages Project) summary report.pdf
Final Koraro MVP( Millennium Villages Project) summary report.pdfFinal Koraro MVP( Millennium Villages Project) summary report.pdf
Final Koraro MVP( Millennium Villages Project) summary report.pdf
 
Food fortification of Wheat Flour Considerations in the context of Ethiopia.pdf
Food fortification of Wheat Flour Considerations in the context of Ethiopia.pdfFood fortification of Wheat Flour Considerations in the context of Ethiopia.pdf
Food fortification of Wheat Flour Considerations in the context of Ethiopia.pdf
 
Workshop report on community based managment of acute malnutrition-june-2006(...
Workshop report on community based managment of acute malnutrition-june-2006(...Workshop report on community based managment of acute malnutrition-june-2006(...
Workshop report on community based managment of acute malnutrition-june-2006(...
 
Integrating CTC in health care delivery systems in Malawi (Special Supplement...
Integrating CTC in health care delivery systems in Malawi (Special Supplement...Integrating CTC in health care delivery systems in Malawi (Special Supplement...
Integrating CTC in health care delivery systems in Malawi (Special Supplement...
 
National consultation seminar on management of severe acute malnutrition, Mal...
National consultation seminar on management of severe acute malnutrition, Mal...National consultation seminar on management of severe acute malnutrition, Mal...
National consultation seminar on management of severe acute malnutrition, Mal...
 
Community Based Approaches to Managing Severe Acute Malnutrition
Community Based Approaches to Managing Severe Acute MalnutritionCommunity Based Approaches to Managing Severe Acute Malnutrition
Community Based Approaches to Managing Severe Acute Malnutrition
 

Recently uploaded

Book Paid Powai Call Girls Mumbai 𖠋 9930245274 𖠋Low Budget Full Independent H...
Book Paid Powai Call Girls Mumbai 𖠋 9930245274 𖠋Low Budget Full Independent H...Book Paid Powai Call Girls Mumbai 𖠋 9930245274 𖠋Low Budget Full Independent H...
Book Paid Powai Call Girls Mumbai 𖠋 9930245274 𖠋Low Budget Full Independent H...Call Girls in Nagpur High Profile
 
Top Rated Bangalore Call Girls Richmond Circle ⟟ 8250192130 ⟟ Call Me For Gen...
Top Rated Bangalore Call Girls Richmond Circle ⟟ 8250192130 ⟟ Call Me For Gen...Top Rated Bangalore Call Girls Richmond Circle ⟟ 8250192130 ⟟ Call Me For Gen...
Top Rated Bangalore Call Girls Richmond Circle ⟟ 8250192130 ⟟ Call Me For Gen...narwatsonia7
 
♛VVIP Hyderabad Call Girls Chintalkunta🖕7001035870🖕Riya Kappor Top Call Girl ...
♛VVIP Hyderabad Call Girls Chintalkunta🖕7001035870🖕Riya Kappor Top Call Girl ...♛VVIP Hyderabad Call Girls Chintalkunta🖕7001035870🖕Riya Kappor Top Call Girl ...
♛VVIP Hyderabad Call Girls Chintalkunta🖕7001035870🖕Riya Kappor Top Call Girl ...astropune
 
Bangalore Call Girl Whatsapp Number 100% Complete Your Sexual Needs
Bangalore Call Girl Whatsapp Number 100% Complete Your Sexual NeedsBangalore Call Girl Whatsapp Number 100% Complete Your Sexual Needs
Bangalore Call Girl Whatsapp Number 100% Complete Your Sexual NeedsGfnyt
 
Call Girls Ooty Just Call 9907093804 Top Class Call Girl Service Available
Call Girls Ooty Just Call 9907093804 Top Class Call Girl Service AvailableCall Girls Ooty Just Call 9907093804 Top Class Call Girl Service Available
Call Girls Ooty Just Call 9907093804 Top Class Call Girl Service AvailableDipal Arora
 
Call Girls Service Jaipur Grishma WhatsApp ❤8445551418 VIP Call Girls Jaipur
Call Girls Service Jaipur Grishma WhatsApp ❤8445551418 VIP Call Girls JaipurCall Girls Service Jaipur Grishma WhatsApp ❤8445551418 VIP Call Girls Jaipur
Call Girls Service Jaipur Grishma WhatsApp ❤8445551418 VIP Call Girls Jaipurparulsinha
 
Call Girl Number in Vashi Mumbai📲 9833363713 💞 Full Night Enjoy
Call Girl Number in Vashi Mumbai📲 9833363713 💞 Full Night EnjoyCall Girl Number in Vashi Mumbai📲 9833363713 💞 Full Night Enjoy
Call Girl Number in Vashi Mumbai📲 9833363713 💞 Full Night Enjoybabeytanya
 
Call Girls Colaba Mumbai ❤️ 9920874524 👈 Cash on Delivery
Call Girls Colaba Mumbai ❤️ 9920874524 👈 Cash on DeliveryCall Girls Colaba Mumbai ❤️ 9920874524 👈 Cash on Delivery
Call Girls Colaba Mumbai ❤️ 9920874524 👈 Cash on Deliverynehamumbai
 
Bangalore Call Girls Hebbal Kempapura Number 7001035870 Meetin With Bangalor...
Bangalore Call Girls Hebbal Kempapura Number 7001035870  Meetin With Bangalor...Bangalore Call Girls Hebbal Kempapura Number 7001035870  Meetin With Bangalor...
Bangalore Call Girls Hebbal Kempapura Number 7001035870 Meetin With Bangalor...narwatsonia7
 
Night 7k to 12k Chennai City Center Call Girls 👉👉 7427069034⭐⭐ 100% Genuine E...
Night 7k to 12k Chennai City Center Call Girls 👉👉 7427069034⭐⭐ 100% Genuine E...Night 7k to 12k Chennai City Center Call Girls 👉👉 7427069034⭐⭐ 100% Genuine E...
Night 7k to 12k Chennai City Center Call Girls 👉👉 7427069034⭐⭐ 100% Genuine E...hotbabesbook
 
High Profile Call Girls Coimbatore Saanvi☎️ 8250192130 Independent Escort Se...
High Profile Call Girls Coimbatore Saanvi☎️  8250192130 Independent Escort Se...High Profile Call Girls Coimbatore Saanvi☎️  8250192130 Independent Escort Se...
High Profile Call Girls Coimbatore Saanvi☎️ 8250192130 Independent Escort Se...narwatsonia7
 
VIP Service Call Girls Sindhi Colony 📳 7877925207 For 18+ VIP Call Girl At Th...
VIP Service Call Girls Sindhi Colony 📳 7877925207 For 18+ VIP Call Girl At Th...VIP Service Call Girls Sindhi Colony 📳 7877925207 For 18+ VIP Call Girl At Th...
VIP Service Call Girls Sindhi Colony 📳 7877925207 For 18+ VIP Call Girl At Th...jageshsingh5554
 
💎VVIP Kolkata Call Girls Parganas🩱7001035870🩱Independent Girl ( Ac Rooms Avai...
💎VVIP Kolkata Call Girls Parganas🩱7001035870🩱Independent Girl ( Ac Rooms Avai...💎VVIP Kolkata Call Girls Parganas🩱7001035870🩱Independent Girl ( Ac Rooms Avai...
💎VVIP Kolkata Call Girls Parganas🩱7001035870🩱Independent Girl ( Ac Rooms Avai...Taniya Sharma
 
The Most Attractive Hyderabad Call Girls Kothapet 𖠋 6297143586 𖠋 Will You Mis...
The Most Attractive Hyderabad Call Girls Kothapet 𖠋 6297143586 𖠋 Will You Mis...The Most Attractive Hyderabad Call Girls Kothapet 𖠋 6297143586 𖠋 Will You Mis...
The Most Attractive Hyderabad Call Girls Kothapet 𖠋 6297143586 𖠋 Will You Mis...chandars293
 
Vip Call Girls Anna Salai Chennai 👉 8250192130 ❣️💯 Top Class Girls Available
Vip Call Girls Anna Salai Chennai 👉 8250192130 ❣️💯 Top Class Girls AvailableVip Call Girls Anna Salai Chennai 👉 8250192130 ❣️💯 Top Class Girls Available
Vip Call Girls Anna Salai Chennai 👉 8250192130 ❣️💯 Top Class Girls AvailableNehru place Escorts
 
VIP Mumbai Call Girls Hiranandani Gardens Just Call 9920874524 with A/C Room ...
VIP Mumbai Call Girls Hiranandani Gardens Just Call 9920874524 with A/C Room ...VIP Mumbai Call Girls Hiranandani Gardens Just Call 9920874524 with A/C Room ...
VIP Mumbai Call Girls Hiranandani Gardens Just Call 9920874524 with A/C Room ...Garima Khatri
 
Chandrapur Call girls 8617370543 Provides all area service COD available
Chandrapur Call girls 8617370543 Provides all area service COD availableChandrapur Call girls 8617370543 Provides all area service COD available
Chandrapur Call girls 8617370543 Provides all area service COD availableDipal Arora
 
Kesar Bagh Call Girl Price 9548273370 , Lucknow Call Girls Service
Kesar Bagh Call Girl Price 9548273370 , Lucknow Call Girls ServiceKesar Bagh Call Girl Price 9548273370 , Lucknow Call Girls Service
Kesar Bagh Call Girl Price 9548273370 , Lucknow Call Girls Servicemakika9823
 
Premium Call Girls Cottonpet Whatsapp 7001035870 Independent Escort Service
Premium Call Girls Cottonpet Whatsapp 7001035870 Independent Escort ServicePremium Call Girls Cottonpet Whatsapp 7001035870 Independent Escort Service
Premium Call Girls Cottonpet Whatsapp 7001035870 Independent Escort Servicevidya singh
 

Recently uploaded (20)

Book Paid Powai Call Girls Mumbai 𖠋 9930245274 𖠋Low Budget Full Independent H...
Book Paid Powai Call Girls Mumbai 𖠋 9930245274 𖠋Low Budget Full Independent H...Book Paid Powai Call Girls Mumbai 𖠋 9930245274 𖠋Low Budget Full Independent H...
Book Paid Powai Call Girls Mumbai 𖠋 9930245274 𖠋Low Budget Full Independent H...
 
Top Rated Bangalore Call Girls Richmond Circle ⟟ 8250192130 ⟟ Call Me For Gen...
Top Rated Bangalore Call Girls Richmond Circle ⟟ 8250192130 ⟟ Call Me For Gen...Top Rated Bangalore Call Girls Richmond Circle ⟟ 8250192130 ⟟ Call Me For Gen...
Top Rated Bangalore Call Girls Richmond Circle ⟟ 8250192130 ⟟ Call Me For Gen...
 
♛VVIP Hyderabad Call Girls Chintalkunta🖕7001035870🖕Riya Kappor Top Call Girl ...
♛VVIP Hyderabad Call Girls Chintalkunta🖕7001035870🖕Riya Kappor Top Call Girl ...♛VVIP Hyderabad Call Girls Chintalkunta🖕7001035870🖕Riya Kappor Top Call Girl ...
♛VVIP Hyderabad Call Girls Chintalkunta🖕7001035870🖕Riya Kappor Top Call Girl ...
 
Bangalore Call Girl Whatsapp Number 100% Complete Your Sexual Needs
Bangalore Call Girl Whatsapp Number 100% Complete Your Sexual NeedsBangalore Call Girl Whatsapp Number 100% Complete Your Sexual Needs
Bangalore Call Girl Whatsapp Number 100% Complete Your Sexual Needs
 
Call Girls Ooty Just Call 9907093804 Top Class Call Girl Service Available
Call Girls Ooty Just Call 9907093804 Top Class Call Girl Service AvailableCall Girls Ooty Just Call 9907093804 Top Class Call Girl Service Available
Call Girls Ooty Just Call 9907093804 Top Class Call Girl Service Available
 
Call Girls Service Jaipur Grishma WhatsApp ❤8445551418 VIP Call Girls Jaipur
Call Girls Service Jaipur Grishma WhatsApp ❤8445551418 VIP Call Girls JaipurCall Girls Service Jaipur Grishma WhatsApp ❤8445551418 VIP Call Girls Jaipur
Call Girls Service Jaipur Grishma WhatsApp ❤8445551418 VIP Call Girls Jaipur
 
Call Girl Number in Vashi Mumbai📲 9833363713 💞 Full Night Enjoy
Call Girl Number in Vashi Mumbai📲 9833363713 💞 Full Night EnjoyCall Girl Number in Vashi Mumbai📲 9833363713 💞 Full Night Enjoy
Call Girl Number in Vashi Mumbai📲 9833363713 💞 Full Night Enjoy
 
Call Girls Colaba Mumbai ❤️ 9920874524 👈 Cash on Delivery
Call Girls Colaba Mumbai ❤️ 9920874524 👈 Cash on DeliveryCall Girls Colaba Mumbai ❤️ 9920874524 👈 Cash on Delivery
Call Girls Colaba Mumbai ❤️ 9920874524 👈 Cash on Delivery
 
Bangalore Call Girls Hebbal Kempapura Number 7001035870 Meetin With Bangalor...
Bangalore Call Girls Hebbal Kempapura Number 7001035870  Meetin With Bangalor...Bangalore Call Girls Hebbal Kempapura Number 7001035870  Meetin With Bangalor...
Bangalore Call Girls Hebbal Kempapura Number 7001035870 Meetin With Bangalor...
 
Night 7k to 12k Chennai City Center Call Girls 👉👉 7427069034⭐⭐ 100% Genuine E...
Night 7k to 12k Chennai City Center Call Girls 👉👉 7427069034⭐⭐ 100% Genuine E...Night 7k to 12k Chennai City Center Call Girls 👉👉 7427069034⭐⭐ 100% Genuine E...
Night 7k to 12k Chennai City Center Call Girls 👉👉 7427069034⭐⭐ 100% Genuine E...
 
High Profile Call Girls Coimbatore Saanvi☎️ 8250192130 Independent Escort Se...
High Profile Call Girls Coimbatore Saanvi☎️  8250192130 Independent Escort Se...High Profile Call Girls Coimbatore Saanvi☎️  8250192130 Independent Escort Se...
High Profile Call Girls Coimbatore Saanvi☎️ 8250192130 Independent Escort Se...
 
Russian Call Girls in Delhi Tanvi ➡️ 9711199012 💋📞 Independent Escort Service...
Russian Call Girls in Delhi Tanvi ➡️ 9711199012 💋📞 Independent Escort Service...Russian Call Girls in Delhi Tanvi ➡️ 9711199012 💋📞 Independent Escort Service...
Russian Call Girls in Delhi Tanvi ➡️ 9711199012 💋📞 Independent Escort Service...
 
VIP Service Call Girls Sindhi Colony 📳 7877925207 For 18+ VIP Call Girl At Th...
VIP Service Call Girls Sindhi Colony 📳 7877925207 For 18+ VIP Call Girl At Th...VIP Service Call Girls Sindhi Colony 📳 7877925207 For 18+ VIP Call Girl At Th...
VIP Service Call Girls Sindhi Colony 📳 7877925207 For 18+ VIP Call Girl At Th...
 
💎VVIP Kolkata Call Girls Parganas🩱7001035870🩱Independent Girl ( Ac Rooms Avai...
💎VVIP Kolkata Call Girls Parganas🩱7001035870🩱Independent Girl ( Ac Rooms Avai...💎VVIP Kolkata Call Girls Parganas🩱7001035870🩱Independent Girl ( Ac Rooms Avai...
💎VVIP Kolkata Call Girls Parganas🩱7001035870🩱Independent Girl ( Ac Rooms Avai...
 
The Most Attractive Hyderabad Call Girls Kothapet 𖠋 6297143586 𖠋 Will You Mis...
The Most Attractive Hyderabad Call Girls Kothapet 𖠋 6297143586 𖠋 Will You Mis...The Most Attractive Hyderabad Call Girls Kothapet 𖠋 6297143586 𖠋 Will You Mis...
The Most Attractive Hyderabad Call Girls Kothapet 𖠋 6297143586 𖠋 Will You Mis...
 
Vip Call Girls Anna Salai Chennai 👉 8250192130 ❣️💯 Top Class Girls Available
Vip Call Girls Anna Salai Chennai 👉 8250192130 ❣️💯 Top Class Girls AvailableVip Call Girls Anna Salai Chennai 👉 8250192130 ❣️💯 Top Class Girls Available
Vip Call Girls Anna Salai Chennai 👉 8250192130 ❣️💯 Top Class Girls Available
 
VIP Mumbai Call Girls Hiranandani Gardens Just Call 9920874524 with A/C Room ...
VIP Mumbai Call Girls Hiranandani Gardens Just Call 9920874524 with A/C Room ...VIP Mumbai Call Girls Hiranandani Gardens Just Call 9920874524 with A/C Room ...
VIP Mumbai Call Girls Hiranandani Gardens Just Call 9920874524 with A/C Room ...
 
Chandrapur Call girls 8617370543 Provides all area service COD available
Chandrapur Call girls 8617370543 Provides all area service COD availableChandrapur Call girls 8617370543 Provides all area service COD available
Chandrapur Call girls 8617370543 Provides all area service COD available
 
Kesar Bagh Call Girl Price 9548273370 , Lucknow Call Girls Service
Kesar Bagh Call Girl Price 9548273370 , Lucknow Call Girls ServiceKesar Bagh Call Girl Price 9548273370 , Lucknow Call Girls Service
Kesar Bagh Call Girl Price 9548273370 , Lucknow Call Girls Service
 
Premium Call Girls Cottonpet Whatsapp 7001035870 Independent Escort Service
Premium Call Girls Cottonpet Whatsapp 7001035870 Independent Escort ServicePremium Call Girls Cottonpet Whatsapp 7001035870 Independent Escort Service
Premium Call Girls Cottonpet Whatsapp 7001035870 Independent Escort Service
 

Dowa Nutrition Survey Report Final Draft (1).pdf

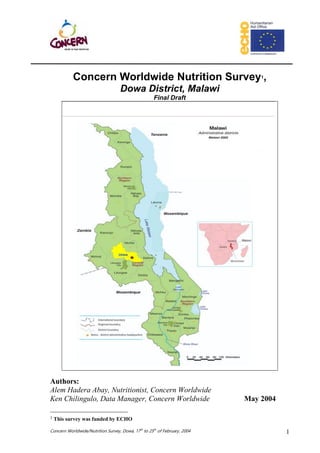
  • 1. Concern Worldwide/Nutrition Survey, Dowa, 17th to 25th of February, 2004 1 Concern Worldwide Nutrition Survey1, Dowa District, Malawi Final Draft Authors: Alem Hadera Abay, Nutritionist, Concern Worldwide Ken Chilingulo, Data Manager, Concern Worldwide May 2004 1 This survey was funded by ECHO
  • 2. Concern Worldwide/Nutrition Survey, Dowa, 17th to 25th of February, 2004 2 TABLE OF CONTENTS EXECUTIVE SUMMARY .................................................................................................... 4 Acute Malnutrition: ........................................................................................................... 4 Mortality and Orphan hood:............................................................................................ 5 Immunization:.................................................................................................................... 5 Chronic Malnutrition and Household Economy:.......................................................... 5 INTRODUCTION .................................................................................................................. 6 Background:...................................................................................................................... 6 Survey Objectives:........................................................................................................... 6 METHODOLOGY ................................................................................................................. 6 Survey Design: ................................................................................................................. 6 Sampling Procedure:....................................................................................................... 7 Training and Field Testing: ............................................................................................. 7 Selection of Villages, Households and Children: ........................................................ 7 Data Collected:........................................................................................................................ 7 Children Anthropometric Questionnaire: ...................................................................... 7 Mortality Questionnaire: .................................................................................................. 7 RESULTS AND DISCUSSION............................................................................................. 8 Distribution of the Sample by Age and Sex: ................................................................ 8 Under-five Children Nutritional Status: ......................................................................... 8 Chronic Malnutrition:...................................................................................................... 11 Immunization:.................................................................................................................. 12 Mortality: .......................................................................................................................... 13 Household Food Security:............................................................................................. 13 CONCLUSION..................................................................................................................... 14 RECOMMENDATIONS...................................................................................................... 15 Annex 1: Summary of Findings of the DOWA Nutrition Survey, February 2004 . 16 Annex-2: Forms used for data collection.................................................................... 18 Annex 3: Maps of DOWA Showing Selected Clusters (VH), February, 2004 ...... 22 LIST OF TABLES AND FIGURES Table 1 Major findings of nutrition, morbidity, mortality, household level food security conditions in, February, 2004 Table-2 Trends of Acute Malnutrition and Children Under-five Mortality in Dowa District Table 3 Distribution by age and sex of sample, Dowa District Table 4 Prevalence of acute malnutrition based on weight for height z-score Table 5 Cross-tables of MUAC and WHZ among Children Under-five in Dowa District Table 6 Prevalence of Selected Childhood Illnesses in Dowa District Figure-1 Trends of Acute Malnutrition & U5MR in Dowa District Figure-2: A graph showing the Sensitivity and Specificity of MUAC Figure 3 HAZ Comparisons of Dowa and Reference Children Figure 4 WAZ Comparisons of Dowa and Reference Children Figure 5 Causes of Under-five Mortality in Dowa District, February 2004
  • 3. Concern Worldwide/Nutrition Survey, Dowa, 17th to 25th of February, 2004 3 ACRONYMS BCG Bacille Callmette Guerin(Vaccine for tuberculosis) CHAM Christian Health Association of Malawi CI Confidence Interval CMR Crude Mortality Rate CTC Community Therapeutic Care DHO District Health Office DHS Demographic and Health Survey EPI Extended Programme on Immunization GAM Global Acute Malnutrition GVH Group Village Headman HAZ Height-for-Age Z-score HAS Health Surveillance Assistant HH Household IMR Infant Mortality Rate MoHP Ministry of Health and Population NGO Non Governmental Organization DOWA Dowa NSO National Statistics Office RR Risk Ratio RTI Respiratory Tract Infection SAM Severe Acute Malnutrition U5MR Under 5 Mortality Rate UNICEF United Nations Children Fund WAZ Weight for Age Z-score W/H Weight for Height WHZ Weight for Height Z-score WHO World Health Organization
  • 4. Concern Worldwide/Nutrition Survey, Dowa, 17th to 25th of February, 2004 4 EXECUTIVE SUMMARY Dowa district is located in the Central region of Malawi with a total population of 469,924 as per the 1998 Malawi Population census. The district is considered one of the most densely populated and food insecure districts in the region. A joint nutrition survey team composed of HSAs and nurses from MoHP, CHAM and Concern Worldwide conducted a 30x30 cluster nutrition survey from 17th to 25th of February, 2004 in Dowa District Central Region of Malawi. The survey team has collected anthropometric, household food security, mortality and morbidity data using a structured questionnaire. Table 1 indicates the major finds of this survey and the detailed data analysis is found in annex 1. Table-1: Major findings of the nutrition, morbidity, mortality and household level food security conditions in, February, 2004 INDICATORS PROP 95% CI n Under-five Children Nutritional status indicators: Global acute malnutrition (WHZ) 2.6% 1.4% - 4.7% 951 Severe acute malnutrition (WHZ) 0.7% 0.2% - 2.2% 951 Global acute malnutrition WH percentile median 2.1% 1.1% - 3.9% 951 Sever acute malnutrition WH percentile median 0.7% 0.2% - 2.2% 951 Weight-for-Age(underweight) 30.5% 26.4% - 34.9% 951 Height-for-Age(stunting) 61.2% 56.6% - 65.6% 951 Prevalence of Oedema 0.6% 0.2% - 2.0% 951 Mean weight-for-Height z-score -0.08 -0.14 to 0.02 951 Demographic, Morbidity, Mortality Orphanhood Indicators % of children under-five 21.2% 19.5% - 22.9% 951 Percent household practicing Polygamy 15.5% 12.4% - 19.1% 951 Under-five morbidity 62.3% 57.7% - 66.6% 951 Under-five Mortality Rate (10,000/day) 0.46 0.07 - 1.66 962 Crude Mortality Rate(10,000/day) 0.22 0.06 - 0.51 4544 Orphanhood 1.1% 0.4% - 2.6% 951 Vaccination coverage indicators Measles vaccination 78.4% 74.4% - 82.0% 951 BCG vaccination 95.8% 93.5% - 97.3% 951 Vitamin A supplementation 79.4% 75.4% - 82.9% 951 Household Food Security and water and sanitation indicators: % HHs reported maize as staple food in Pre-harvest(Feb/’04) 96.9% 91.7% - 99.0% 257 % HHs that reported maize as staple in Post-harvest(July/’03) 99.6% 95.7%- 100.0% 257 % HHs that maintained maize as staple in Pre-harvest 96.4% 91.2% - 98.8% 256 % HHs that shifted from maize to cassava in pre-harvest 3.1% 1.0% - 8.3% 256 % HHs reported using Wild Food in pre-harvest(Feb/’04) 15.6% 10.0% - 23.3% 257 % HHs with radio ownership 52.1% 43.2% - 61.0% 257 % HHs with ox-cart ownership 8.2% 4.3% - 14.7% 257 % HHs with bicycle ownership 43.2% 34.6% - 52.2% 257 % HHs that owned chicken 56.8% 47.8% - 65.4% 257 % household with goat 34.2% 26.2% - 43.2% 257 % household with cow 6.2% 2.9% - 12.3% 257 Average family meal per day 2.04 2.0% - 2.1% 257 % Unprotected well as a major water source 20.2% 13.9% - 28.4% 257 % HHs accessing water from protected source 73.2% 64.5% - 80.4% 257 % HHs with out toilet facilities 11.7% 6.9% - 18.8% 257 % HHs using soap in the past month 86.0% 78.5% - 91.3% 257 Acute Malnutrition: The current level of global (2.6%) and severe (0.7%) acute malnutrition as in Figure-1 were lower compared to global (4.5%) and severe (1.1%) acute malnutrition in January 2003. The difference in the global acute malnutrition rates was statistically significant (See Table-2). This could be due to the decentralized Community Therapeutic Care (CTC) programme, which addressed acute malnutrition since August 2002 and the good harvest in 2003 harvest. The CTC programme in Dowa encompassed biweekly targeted take home supplementary feeding for moderately malnourished children and pregnant and lactating mothers, outpatient therapeutic care for non-
  • 5. Concern Worldwide/Nutrition Survey, Dowa, 17th to 25th of February, 2004 5 complicated severely malnourished children on a weekly check-up visits in 17 nearby health centres and inpatient therapeutic care for severely malnourished children with complications in 3 NRUs. The level of global acute malnutrition during this year hunger period in a country with one farming season is not alarming; however the level of severe acute malnutrition is proportionally higher compared to the level of global acute malnutrition. As can be seen from Table-1, this could be due to other factors such as high prevalence of illnesses among children under-five (62.3%), significant number of households accessing their water from unprotected source (26.8%) and poor hygiene 14.0% have reported to be unable to use soap in the past month and 11.7% with no toilet facilities. Table-2: Trends of Acute Malnutrition and Children Under-five Mortality in Dowa District Indicators 6 – 59 Months Jun-Jul 2002 (95%C. I.) Jan 2003* (95%C. I.) Feb 2004* (95%C. I.) P-value* Global Malnutrition Z score < -2/oedema 3.8% (2.3% - 5.3%) 4.5% (2.6% - 6.4%) 2.6% (1.4 – 4.7) <.05 Severe Malnutrition Z score < -3/oedema 1.0% (0.1% - 1.8%) 1.1% (0.1% - 2.0%) 0.7% (-0.1 – 1.0) NS Under-five Mortality Per 10,000/day 1.18 1.57 (0.99 – 2.15) 0.46 (0.07 – 1.66) <.05 - P-value less than 0.05 indicate a statistical significant difference between the two periods. Mortality and Orphan hood: Crude and under-five child mortality rates were 0.22 per 10,000 per day and 0.46 per 10,000 per day, which is low compared to the same period under-five mortality rate of 1.57 per 10,000 per day last year. This could be perhaps due to the decentralized management of acute malnutrition using the CTC approach. The prevalence of Orphanhood (1.1%) was low compared to Nkhotakota district (4.8%). With this rate, about 1,100 children under-five are estimated to be orphans in Dowa district based on the projected district population figure of 469,924. Morbidity: Overall prevalence of childhood illness (62.3%) is very high with fever and diarrhoea contributing to 35.1% and 15.9% of the childhood illnesses respectively(See Table 6). Generally there is a seasonal increase in febrile and diarrhoeal diseases during the period of the survey. Immunization: Vaccination and vitamin A supplementation are currently good in the district. As in Table 1 and Annex 1 BCG, measles and vitamin A supplementation coverage are 95.8%, 78.4% and 79.4% respectively. The success of the immunization programme is due, perhaps, to the decentralized modality of service provision using existing primary health structures. We can capitalize on the efforts accrued thus far by immunization programmes if we are able to integrate health service delivery such as EPI plus and delivery of essential drugs with decentralized management of acute malnutrition. Chronic Malnutrition and Household Economy: Stunting (61.2%) and underweight (30.5%) rates are very high indicating extreme level of poverty that prevails in the district. These results are consistent with the high prevalence of childhood illnesses, inadequate dietary intake and HH level food insecurity indicators found in the district including 1) Poor Dietary Intake: About 64.6% of young children eat their meal once or twice per day. 2) Childhood Illness: More than half of under-five children suffer one or more ailments in the past two weeks period 3) Ownership of assets: 56.8% of HHs reported having chickens, 6.2% cows, 16.3% pigs, 8.2% ox-cart and 20.2% of respondents having no shoes. 4) Water and sanitation: 26.8% of HHs access water from unprotected source and 11.7% of HHs are without a toilet facility. There was no indication that there was alarming levels of acute malnutrition that could be considered as emergency. However, there was a seasonal food stress which most households are coping by resorting to market. About 51.0% of households sourced their staple (maize) from the market. However, the seasonal (‘normal’) food stress is evident by the fact that 65.2% of households
  • 6. Concern Worldwide/Nutrition Survey, Dowa, 17th to 25th of February, 2004 6 are buying their staple by entering in to ‘Ganyu’ labour and 16.7% of young children eating one meal per day. On the other hand, a significant number of households considered the prospects of the next harvest as precarious, that is, 23.3% of households expect to source their staple from market and exchange in the coming three months. INTRODUCTION Background: Dowa district is located in Central region of the Malawi, bordered by Lilongwe in the South, by Kasungu in the north, Ntchisi and Salima in the east. The administrative center Dowa Boma is located some 52 km from Lilongwe the capital and covers an area of 2,770 sq km (Dowa District Socio-economic Profile, 2002). It is further divided into 7 Traditional Authority (TAs), namely Dzoole, Mkukula, Kayembe, Chakhaza, Mponela, Chiwere and Msakambewa (see map in annex 2). The population is 469,924 as per the projections of the NSO 1998 census; with a population density of 135 persons per km2 making it the one of the most densely populated district in the central region whose average is 114 persons per km2 . The population annual growth rate is estimated at 3.55% greater than the 1.98% national average2. People in the district mainly depend on agriculture with a limited contribution from livestock (See Annex-1 for livestock ownership). There are two seasons; wet and dry seasons. The wet season occurs between November and April/May and the dry season between May to October. The main food crops produced in the district are maize, cassava, sweet potatoes, Irish white potatoes, groundnuts, beans, Soya beans, leaf vegetables and fruits like oranges and bananas and the main cash crops are tobacco, paprika and legumes3. DOWA is considered as one of the poorest districts in the central region with 49.8% of HHs living below the average national poverty line (NSO and IFPRI, 2002). Concern Worldwide began work in 2002 in response to the food crisis with two programmes, namely general food aid and community therapeutic care (CTC) to address special nutritional needs of vulnerable groups. The food aid programme was phased out in 2003 following what is considered to be a relatively good harvest. The CTC programme has been operational to date and was designed to manage acute malnutrition in 17 health centres and 3 NRUs currently implemented by MoH and CHAM partners. Survey Objectives: • Determine prevalence of acute malnutrition for children 6-59 months across district. • Determine prevalence of chronic malnutrition for children 6-59 months across district. • Determine mortality rates and major causes of death in children under-five across district with in a period of 3 months. • Determine morbidity patterns among children under-five years of age. • Help in programme planning, monitoring and implementation. METHODOLOGY Survey Design: A cross-sectional 30x30-cluster survey was conducted between 17h and 25th February, 2004 in Dowa district by Concern Worldwide in collaboration with Dowa DHO and CHAM. The tools employed to collect data in this survey, as per the Malawi Nutrition survey guideline, include anthropometric, household food security and mortality questionnaires. Some modifications were made to the household food security questionnaire to suit the objectives of this survey. The group village headman was the smallest administration unit where population figures could be found at district level. A two stage cluster survey was used based on a population sampling frame of 227 GVH. Thirty clusters were randomly selected by assigning probability proportional to population size. All data was analyzed using the EPI6 software and EPINUT. Flagged records that could not be cleaned by rechecking the data collection format were excluded from analysis. 2 Based on the 1998 population census report by NSO. 3 Dowa District Socio Economic Profile, December 2003, Decentralization Office.
  • 7. Concern Worldwide/Nutrition Survey, Dowa, 17th to 25th of February, 2004 7 Sampling Procedure: Based on the population figure by GVH obtained from the DHO, the cumulative population was calculated and a sampling interval determined for the under-five children population which is estimated at 20% of the total population. Thirty clusters were randomly selected by assigning probability proportional to population size. A total of 960 children under-five were measured for anthropometry (30 clusters constituting 32 children per cluster), out of which 9 records were flagged and excluded from analysis, leaving a total of 951 children as a sample size for the anthropometric survey. The sample size for the mortality survey was 900 HHs, corresponding to 4,544 individuals. Each household regardless of the presence of children under-five was interviewed using the mortality questionnaire. Training and Field Testing: One-day refreshment training was provided to enumerators from the DHO, CHAM, and Concern staff by Concern Worldwide nutritionist. A total of 6 teams composed of 5 members, including: team leader, registrar, interviewer and two measurers, were also given half day practical training in near by village. Selection of Villages, Households and Children: A village headman was selected randomly from a list of villages within a GVH and the centre of the village was located as the starting point. A direction was selected randomly by spinning a pen and houses in this direction to the end of the village were counted. One house was randomly selected and every subsequent household to the right direction of the first household was visited. If the edge of the village was reached before 30 children had been measured, the team returned to the centre and again selected a random direction. Mothers or any adult member of the household were interviewed. Those aged six to fifty-nine months were then measured. Where feasible, absent children were followed up with a second visit. All children meeting the inclusion criteria in the final household were measured. Data Collected: Children Anthropometric Questionnaire: • Age Children aged 6 - 59 months were then measured. In the absence of a card mothers verbal report was taken. • Weight 25kg Salter spring scale used, weight recorded to the nearest 100g. • Height Children <85cm measured lying down. > 85cm in standing position. Height was recorded with 0.1cm precision. • Oedema Only bilateral oedema was considered to be an indicator of malnutrition. Oedema was diagnosed by applying medium thumb pressure on the front of both shin or the upper side of the foot, for 3 seconds. Oedema was diagnosed if a bilateral depression remained after the pressure was released. • Weight Height Median Assessed using tables after each team arrived from field. All severely malnourished individuals were referred to nearest health centre, clinic or NRU where possible. Moderately malnourished individuals referred to Concern SFP where possible. Where referral was not possible teams offered some advice to the family on the status of the child and the need for additional appropriate nutrition. • Vaccination Respondents were asked to bring vaccination cards of the indexed child and in the absence of a card verbal confirmation were sought. • Morbidity Respondents were asked if their child had suffered from any of the listed symptoms in the last 2 weeks. • Breast Feeding Respondents asked if the indexed child is currently on breast feeding. • Feeding Programme Respondents were asked if the indexed child in currently enrolled in any of the following feeding programme; NRU, OTP, SFP, GR and other external feeding arrangements for the child. • Orphan hood Respondents asked if one or both parents of indexed child have deceased. Mortality Questionnaire: • No. of individuals in the household - After discussion with the survey teams on local norms and practices it was decided that this would be defined as the number of people who ‘normally’ share meals in the house and have done so for over 1 month period.
  • 8. Concern Worldwide/Nutrition Survey, Dowa, 17th to 25th of February, 2004 8 • Retrospective mortality (under 5 and total population) The total number of deaths during the previous 3 months was recorded retrospectively for all households and then the number of deaths of under 5’s recorded separately. Cause of death was recorded for under-5 deaths if known. • Household Food Security Questionnaire: Qualitative and quantitative information was collected on the current and future food security situation, asset ownership, coping mechanisms and water and sanitation conditions in the District. Data was collected, at every 4th household visited. • Quality Control: The quality of the survey was maintained by undertaking comprehensive training and field practice of the survey teams. Field Supervision visits provided a further check on procedures. All data sheets were checked at the end of the cluster by team leaders and at the end of the day by the survey supervisor. All flagged data were checked for errors of data entry by cross checking with the original record sheets and those that can not be cleaned were excluded from analysis. RESULTS AND DISCUSSION Distribution of the Sample by Age and Sex: As in Table 3, the sex distribution in the sample is more or less evenly distributed with a sex ratio of 0.94. The older age group (54 to 59) is less represented in the sample which typically happens in cluster nutrition surveys. Table 3: Distribution by age & sex of sample, Dowa District, Central Region Malawi AGE CLASS BOYS GIRLS TOTAL SEX RATIO N % N % N % 06-17 112 50.7% 109 49.3% 221 23.2% 1.03 18-29 109 44.5% 136 55.5% 245 25.8% 0.80 30-41 107 46.9% 121 53.1% 228 24.0% 0.88 42-53 100 51.8% 93 48.2% 193 20.3% 1.08 54-59 34 53.1% 30 46.9% 64 6.7% 1.13 TOTAL 462 48.6% 489 51.4% 951 100.0% 0.94 Under-five Children Nutritional Status: Acute Malnutrition: The prevalence of global acute malnutrition in Dowa district was estimated at 2.6 % with 95% CI between 1.4% and 4.7%. The mean WHZ was -0.07 which is lower than the Nkhotakota district (- 0.20) and the difference between the two means is significant at P < 0.004. As can be seen in Figure-1 there was also a significant decline in global acute malnutrition compared to 2003 at the same period but the decline in severe acute malnutrition was not found to be statistically significant (See also Table 2) .
  • 9. Concern Worldwide/Nutrition Survey, Dowa, 17th to 25th of February, 2004 9 Figure-1 Trends of Acute Malnutrition & U5MR in Dowa District 0 0.5 1 1.5 2 2.5 3 3.5 4 4.5 5 Jun-Jul 2002 Jan 2003* Feb 2004* GAM SAM U5MR The prevalence of global and severe acute malnutrition in the age group less than 29 month of age was higher indicating the early weaning period and its associated risks (See Table 4). The prevalence of GAM in the age group between 6 to 29 months was found to be 3.2% (95% CI: 1.4%- 6.7%) and SAM was1.1% (95% CI: 0.2%-3.7%). The only visible difference between the two districts was the fact that Dowa has a decentralized CTC programme covering the entire district and NKK have no such decentralized programme at the time of the survey and perhaps there might be also other factors related to food security and health contributing for such difference. Concern Worldwide and VALID experience in Dowa shows that such levels of acute malnutrition can be address on a long-term basis with in the existing primary health care structures. Thus, there is a need to continue the long-term management of acute malnutrition through the existing DHO and CHAM structures. However, there were challenges faced in the road to wards sustainable management of acute malnutrition including lack of resources at the DHO level, vigilance of primary health workers to take up nutrition as their routine duties, different expectations in the programme which started as NGO lead emergency response and the slow process to evolve in to a long-term community-based nutrition programme. According to the WHO classification of severity of acute malnutrition4, GAM of less than 5% is considered acceptable and hence the nutrition condition in Dowa is within an acceptable range. But the difficulty in using such classification is that, it does not take in to account the proportional disparity in the prevalence of oedema. It is known that oedema is strongly associated with high risk of mortality and the WHO classification does not indicate the degree or cut-off point at which nutrition interventions geared at management of severe acute malnutrition are deemed necessary. In deed it is very difficult to come up with one figure as a cut of point which could be applicable to different context and scenarios. Moreover, the WHO classification does not take in to account the specific root causes of malnutrition in every context. The WHO classification is useful in an emergency context to initiate rapid response but not in a context of chronic poverty like Malawi with > 60% of households living below a poverty line. In Malawi there is a trend of higher level of SAM compared to GAM levels. Unlike many countries, most surveys in Malawi have reported proportionally higher rates of SAM and that also most of the SAM cases are oedematous (Consolidated National Nutrition Survey Report, April-May 2003, UNICEF). This need, however to be further explored and it might possibly hints to the aetiology of oedema. Precluding oedema from the classification of severity of malnutrition in a country where most severely malnourished children are oedematous (85.7% of the sample children in this survey in Dowa were oedematous) limits addressing acute malnutrition on a long-term basis and hence reducing infant and child mortality. 4 The management of nutrition in major emergencies, WHO, 2000.
  • 10. Concern Worldwide/Nutrition Survey, Dowa, 17th to 25th of February, 2004 10 Such a disparity between severe and moderate acute malnutrition in Dowa might be due to the high prevalence of childhood illnesses (62.3%) such as diarrhoeal disease (15.9%), febrile including malaria (35.1%) and possibly HIV/AIDS and perhaps due to extreme dependency of households on starch diet like maize (96.9%) with little input from animal diet such as milk and milk products. Overall, the current global acute malnutrition rate (2.6%) in Dowa was lower compared to neighbouring district survey results in February 2004 in Nkhotakota (3.4%) by Concern Worldwide and in 2003 (3.9% in Lilongwe and 3.2% in Dedza districts) by interagency survey compiled in the Consolidated National Nutrition Survey Report by UNICEF. Table 4 Prevalence of acute malnutrition based on weight for height z-score Severe Moderate Normal <-3 STD >=-3&<-2 STD >=-2 STD OEDEMA Age N n % n % n % n % 06-17 221 0 0.0% 6 2.7% 214 96.8% 1 0.5% 18-29 245 1 0.4% 4 1.6% 237 96.7% 3 1.2% 30-41 228 0 0.0% 6 2.6% 221 96.9% 1 0.4% 42-53 193 0 0.0% 2 1.0% 190 98.4% 1 0.5% 54-59 64 0 0.0% 0 0.0% 64 100.0% 0 0.0% TOTAL 951 1 0.1% 18 1.9% 926 97.4% 6 0.6% The prevalence of acute malnutrition in Dowa using MUAC was estimated at 18.3 %( See Table 5) compared to 2.6% using weight-for-height z-score. Such a big difference will have an impact on programme design, mobilization of resources, managing and monitoring the programme. MUAC was used as one of the admission criteria in to the CTC programme and it is important to review the validity of this indices The data in this survey indicates the sensitivity (the ability of a test to detect true positives) and specificity (the ability of a test to detect true negatives) of MUAC to be 64.0% and 82.3% respectively assuming WHZ as golden criterion (See Table-5 below). This data supports the use of MUAC for screening at community levels using trained volunteers to identify majority of mothers who needs to stay at home(true negatives) and significantly minimize the disappointments of mothers whose children were unable to be admitted in to the programme using the golden standard. Some mothers do not understand why their own child is not admitted in to the programme especially when the mothers think the criteria of admission is poverty status. It is very difficult to convince poor mothers who travel an average of 20 kilometres that her child could not be admitted to the programme because the weight of the child is not as low as the few ones admitted to the programme. Concern Worldwide encourages screening mothers by volunteers using MUAC tape if possible before they come to the health centre but sustaining volunteer motivation in the district has proven to be a challenge. Table 5 Cross-tables of MUAC and WHZ among Children Under-five in Dowa District MUAC WHZ score < -2 z-score/Oedema >= -2 z score/no oedema Total < 13 cm 16 9.2% 64.0% 158 90.8% 17.1% 174 18.3% >= 13 cm 9 1.2% 36.0% 768 98.8% 82.9% 777 81.7% Total 25 2.6% 926 97.4% 951 100% However, the decision whether to use MUAC as admission criteria depends on the nature of every context; Infant and child mortality rates, distance mothers have to travel to the distribution site and
  • 11. Concern Worldwide/Nutrition Survey, Dowa, 17th to 25th of February, 2004 11 availability of resources. The data here shows positive correlation between MUAC and WHZ (See Figure-3) with Pearson correlation of r=0.71. In general the trend of the data indicates that there a need to use MUAC as screening criterion and carefully review its use as admission and discharge criteria. In an area where there is high infant and child mortality the benefit of using MUAC as admission criteria might outweighs especially in famine and disease outbreak situations. Figure-2: A graph showing the Sensitivity and Specificity of MUAC Chronic Malnutrition: Stunting levels is very high in Dowa district with prevalence of height-for-age being 61.2%, which is higher than the national prevalence of 49.0% (DHS, 2000). As in Figure 4, the curve for the sample children significantly deviates to the left from the reference children indicating high levels of stunting n the district. Similarly, the prevalence of underweight was 30.5%, which is higher than the national average of 25.4%(DHS, 2000). Consistent with this high level of stunting the district is characterized by food insecurity and poverty at household level. Ownership of assets such as livestock is extremely low making the household very vulnerable during a hunger season or when a shock occurs. The contribution of livestock to household economy in very minimal; only 5.4%, 6.2%, 16.3% and 34.2% of households own oxen, cow, pig and goat respectively. The high prevalence of chronic malnutrition in Dowa district requires a concerted effort of addressing root causes of poverty in the district. According to the 2002 NSO and IFPRI Malawi Poverty mapping survey, 49.8% of the people in Dowa live below the poverty line. Efforts to reduce and control childhood illnesses and extreme poverty have to go hand in hand with management of acute malnutrition in order to improve the wellbeing of the people in the district. MUAC 20 18 16 14 12 10 8 6 4 WHZ 3 2 1 0 -1 -2 -3 -4 r =.71 ‘True Positives’: Mal. cases by both indicators ‘False Positives’: Mal. cases by MUAC only
  • 12. Concern Worldwide/Nutrition Survey, Dowa, 17th to 25th of February, 2004 12 Figure-3: HAZ Comparisons of Dowa & Figure-4: WAZ Comparisons of Dowa & Reference Children Reference Children Figure-4: HAZ Comparisons of Dowa and Reference Children -5 0 5 10 15 20 25 -4.75 -4.25 -3.75 -3.25 -2.75 -2.25 -1.75 -1.25 -0.75 -0.25 0.25 0.75 1.25 1.75 2.25 2.75 3.25 3.75 4.25 Z-score Proportion Reference Sex Combined Boys Girls Figure-5: WAZ Comparisons of Dowa and Reference Children -5 0 5 10 15 20 25 -4.75 -4.25 -3.75 -3.25 -2.75 -2.25 -1.75 -1.25 -0.75 -0.25 0.25 0.75 1.25 1.75 2.25 2.75 3.25 3.75 4.25 Z-score Proportions Reference Sex Combined Boys Girls Morbidity: The overall prevalence of childhood illness (62.3%) was high in Dowa indicating the need to address febrile (35.1%), diarrhoeal illnesses (15.9%) and respiratory tract infections (7.5%). Generally there is a seasonal increase in febrile and diarrhoeal diseases during the period of the survey. This seems however inconsistent with the low prevalence of mortality found in the district and this could be attributed to the decentralized services of CTC and its significant impact in reducing child mortality. Morbidity among children under-five was significantly related with global acute malnutrition and underweight in DOWA. The association between diarrhoea and WHZ was significant at p<0.005 with RR of 2.98, which means children in Dowa district with diarrhoea were 3 times more likely to be wasted than children with no diarrhoea. The high prevalence of diarrhoeal illnesses could be due to water and sanitation problems, poor hygienic and child care practices. About 27%% of HHs reported sourcing their water from unprotected sources like river, lake, untreated tanker and unprotected well, and also about 36% of households use unsanitary toilet system such as bush and uncovered toilet or pits. Table 6: Prevalence of Selected Childhood Illnesses in Dowa District, Malawi, 2004 Type of Illnesses Prevalence 95% CI DHS 2000 n=949 Central Region Fever 35.1% 30.9% - 39.6% 43.6% RTI 7.5% 5.2% - 10.0% - Diarrhoea 15.9% 12.8% - 19.5% 9.1% Others 10.4% 7.9% - 13.6% - Overall morbidity: 62.3% 57.7% - 66.6% - Immunization: Immunization coverage for polio (93.0%), BCG (95.8%), measles (78.4%) and vitamin A (79.4%) were higher than the central region prevalence of 73.8%, 90.4%, 76.9% and 65.4% respectively. Moreover, 80.7% of HHs have shown vaccination card on request. This is high compared to 75.0% who showed vaccination card during 2000 Demographic & Health Survey. The success of immunization plus is perhaps in the relentless effort to decentralized EPI services, which is logistically very complex. We can capitalize on the efforts accrued by immunization programmes if we are able to integrate health service delivery with decentralized management of acute malnutrition using the existing structures.
  • 13. Concern Worldwide/Nutrition Survey, Dowa, 17th to 25th of February, 2004 13 Mortality: Mortality rates did not signify a crisis situation according to a USAID classification5. CMR as per the method used in emergency assessment (i.e. using cluster sampling expressed in number of deaths per 10,000 per day) was 0.22 deaths per 10,000 people per day. Similarly, Under-five Mortality Rate in DOWA was 0.46 per 10,000 per day, which is below the average for developing countries reported by USAID that is 1 death per 10,000 people per day. As in Table-2, Under-five Mortality rate has significantly declined from 1.57/10,000 in January 2003 to 0.46/10,000 in February 2004. This is perhaps due to the highly decentralized management acute malnutrition put in place using the CTC approach since July 2003 and also improved harvest during 2003. The CTC programme encompasses, in addition to the distribution specially design food for the severely and moderately malnourished children, a wide range of activities including distribution of routine drugs such as antibiotic, de-worming and micronutrient supplements and health education session focusing on the top causes of childhood morbidity and mortality in the programme area. These activities managed to maintain a very low mortality levels in the outpatient and inpatient therapeutic care. The mortality rate in the outpatient therapeutic care programme (OTP) at the time of the survey was 2.6% which is below the SPHERE minimum standard indicator of < 10%. Pelletier,1994 in his study indicated that malnutrition as an underlying factor contribute to more than 50% child mortality in about 28 developing countries selected for the study including Malawi. Thus the need for sustainable management of malnutrition side by side with other child survival programmes such as EPI and manage acute malnutrition on a sustainable basis is greater than ever. Despite the improvement attained thus far in other child survival programmes nutrition is totally neglected and seem to have no clear structure and owner in the existing government structures. It has been indicated in the UNICEF 2003 annual review that “nutrition is everywhere but no where”. Orphanhood: The prevalence of Orphanhood in DOWA was 1.1%. That is, about 1% of children under-five reported that one or both parents are deceased. This result is low compared to the prevalence of Orphanhood in Nkhotakota district but still can be considered as an alarming indicator of impeding social and health crisis. Using this rate, about 1,100 children under-five are estimated to be orphans. With the current HIV/AIDS prevalence of 14.33% nationally and 9.7% in the central Region (NAC Lead Work Group, 2003), orphan hood, as a proxy indicator for adult chronic illness such as HIV/AIDS, can become among the leading socio-economic and health problems in the district if not addressed properly. Household Food Security: The staple crop in the district is maize with 96.9% of households reporting maize as their current staple during the hunger season. On the other hand cash crops such as tobacco are commonly grown by farmers. Around 67% households reported planting tobacco of which 38% reported having planted their own entire field with tobacco only. Contrary to our expectation a strong association was found between malnutrition and tobacco growing. Households who planted a large proportion of their land with tobacco in Dowa district were at high risk of having malnourished children. Households who planted tobacco in 2003 were 5 times more likely to have wasted children than households who did not plant tobacco in the same year. Similarly the risk ratio for household who planted tobacco in 2004 were 2.66 with 95% CI 0.32 < RR < 21.89, that is households who planted tobacco this year had three times more likely to have acutely malnourished child than households that did not plant tobacco. Tobacco growing was also strongly associated with underweight and this could be perhaps due to the fact that households who relied totally on tobacco becomes very vulnerable to food stress especially when the market price of tobacco is low. On the other hand, households that do not diversify their crop are more likely to depend on market to source their food during hunger season. Such households could be in precarious situation for two reasons; market price of staple food usually increases during hunger season and households’ access to cash is limited during hunger season compared to post-harvest 5 According to this classification, CMR less than 1.0 is considered not critical and the average CMR for developing countries is reported to be 0.27 deaths per 10,000 people per day (USAID, 2000)
  • 14. Concern Worldwide/Nutrition Survey, Dowa, 17th to 25th of February, 2004 14 season. For farmers to make the best out of cash corps continued efforts are necessary to promote appropriate management of post-harvest and diversify crop production and household economy. A total reliance on tobacco by itself can also pose threats to poor households who tend to sell their goods at low price determine by corporate organizations. The HH food security situation during the survey period is characterized by seasonal food stress which is normal during the lean months of December to April. A significant number of HHs seem to have coped with the food stress using the normal coping mechanism such as seasonal wild food (15.6%) and resorting to markets to access staple food (51.0%) of which 65.2%) of the resource to buy food come from ‘ganyu’ labour and a significant number of children, pregnant and lactating women was in the CTC programme; there were 57 children in the NRU, 291 in the OTP and 1,481 in the SFP and 170 in pregnant and lactating mothers in the programme during the survey period in Dowa). Only a small proportion of households (3.1%) shifted their staple from maize to cassava compared to 18.8% in Nkhotakota this is perhaps due to the fact that cassava as a staple is less commonly used in Dowa compared to Nkhotakota district and also the availability of decentralized SFP in 17 Health centre-based distribution sites reaching nutritionally vulnerable groups could have minimized the need to shift to other staple. Overall, there was no indication of an alarming HH food security crisis with 96.9 % households still using maize as their staple during the current hunger season, of which 44% were sourcing this staple from own production. This is consistent with the low prevalence of global acute malnutrition. There is a clear indication, however that most people live in very poor HHs characterized by little or no assets and poor living condition. About 43.2% of HHs have reported having no chicken, no shoes (20.2%) and no radio (47.9%), only 16.3% have pigs and less than 10% HHs have ox-cart, treadle pump and cows (Table1 and annex 1). The HH economy is fragile and will not be able to cope with a major shock between now and the next harvest. The next harvest appears to be in poor standing compared to last year harvest as per the prospect indicated by most HHs. Households reported the rain fall for this season has started late and ended earlier than usual. CONCLUSION Overall, the current nutrition condition (wasting) in Dowa District is lower than last year about the same period. Global acute malnutrition and severe acute malnutrition rates were 2.6% and 0.7% respectively. The prevalence of global and severe acute malnutrition among the high risk age group (6 – 29 months of age) were 3.2% and 1.1% respectively. This requires a continued effort through the CTC programme, which addresses the root causes of malnutrition on a long-term basis and at the same time manage acute malnutrition to contribute significantly to child survival in the district. Prevalence of stunting (61.2%) and underweight (30.5%) were very high and was consistent with household economy indicators such as ownership of assets and living conditions. The high prevalence of chronic malnutrition in Dowa district requires a concerted effort of addressing the root causes of poverty on a sustainable basis.
  • 15. Concern Worldwide/Nutrition Survey, Dowa, 17th to 25th of February, 2004 15 RECOMMENDATIONS I. Continue the community-based nutrition programme in Dowa district that will address and manage acute malnutrition on a sustainable basis at community level through a CTC approach. II. Continue to advocate for the sustainable management of acute malnutrition using existing MoH structures at all levels. III. Incorporate projects that aim at controlling and preventing childhood illnesses with the existing CTC programme. IV. Continue to promote crop diversification projects through the livelihood programme. V. Continue to promote various appropriate methods of post-harvest management including improved local storage facilities and post-harvest resource management skills. VI. Design water and sanitation projects at a community level that will address the prevailing WATSAN problems in the next budget year. VII. Create managerial, supervision and logistical capacity for the CTC partners in order to successfully roll out the programme to partners. VIII. Monitor the nutrition condition in the district twice per annum (one in the post-harvest period and the other in the pre-harvest period) IX. Actively involve MoH and CHAM at all levels in the planning and implementation of the CTC roll out. X. Continue to monitor the CTC programme though a small and efficient CTC monitoring team which will continue to provide technical support and undertake assessments including nutrition survey in collaboration with the partners. XI. Concern Worldwide Nutrition Programme should continue to identify resources though potential donors and link them with its implementation partners.
  • 16. Concern Worldwide/Nutrition Survey, Dowa, 17th to 25th of February, 2004 16 Annex 1: Summary of Findings of the DOWA Nutrition Survey, February 2004 Variables Prop. /Mean 95% CI N Variables Prop. /Mean 95% CI N I. Household Economy, Coping strategies and Demographic Indicators: Under-five children in the population 21.2% 19.5%-22.9% 951 Use of Wild Food 15.6% 10.0%-23.3% 257 Sex Proportion of sampled children Male Female 48.6% 44.1%-53.2% 951 Household with Bicycle ownership 43.2% 34.6%-52.2% 257 51.4% 46.8%-56.0% 951 Household with Radio ownership 52.1% 43.2%-61.0% 257 Respondents Male Female 15.2% 9.7%-22.8% 257 Houses with corrugated Iron roof 10.5% 6.0%-17.5% 257 84.8% 77.2%-90.3% 257 Household with Hoe ownership 98.1% 93.4%-99.6% 257 Female Headed Households* 19.7% 13.0%-28.7% 218 Household with Axe ownership 67.3% 58.4%-75.2% 257 Average Family size(Mean) 5.05 4.9 – 5.2 900 Household with ‘Motondo’ 42.8% 34.2%-51.8% 257 Under-five household composition: Two Three One Four 26.2% 22.3%-30.6% 900 Households with ‘Panga’ 63.8% 54.8%-72.0% 257 2.1% 1.1%-4.0% 900 People with shoe 79.8% 71.6%-86.1% 257 47.2% 42.5%-51.9% 900 Household with watering can 56.8% 47.8%-65.4% 257 0.2% 0.01%-1.4% 900 Household with oxen 5.4% 2.4%-11.3% 257 Current(Jan-Feb) staple food Maize Cassava 96.9% 91.7%-99.0% 256 Households with ownership of Bed 11.3% 6.6%-18.4% 257 3.1% 1.0%-8.3% 256 Household with ox cart 8.2% 4.3%-14.7% 257 Household with treadle pump 2.7% 0.8%-7.7% 257 Current Major source of staple Own product Bought Business Exchange 44.0% 35.3%-53.0% 257 Household with grass made door 5.1% 2.2%-10.8% 257 51.0% 42.0%-59.8% 257 Household with pail 89.1% 82.1%-93.7% 257 1.2 0.1%-5.5% 257 Household with chicken 56.8% 47.8%-65.4% 257 3.5% 1.2%-8.8% 257 Household with pig 16.3% 10.6%-24.1% 257 Major source for buying staple ‘Ganyu’ Employment Small business Sales of Assets Sales of F/w/Charcoal Remittance 65.2% 52.5%-76.1% 135 Household with goat 34.2% 26.2%-43.2% 257 3.7% 0.8%-12.3% 135 Household with cow 6.2% 2.9%-12.3% 257 20.7% 12.2%-32.7% 135 Meals per day: young child Once Twice Three Four 16.7% 47.9% 34.6% 0.8% 10.9%-24.6% 39.0%-56.8% 26.6%-43.6% 0.04%-4.8% 257 257 257 257 7.4% 2.8%-12.1% 135 2.2% 0.3%-10.2% 135 0.7% -0.0 -7.9% 135 Planted Tobacco last year 53.1% 44.1%-62.0% 254 Meals per day for the family Once Twice Three 16.0% 64.2% 19.8% 10.3%-23.7% 55.2%-72.3% 13.5%-28.0% 257 257 257 % planted tobacco last year Quarter Half ¾ Quarter Whole 18.4% 10.6%-29.8% 141 Main staple food in July last year Maize Rice 99.6% 95.7%-100.0% 257 36.2% 25.3%-48.5% 141 0.4% -0.0%-4.3% 257 2.1% 0.3%-9.8% 141 % tobacco planted this year Quarter Half ¾ Quarter Whole 28.4% 19.6%-39.2% 176 43.3% 31.7%-55.6% 141 30.1% 21.0%-41.0% 176 Planted Tobacco this year 66.9% 58.0%-74.9% 254 3.4% 0.9%-10.3% 176 Percent household practicing Polygamy 15.5% 12.4%-19.1% 951 38.1% 28.1%-49.1% 176 Prospects of Next Harvest :Staple Maize 98.4% 93.9%-99.7% 257 Prospects: source: Own production 76.7% 68.2%-83.5% 257
  • 17. Concern Worldwide/Nutrition Survey, Dowa, 17th to 25th of February, 2004 17 Cassava Others 0.8% 0.04%-4.9% 257 Bought Exchange 21.4% 14.9%-29.7% 257 0.8% 0.04%-4.9% 257 0.8% 0.04%-4.9% 257 II. Mortality, Morbidity, malnutrition, Vaccination and Water and Sanitation indicators: Under five mortality rate (per 10,000 per day) 0.46 0.07 – 1.66 962 Major water source Borehole or pump 70.4% 61.6%-78.0% 257 Crud Mortality per 10,000 per day or (%) 0.22 0.06 – 0.51 4544 Protected well 1.2% 0.1%-5.5% 257 Under-five morbidity 62.3% 57.7%-66.6% 951 Unprotected well 20.2% 13.9%-28.4% 257 Percent of children with fever 35.1% 30.9%-39.6% 951 River/lake 6.2% 2.9%-12.3% 257 Percent of children with diarrheal 15.9% 12.8%-19.5% 951 Tap 1.6% 0.2%-6.1% 257 Percent of children with Respiratory Infect. 7.3% 5.2%-10.0% 951 Time in fetching water < 30 minutes 88.3% 81.1% - 93.1% 257 Global acute malnutrition 2.6% 1.4%-4.7% 951 30 – 60 min 10.1% 5.7% - 17.0% 257 Severe acute malnutrition 0.7% 0.2%-2.2% 951 60 – 120 min 1.6% 0.3% - 6.1% 257 Weight for Age (underweight) 30.5%. 26.4%-34.9% 951 > 120 min 0.0% 0.0% - 3.6% 257 Height-for-Age(stunting) 61.2% 56.6%-65.6% 951 Toilet use Bush Covered latrine Uncovered 11.7% 6.9%-18.8% 257 Prevalence of Oedema 0.6% 0.2%-2.0% 951 64.2% 55.2%-72.3% 257 Height-for-Age(stunting) 61.2% 56.6%-65.6% 951 24.1% 17.2%-32.6% 257 Mean weight-for-Height z-score -0.08 -0.14 to -0.02 951 Did you use soap during this month period 86.0% 78.5%-91.3% 257 Households visited by HSAs 40.1% 31.6%-49.1% 257 Percent of children < 1 year breastfed 84.2% 72.8%-91.6% 133 Vaccination card shown 80.7% 76.7%-84.0% 951 Percent of children > 1 and < 2 years breastfed 76.9% 65.9%-85.3% 160 Polio coverage 93.0% 90.2%-95.0% 951 Percent of children > 2 years breastfed 11.4% 8.1%-15.6% 616 Measles coverage 78.4% 74.4%-82.0% 951 BCG coverage 95.8% 93.5%-97.3% 951 Vitamin A supplementation 79.4% 75.4%-82.9% 951
  • 18. Concern Worldwide/Nutrition Survey, Dowa, 17th to 25th of February, 2004 18 Annex-2: Forms used for data collection Nutrition Survey - 6-59 months questionnaire District: _______________________ TA: ___________________ Cluster no: _______________ Date: _______________ Village/GVH: _______________________ Team Leader: _______________ HH ID Child ID Polygamy Age (mths) 6-59 mnths Sex (M/F) Weight (kg)* Height (cm) 65- 115cm ** WT/HT Oedema (Y/N) MUAC (cm) Vac. card (Y/N) Vaccination status Supp Morbidity (last 2 wks) B.feeding (Y/N) Currently Enrolled in Feeding prog Orphanage % Polio (Y/N) Measles (Y/N) BCG (Y/N) Vit. A (Y/N) ILL (Y/N) Fever (Y/N) Diarrhea (Y/N) RTI (Y/N) Other (Y/N) No=0,NRU=1,OTP=2, SFP=3,GR=4,Other=5 Y/N 1 2 3 4 5 6 7 8 9 10 11 12 13 14 15 16 17 18 19 20 21 22 23 24 25 26 27 28 29 30 * to nearest 0.1 kg ** to nearest 0.1cm
  • 19. Concern Worldwide/Nutrition Survey, Dowa, 17th to 25th of February, 2004 19 Date : …………………………………………………………………………...District:…………………………….. Cluster number:…………………………………………………………………TA :………………………… Team number:…………………………………………………………………..Village:……………………………… Household N° Total no in h/h Total no. children < 5yrs Total no. >5yrs in h/h Total no. deaths 1-59 months Causes of Death 1-59 months (1-9)* Total no. deaths >5yrs in h/h Causes of Death >5yrs in h/h (1-9)* TOTAL * 1=Diarrhoea; 2=Bloody Diarrhoea; 3=Measles; 4=Fever; 5=Cough with difficulty breathing; 6=Malnutrition; 7=Accident; 8=Other (please specify) 9=Unknown MORTALITY SURVEY (in the Past 90 days)
  • 20. Concern Worldwide/Nutrition Survey, Dowa, 17th to 25th of February, 2004 20 District : ___________________ TA: ____________________ Village/Cluster:______________ Cluster No:________ Date:_____________ Household ID: ___________ Team Leader:________________________ Question Answer (circle one or fill in spaces unless it is otherwise indicated) 1. What is the sex of the head of the household? 1=Male 2=Female 2. Is the interviewer the head of the household? 1=Yes 2=No 3. In the last week (7 days), how many meals per day did your family usually eat? 4. Have you been visited by an HSA in the past six months? 1=Yes 2=No 5. In the last 7 days, how many meals per day did the young children usually eat? 6. In the last 7 days, how many meals per day did you usually eat? 7. What was your main staple food in July last year (2003)? Specify “other”_______________________________________ 1=maize , 2=cassava, 3=rice, 4=sweet potato, 5=beans, 6=groundnuts 7=potato 8=other 8. What is your main staple food during this month in this year? Specify “other”_______________________________________ 1=maize , 2=cassava, 3=rice, 4=sweet potato, 5=beans, 6=groundnuts 7=potato 8=other 9. What is the main source of staple food during this month this year? Specify “other”_______________________________________ 1=Own production, 2=Bought food, 3=Food Aid, 4=Borrowed, 5=Gift food, 6=Exchange, 7=Other 10. If bought, what was the main source of money? 1=Ganyu 2=Employment 3=Business 4=Sale of assets 5=Sale of fire wood/charcoal 6=Remittance 7=Others 11. Did you plant tobacco last year? 1=yes 2=no 12. What was the proportion of land planted with tobacco last year? 1=Quarter 2=Half 3=Three- quarter 4=Whole 13. Do you currently plant tobacco in your field this year? 1=yes 2=no 14. What is the proportion of land planted with tobacco this year? 1=Quarter 2=Half 3=Three- quarter 4=Whole 15. What will the household’s main staple food be during the next 3 months? Specify “other”_______________________________________ 1=maize , 2=cassava, 3=rice, 4=sweet potato, 5=beans, 6=groundnuts 7=potato 8=other 16. What will the main source of staple food be during the next 3 months ? Specify “other”________________________________________ 1=Own production, 2=Bought food, 3=Food Aid, 4=Borrowed, 5=Gift food, 6=Exchange, 7=Other 17. Did you use wild food currently? 1=Yes 2=No
  • 21. Concern Worldwide/Nutrition Survey, Dowa, 17th to 25th of February, 2004 21 If yes, list in ascending order starting from the most commonly used ____________________________________________________ 18. Do you currently have one or more of the following assets in your household?( circle more than one as appropriate) 1=bicycle 8. Hoe 2=Radio 9. Axe 3=TV 10. Mtondo 4=Iron corrugated roof 11. Panga 5=Shoes 12. Watering can 6=Bed 13. Ox cart 7=grass door 14. Treadle pump 15= Pail 16.Others 19. Do you own one of the following animals in your house? If Others, Specify ____________________________________ 1=Chicken 2=Pigs 3=Goat/Sheep 4=Cow 5=Oxen 6=Others 20. What is the major water source for your household? Others, Specify ______________________________________ 1=Tap 2=Borehole/pump 3=Treated tanker 4=Untreated tanker 5=Protected well 6=Unprotected well 7=River/lake 8= Madambo 9= Others 21. How long will it take you to and from the major water to your house by foot (in minutes)? 22. Where do you usually go when you need to go to the toilet? 1=Bush 2=covered latrine 3=uncovered latrine 4=Flushing toilet 23. Did you use soap (washing/bathing) during this one month period? 1=yes 2=no
  • 22. Concern Worldwide/Nutrition Survey, Dowa, 17th to 25th of February, 2004 22 Annex 3 Maps of DOWA Showing Selected Clusters (VH), February, 2004
  • 23. Concern Worldwide/Nutrition Survey, Dowa, 17th to 25th of February, 2004 23