Downloaded 47 times
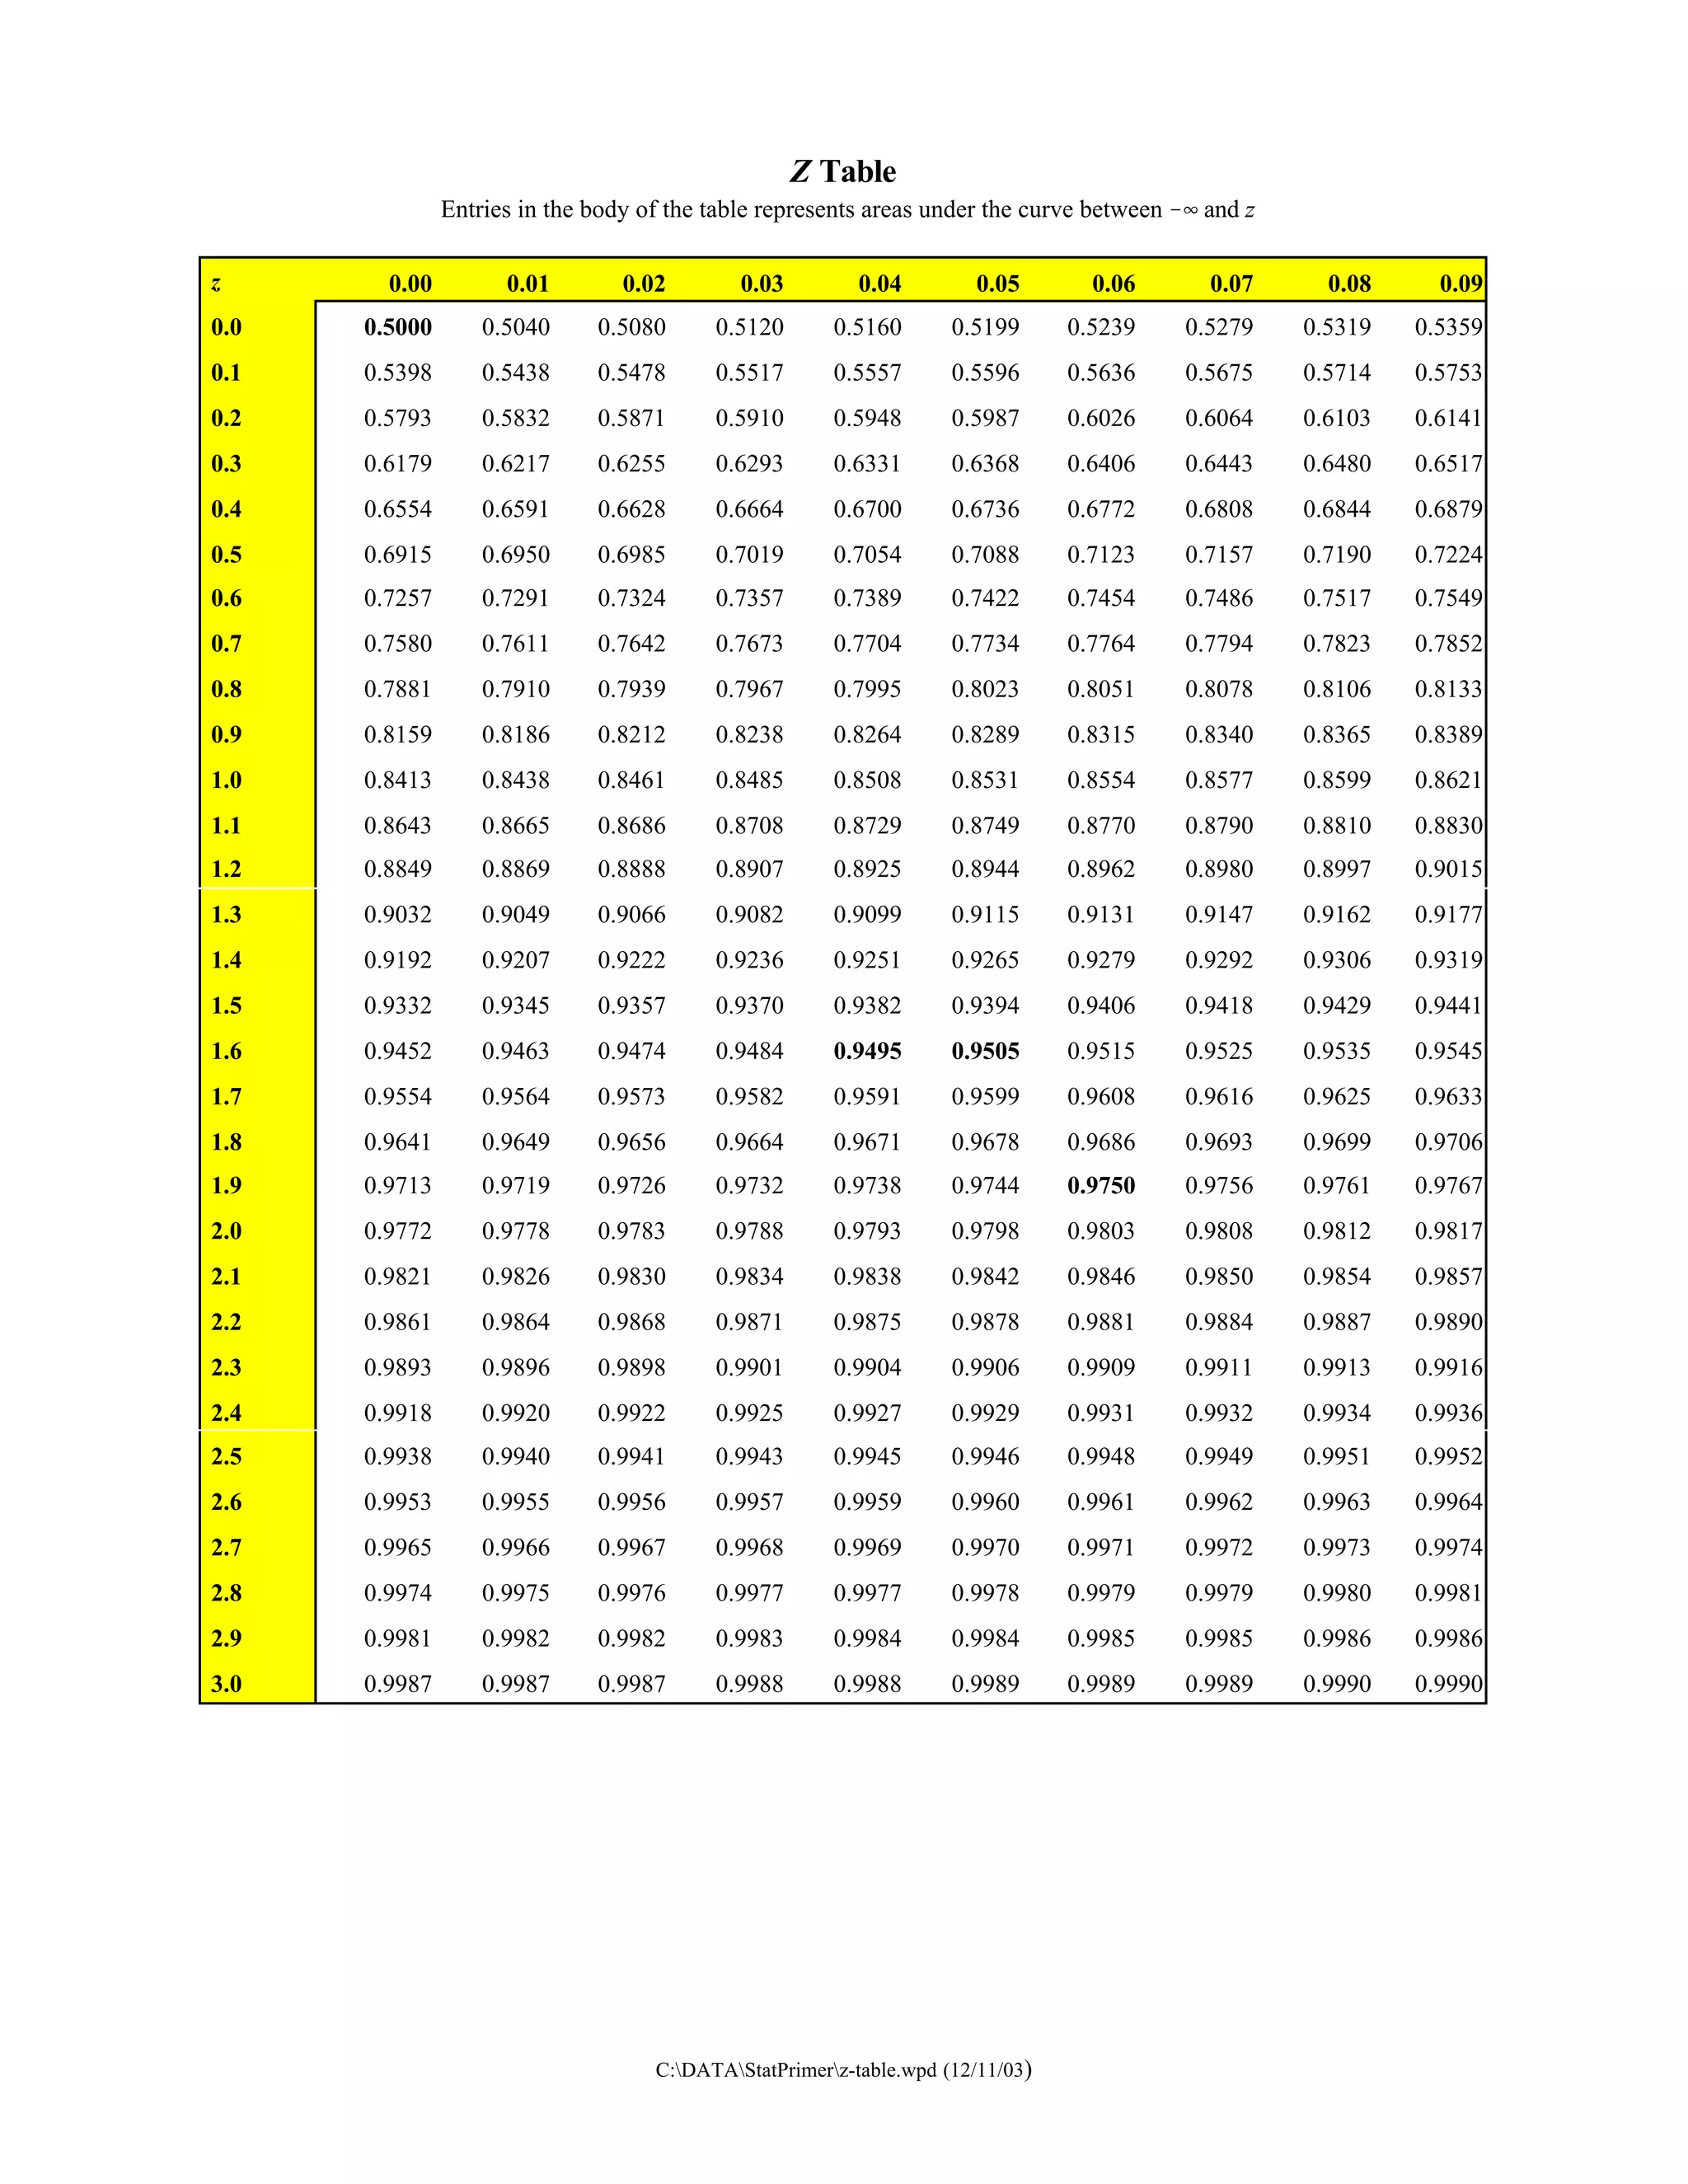

This document contains a z-table which lists the area under the normal curve for z-scores between -3 and 3. The table provides the proportion of the total area that lies between z=0 and the given z-score. For example, the area between z=0 and z=1 is 0.8413, meaning 84.13% of the total area lies within that range.


