Download as PPSX, PPTX
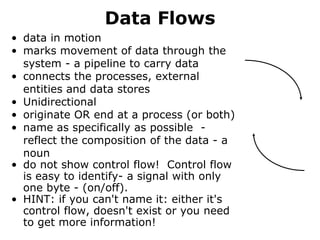
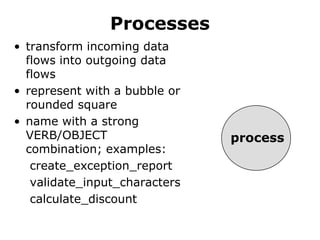
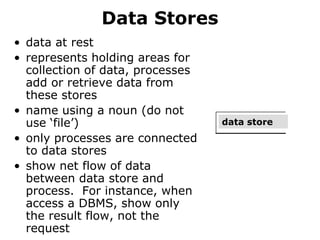
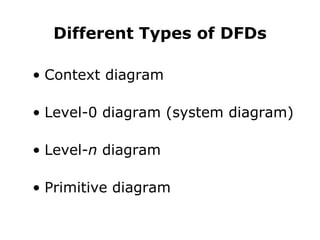
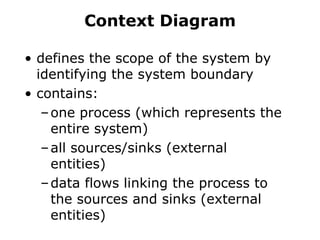
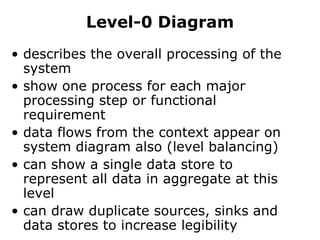
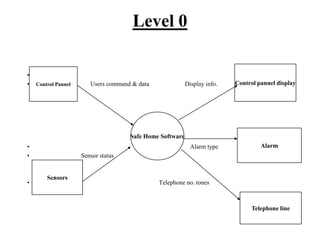
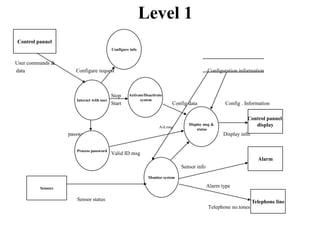
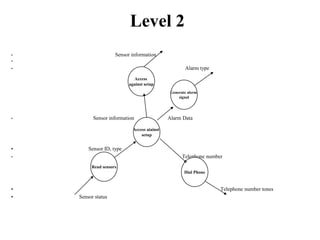


The document describes data flow diagrams (DFDs), including what they are, their purposes and uses, and the different types of DFDs. DFDs show the flow of data through a system and are used to model systems for requirements analysis, design, documentation and more. They contain processes, data stores, external entities and data flows. The different types of DFDs include context diagrams, level-0 diagrams, and more detailed lower-level diagrams.