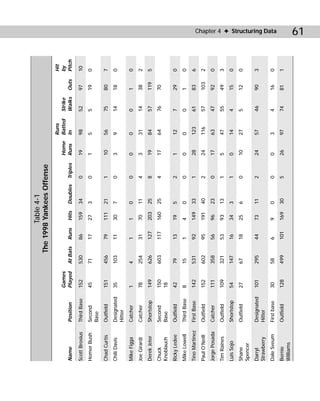
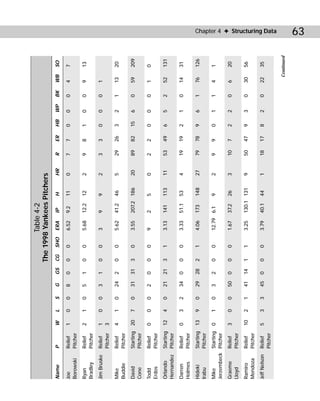
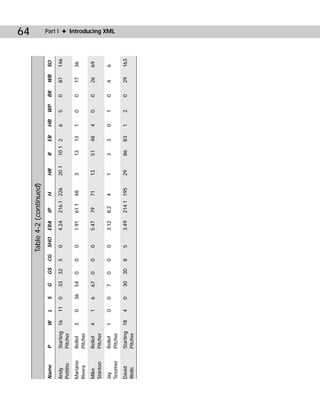
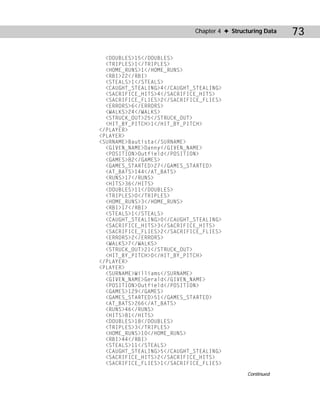
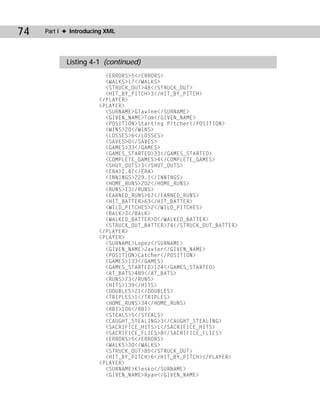
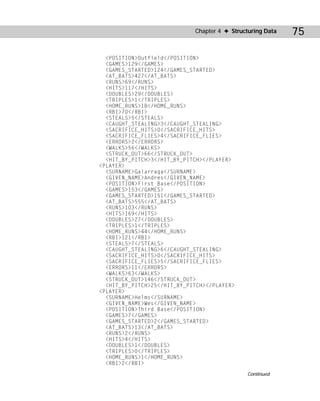
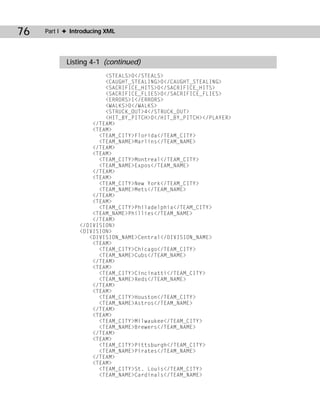
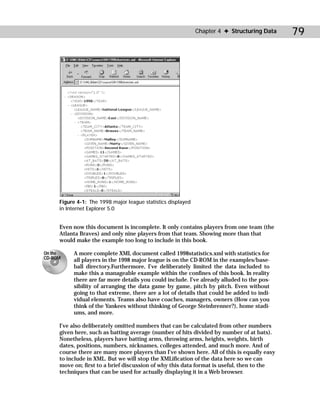
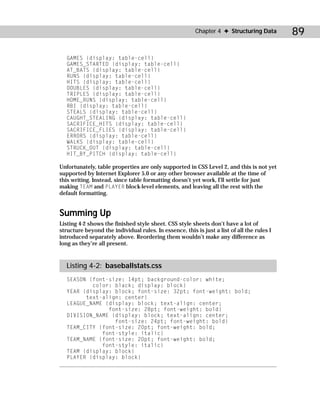
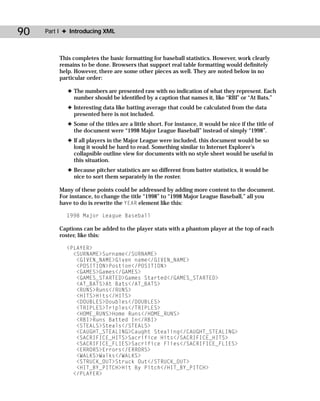
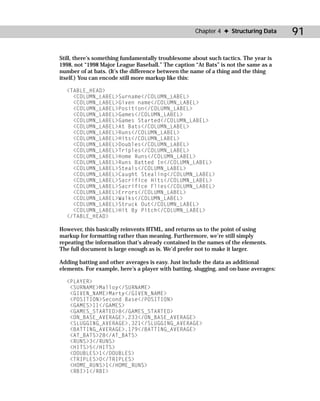
1. 4
CHAPTER
Structuring Data
✦ ✦ ✦ ✦
I n this chapter, we will develop a longer example that shows
In This Chapter
how a large list of baseball statistics and other similar data
might be stored in XML. A document like this has several
Examining the data
potential uses. Most obviously it can be displayed on a Web
page. It can also be used as input to other programs that want
XMLizing the data
to analyze particular seasons or lineup. Along the way, you’ll
learn, among other things, how to mark up the data in XML,
The advantages of
why XML tags are chosen, and how to prepare a CSS style
the XML format
sheet for a document.
Preparing a style
sheet for document
Examining the Data display
As I write this (October, 1998), the New York Yankees have just ✦ ✦ ✦ ✦
won their 24th World Series by sweeping the San Diego Padres
in four games. The Yankees finished the regular season with
an American League record 114 wins. Overall, 1998 was an
astonishing season. The St. Louis Cardinals’ Mark McGwire
and the Chicago Cubs’ Sammy Sosa dueled through September
for the record, previously held by Roger Maris, for most home
runs hit in a single season since baseball was integrated. (The
all-time major league record for home runs in a single season
is still held by catcher Josh Gibson who hit 75 home runs in
the Negro league in 1931. Admittedly, Gibson didn’t have to
face the sort of pitching Sosa and McGwire faced in today’s
integrated league. Then again neither did Babe Ruth who was
widely (and incorrectly) believed to have held the record until
Roger Maris hit 61 in 1961.)
What exactly made 1998 such an exciting season? A cynic
would tell you that 1998 was an expansion year with three
new teams, and consequently much weaker pitching overall.
This gave outstanding batters like Sosa and McGwire and
outstanding teams like the Yankees a chance to really shine
because, although they were as strong as they’d been in
1997, the average opponent they faced was a lot weaker. Of
course true baseball fanatics know the real reason, statistics.
2. 60 Part I ✦ Introducing XML
That’s a funny thing to say. In most sports you hear about heart, guts, ability,
skill, determination, and more. But only in baseball do the fans get so worked
up about raw numbers. Batting average, earned run average, slugging average,
on base average, fielding percentage, batting average against right handed pitch-
ers, batting average against left handed pitchers, batting average against right
handed pitchers when batting left-handed, batting average against right handed
pitchers in Cleveland under a full moon, and so on.
Baseball fans are obsessed with numbers; the more numbers the better. Every
season the Internet is host to thousands of rotisserie leagues in which avid
netizens manage teams and trade players with each other and calculate how
their fantasy teams are doing based on the real-world performance of the players
on their fantasy rosters. STATS, Inc. tracks the results of each and every pitch
made in a major league game, so it’s possible to figure out that one batter does
better than his average with men in scoring position while another does worse.
In the next two sections, for the benefit of the less baseball-obsessed reader, we will
examine the commonly available statistics that describe an individual player’s
batting and pitching. Fielding statistics are also available, but I’ll omit them to
restrict the examples to a more manageable size. The specific example I’m using is
the New York Yankees, but the same statistics are available for any team.
Batters
A few years ago, Bruce Bukiet, Jose Palacios, and myself, wrote a paper called “A
Markov Chain Approach to Baseball” (Operations Research, Volume 45, Number 1,
January-February, 1997, pp. 14-23, http://www.math.njit.edu/~bukiet/
Papers/ball.pdf). In this paper we analyzed all possible batting orders for all
teams in the 1989 National League. The results of that paper were mildly inter-
esting. The worst batter on the team, generally the pitcher, should bat eighth rather
than the customary ninth position, at least in the National League, but what
concerns me here is the work that went into producing this paper. As low grad
student on the totem pole, it was my job to manually re-key the complete batting
history of each and every player in the National League. That summer would have
been a lot more pleasant if I had had the data available in a convenient format like
XML. Right now, I’m going to concentrate on data for individual players. Typically
this data is presented in rows of numbers as shown in Table 4-1 for the 1998
Yankees offense (batters). Since pitchers rarely bat in the American League, only
players who actually batted are listed.
Each column effectively defines an element. Thus there need to be elements for
player, position, games played, at bats, runs, hits, doubles, triples, home runs, runs
batted in, and walks. Singles are generally not reported separately. Rather they’re
calculated by subtracting the total number of doubles, triples, and home runs from
the number of hits.
3. Table 4-1
The 1998 Yankees Offense
Runs Hit
Games Home Batted Strike by
Name Position Played At Bats Runs Hits Doubles Triples Runs In Walks Outs Pitch
Scott Brosius Third Base 152 530 86 159 34 0 19 98 52 97 10
Homer Bush Second 45 71 17 27 3 0 1 5 5 19 0
Base
Chad Curtis Outfield 151 456 79 111 21 1 10 56 75 80 7
Chili Davis Designated 35 103 11 30 7 0 3 9 14 18 0
Hitter
Mike Figga Catcher 1 4 1 1 0 0 0 0 0 1 0
Joe Girardi Catcher 78 254 31 70 11 4 3 31 14 38 2
Derek Jeter Shortstop 149 626 127 203 25 8 19 84 57 119 5
Chuck Second 150 603 117 160 25 4 17 64 76 70
Knoblauch Base 18
Ricky Ledee Outfield 42 79 13 19 5 2 1 12 7 29 0
Mike Lowell Third Base 8 15 1 4 0 0 0 0 0 1 0
Tino Martinez First Base 142 531 92 149 33 1 28 123 61 83 6
Paul O’Neill Outfield 152 602 95 191 40 2 24 116 57 103 2
Jorge Posada Catcher 111 358 56 96 23 0 17 63 47 92 0
Tim Raines Outfield 109 321 53 93 13 1 5 47 55 49 3
Luis Sojo Shortstop 54 147 16 34 3 1 0 14 4 15 0
Shane Outfield 27 67 18 25 6 0 10 27 5 12 0
Spencer
Darryl Designated 101 295 44 73 11 2 24 57 46 90 3
Strawberry Hitter
Dale Sveum First base 30 58 6 9 0 0 0 3 4 16 0
Chapter 4 ✦ Structuring Data
Bernie Outfield 128 499 101 169 30 5 26 97 74 81 1
Williams
61
4. 62 Part I ✦ Introducing XML
The data in the previous table and the pitcher data in the next section is actually a
Note
somewhat limited list that only begins to specify the data collected on a typical
baseball game. There are a lot more elements including throwing arm, batting
arm, number of times the pitcher balked (rare), fielding percentage, college
attended, and more. However, I’ll stick to this basic information to keep the exam-
ples manageable.
Pitchers
Pitchers are not expected to be home-run hitters or base stealers. Indeed a pitcher
who can reach first on occasion is a surprise bonus for a team. Instead pitchers are
judged on a whole different set of numbers, shown in Table 4-2. Each column of this
table also defines an element. Some of these elements, such as name and position,
are the same for batters and pitchers. Others like saves and shutouts only apply to
pitchers. And a few — like runs and home runs — have the same name as a batter
statistic, but have different meanings. For instance, the number of runs for a batter
is the number of runs the batter scored. The number of runs for a pitcher is the
number of runs scored by the opposing teams against this pitcher.
Organization of the XML Data
XML is based on a containment model. Each XML element can contain text or
other XML elements called its children. A few XML elements may contain both
text and child elements, though in general this is bad form and should be avoided
wherever possible.
However, there’s often more than one way to organize the data, depending on your
needs. One of the advantages of XML is that it makes it fairly straightforward to
write a program that reorganizes the data in a different form. We’ll discuss this
when we talk about XSL transformations in Chapter 14.
To get started, the first question you’ll have to address is what contains what? For
instance, it is fairly obvious that a league contains divisions that contain teams that
contain players. Although teams can change divisions when moving from one city
to another, and players are routinely traded at any given moment in time, each
player belongs to exactly one team and each team belongs to exactly one division.
Similarly, a season contains games, which contain innings, which contain at bats,
which contain pitches or plays.
However, does a season contain leagues or does a league contain a season? The
answer isn’t so obvious, and indeed there isn’t one unique answer. Whether it
makes more sense to make season elements children of league elements or league
elements children of season elements depends on the use to which the data will be
put. You can even create a new root element that contains both seasons and
leagues, neither of which is a child of the other (though doing so effectively would
require some advanced techniques that won’t be discussed for several chapters
yet). You can organize the data as you like.
6. 64
Table 4-2 (continued)
Name P W L S G GS CG SHO ERA IP H HR R ER HB WP BK WB SO
Andy Starting 16 11 0 33 32 5 0 4.24 216.1 226 20 1 10 1 2 6 5 0 87 146
Pettitte Pitcher
Mariano Relief 3 0 36 54 0 0 0 1.91 61.1 48 3 13 13 1 0 0 17 36
Rivera Pitcher
Mike Relief 4 1 6 67 0 0 0 5.47 79 71 13 51 48 4 0 0 26 69
Stanton Pitcher
Jay Relief 1 0 0 7 0 0 0 3.12 8.2 4 1 3 3 0 1 0 4 6
Part I ✦ Introducing XML
Tessmer Pitcher
David Starting 18 4 0 30 30 8 5 3.49 214.1 195 29 86 83 1 2 0 29 163
Wells Pitcher
7. 65
Chapter 4 ✦ Structuring Data
Readers familiar with database theory may recognize XML’s model as essentially a
Note
hierarchical database, and consequently recognize that it shares all the disadvan-
tages (and a few advantages) of that data model. There are certainly times when a
table-based relational approach makes more sense. This example certainly looks
like one of those times. However, XML doesn’t follow a relational model.
On the other hand, it is completely possible to store the actual data in multiple
tables in a relational database, then generate the XML on the fly. Indeed, the larger
examples on the CD-ROM were created in that fashion. This enables one set of
data to be presented in multiple formats. Transforming the data with style sheets
provides still more possible views of the data.
Since my personal interests lie in analyzing player performance within a single
season, I’m going to make season the root of my documents. Each season will
contain leagues, which will contain divisions, which will contain players. I’m
not going to granularize my data all the way down to the level of individual
games, innings, or plays — because while useful — such examples would be
excessively long.
You, however, may have other interests. If you choose to divide the data in some
other fashion, that works too. There’s almost always more than one way to organize
data in XML. In fact, we’ll return to this example in several upcoming chapters
where we’ll explore alternative markup vocabularies.
XMLizing the Data
Let’s begin the process of marking up the data for the 1998 Major League season in
XML with tags that you define. Remember that in XML we’re allowed to make up the
tags as we go along. We’ve already decided that the fundamental element of our
document will be a season. Seasons will contain leagues. Leagues will contain
divisions. Divisions will contain teams. Teams contain players. Players will have
statistics including games played, at bats, runs, hits, doubles, triples, home runs,
runs batted in, walks, and hits by pitch.
Starting the Document: XML Declaration
and Root Element
XML documents may be recognized by the XML declaration. This is a processing
instruction placed at the start of all XML files that identifies the version in use. The
only version currently understood is 1.0.
<?xml version=”1.0”?>
Every good XML document (where the word good has a very specific meaning to be
discussed in the next chapter) must have a root element. This is an element that
completely contains all other elements of the document. The root element’s start
8. 66 Part I ✦ Introducing XML
tag comes before all other elements’ start tags, and the root element’s end tag
comes after all other element’s end tags. For our root element, we will use SEASON
with a start tag of <SEASON> and an end tag of </SEASON>. The document now
looks like this:
<?xml version=”1.0”?>
<SEASON>
</SEASON>
The XML declaration is not an element or a tag. It is a processing instruction.
Therefore, it does not need to be contained inside the root element, SEASON. But
every element we put in this document will go in between the <SEASON> start tag
and the </SEASON> end tag.
This choice of root element means that we will not be able to store multiple
seasons in a single file. If you want to do that, however, you can define a new root
element that contains seasons. For example,
<?xml version=”1.0”?>
<DOCUMENT>
<SEASON>
</SEASON>
<SEASON>
</SEASON>
</DOCUMENT>
Naming Conventions
Before we begin, I’d like to say a few words about naming conventions. As you’ll see in the
next chapter, XML element names are quite flexible and can contain any number of letters
and digits in either upper- or lowercase. You have the option of writing XML tags that look
like any of the following:
<SEASON>
<Season>
<season>
<season1998>
<Season98>
<season_98>
There are several thousand more variations. I don’t really care (nor does XML) whether you
use all uppercase, all lowercase, mixed-case with internal capitalization, or some other con-
vention. However, I do recommend that you choose one convention and stick to it.
9. 67
Chapter 4 ✦ Structuring Data
Of course we will want to identify which season we’re talking about. To do that, we
should give the SEASON element a YEAR child. For example:
<?xml version=”1.0”?>
<SEASON>
<YEAR>
1998
</YEAR>
</SEASON>
I’ve used indentation here and in other examples to indicate that the YEAR element
is a child of the SEASON element and that the text 1998 is the contents of the YEAR
element. This is good coding style, but it is not required. White space in XML is not
especially significant. The same example could have been written like this:
<?xml version=”1.0”?>
<SEASON>
<YEAR>1998</YEAR>
</SEASON>
Indeed, I’ll often compress elements to a single line when they’ll fit and space is at a
premium. You can compress the document still further, even down to a single line,
but with a corresponding loss of clarity. For example:
<?xml version=”1.0”?><SEASON><YEAR>1998</YEAR></SEASON>
Of course this version is much harder to read and understand which is why I didn’t
write it that way. The tenth goal listed in the XML 1.0 specification is “Terseness in
XML markup is of minimal importance.” The baseball example reflects this goal
throughout.
XMLizing League, Division, and Team Data
Major league baseball is divided into two leagues, the American League and
the National League. Each league has a name. The two names could be encoded
like this:
<?xml version=”1.0”?>
<SEASON>
<YEAR>1998</YEAR>
<LEAGUE>
<LEAGUE_NAME>National League</LEAGUE_NAME>
</LEAGUE>
<LEAGUE>
<LEAGUE_NAME>American League</LEAGUE_NAME>
</LEAGUE>
</SEASON>
10. 68 Part I ✦ Introducing XML
I’ve chosen to define the name of a league with a LEAGUE_NAME element, rather than
simply a NAME element because NAME is too generic and it’s likely to be used in
other contexts. For instance, divisions, teams, and players also have names.
Elements from different domains with the same name can be combined using
Cross-
Reference namespaces. Namespaces will be discussed in Chapter 18. However, even with
namespaces, you wouldn’t want to give multiple items in the same domain (for
example, TEAM and LEAGUE in this example) the same name.
Each league can be divided into east, west, and central divisions, which can be
encoded as follows:
<LEAGUE>
<LEAGUE_NAME>National League</LEAGUE_NAME>
<DIVISION>
<DIVISION_NAME>East</DIVISION_NAME>
</DIVISION>
<DIVISION>
<DIVISION_NAME>Central</DIVISION_NAME>
</DIVISION>
<DIVISION>
<DIVISION_NAME>West</DIVISION_NAME>
</DIVISION>
</LEAGUE>
<LEAGUE>
<LEAGUE_NAME>American League</LEAGUE_NAME>
<DIVISION>
<DIVISION_NAME>East</DIVISION_NAME>
</DIVISION>
<DIVISION>
<DIVISION_NAME>Central</DIVISION_NAME>
</DIVISION>
<DIVISION>
<DIVISION_NAME>West</DIVISION_NAME>
</DIVISION>
</LEAGUE>
The true value of an element depends on its parent, that is the elements that
contain it as well as itself. Both the American and National Leagues have an East
division but these are not the same thing.
Each division is divided into teams. Each team has a name and a city. For example,
data that pertains to the American League East can be encoded as follows:
<DIVISION>
<DIVISION_NAME>East</DIVISION_NAME>
<TEAM>
<TEAM_CITY>Baltimore</TEAM_CITY>
<TEAM_NAME>Orioles</TEAM_NAME>
</TEAM>
<TEAM>
<TEAM_CITY>Boston</TEAM_CITY>
11. 69
Chapter 4 ✦ Structuring Data
<TEAM_NAME>Red Sox</TEAM_NAME>
</TEAM>
<TEAM>
<TEAM_CITY>New York</TEAM_CITY>
<TEAM_NAME>Yankees</TEAM_NAME>
</TEAM>
<TEAM>
<TEAM_CITY>Tampa Bay</TEAM_CITY>
<TEAM_NAME>Devil Rays</TEAM_NAME>
</TEAM>
<TEAM>
<TEAM_CITY>Toronto</TEAM_CITY>
<TEAM_NAME>Blue Jays</TEAM_NAME>
</TEAM>
</DIVISION>
XMLizing Player Data
Each team is composed of players. Each player has a first name and a last name. It’s
important to separate the first and last names so that you can sort by either one.
The data for the starting pitchers in the 1998 Yankees lineup can be encoded as
follows:
<TEAM>
<TEAM_CITY>New York</TEAM_CITY>
<TEAM_NAME>Yankees</TEAM_NAME>
<PLAYER>
<GIVEN_NAME>Orlando</GIVEN_NAME>
<SURNAME>Hernandez</SURNAME>
</PLAYER>
<PLAYER>
<GIVEN_NAME>David</GIVEN_NAME>
<SURNAME>Cone</SURNAME>
</PLAYER>
<PLAYER>
<GIVEN_NAME>David</GIVEN_NAME>
<SURNAME>Wells</SURNAME>
</PLAYER>
<PLAYER>
<GIVEN_NAME>Andy</GIVEN_NAME>
<SURNAME>Pettitte</SURNAME>
</PLAYER>
<PLAYER>
<GIVEN_NAME>Hideki</GIVEN_NAME>
<SURNAME>Irabu</SURNAME>
</PLAYER>
</TEAM>
The tags <GIVEN_NAME> and <SURNAME> are preferable to the more obvious
Note
<FIRST_NAME> and <LAST_NAME> or <FIRST_NAME> and <FAMILY_NAME>.
Whether the family name or the given name comes first or last varies from culture
to culture. Furthermore, surnames aren’t necessarily family names in all cultures.
12. 70 Part I ✦ Introducing XML
XMLizing Player Statistics
The next step is to provide statistics for each player. Statistics look a little different
for pitchers and batters, especially in the American League in which few pitchers
bat. Below are Joe Girardi’s 1998 statistics. He’s a catcher so we use batting
statistics:
<PLAYER>
<GIVEN_NAME>Joe </GIVEN_NAME>
<SURNAME>Girardi</SURNAME>
<POSITION>Catcher</POSITION>
<GAMES>78</GAMES>
<GAMES_STARTED>76</GAMES_STARTED>
<AT_BATS>254</AT_BATS>
<RUNS>31</RUNS>
<HITS>70</HITS>
<DOUBLES>11</DOUBLES>
<TRIPLES>4</TRIPLES>
<HOME_RUNS>3</HOME_RUNS>
<RBI>31</RBI>
<STEALS>2</STEALS>
<CAUGHT_STEALING>4</CAUGHT_STEALING>
<SACRIFICE_HITS>8</SACRIFICE_HITS>
<SACRIFICE_FLIES>1</SACRIFICE_FLIES>
<ERRORS>3</ERRORS>
<WALKS>14</WALKS>
<STRUCK_OUT>38</STRUCK_OUT>
<HIT_BY_PITCH>2</HIT_BY_PITCH>
</PLAYER>
Now let’s look at the statistics for a pitcher. Although pitchers occasionally bat in
the American League, and frequently bat in the National League, they do so far less
often than all other players do. Pitchers are hired and fired, cheered and booed,
based on their pitching performance. If they can actually hit the ball on occasion
too, that’s pure gravy. Pitching statistics include games played, wins, losses, innings
pitched, earned runs, shutouts, hits against, walks given up, and more. Here are
Hideki Irabu’s 1998 statistics encoded in XML:
<PLAYER>
<GIVEN_NAME>Hideki</GIVEN_NAME>
<SURNAME>Irabu</SURNAME>
<POSITION>Starting Pitcher</POSITION>
<WINS>13</WINS>
<LOSSES>9</LOSSES>
<SAVES>0</SAVES>
<GAMES>29</GAMES>
<GAMES_STARTED>28</GAMES_STARTED>
<COMPLETE_GAMES>2</COMPLETE_GAMES>
<SHUT_OUTS>1</SHUT_OUTS>
13. 71
Chapter 4 ✦ Structuring Data
<ERA>4.06</ERA>
<INNINGS>173</INNINGS>
<HOME_RUNS>148</HOME_RUNS>
<RUNS>27</RUNS>
<EARNED_RUNS>79</EARNED_RUNS>
<HIT_BATTER>78</HIT_BATTER>
<WILD_PITCHES>9</WILD_PITCHES>
<BALK>6</BALK>
<WALKED_BATTER>1</WALKED_BATTER>
<STRUCK_OUT_BATTER>76</STRUCK_OUT_BATTER>
</PLAYER>
Terseness in XML Markup is of Minimal Importance
Throughout this example, I’ve been following the explicit XML principal that “Terseness in
XML markup is of minimal importance.” This certainly assists non-baseball literate readers
who may not recognize baseball arcana such as the standard abbreviation for a walk BB
(base on balls), not W as you might expect. If document size is truly an issue, it’s easy to
compress the files with zip or some other standard tool.
However, this does mean XML documents tend to be quite long, and relatively tedious to
type by hand. I confess that this example sorely tempts me to use abbreviations, clarity be
damned. If I were to do so, a typical PLAYER element might look like this:
<PLAYER>
<GIVEN_NAME>Joe</GIVEN_NAME>
<SURNAME>Girardi</SURNAME>
<P>C</P>
<G>78</G>
<AB>254</AB>
<R>31</R>
<H>70</H>
<DO>11</DO>
<TR>4</TR>
<HR>3</HR>
<RBI>31</RBI>
<BB>14</BB>
<SO>38</SO>
<SB>2</SB>
<CS>4</CS>
<HBP>2</HBP>
</PLAYER>
14. 72 Part I ✦ Introducing XML
Putting the XML Document Back Together Again
Until now, I’ve been showing the XML document in pieces, element by element.
However, it’s now time to put all the pieces together and look at the complete
document containing the statistics for the 1998 Major League season. Listing 4-1
demonstrates the complete XML document with two leagues, six divisions, thirty
teams, and nine players.
Listing 4-1: A complete XML document
<?xml version=”1.0”?>
<SEASON>
<YEAR>1998</YEAR>
<LEAGUE>
<LEAGUE_NAME>National League</LEAGUE_NAME>
<DIVISION>
<DIVISION_NAME>East</DIVISION_NAME>
<TEAM>
<TEAM_CITY>Atlanta</TEAM_CITY>
<TEAM_NAME>Braves</TEAM_NAME>
<PLAYER>
<SURNAME>Malloy</SURNAME>
<GIVEN_NAME>Marty</GIVEN_NAME>
<POSITION>Second Base</POSITION>
<GAMES>11</GAMES>
<GAMES_STARTED>8</GAMES_STARTED>
<AT_BATS>28</AT_BATS>
<RUNS>3</RUNS>
<HITS>5</HITS>
<DOUBLES>1</DOUBLES>
<TRIPLES>0</TRIPLES>
<HOME_RUNS>1</HOME_RUNS>
<RBI>1</RBI>
<STEALS>0</STEALS>
<CAUGHT_STEALING>0</CAUGHT_STEALING>
<SACRIFICE_HITS>0</SACRIFICE_HITS>
<SACRIFICE_FLIES>0</SACRIFICE_FLIES>
<ERRORS>0</ERRORS>
<WALKS>2</WALKS>
<STRUCK_OUT>2</STRUCK_OUT>
<HIT_BY_PITCH>0</HIT_BY_PITCH>
</PLAYER>
<PLAYER>
<SURNAME>Guillen</SURNAME>
<GIVEN_NAME>Ozzie </GIVEN_NAME>
<POSITION>Shortstop</POSITION>
<GAMES>83</GAMES>
<GAMES_STARTED>59</GAMES_STARTED>
<AT_BATS>264</AT_BATS>
<RUNS>35</RUNS>
<HITS>73</HITS>
20. 78 Part I ✦ Introducing XML
Listing 4-1 (continued)
<DIVISION_NAME>Central</DIVISION_NAME>
<TEAM>
<TEAM_CITY>Chicago</TEAM_CITY>
<TEAM_NAME>White Sox</TEAM_NAME>
</TEAM>
<TEAM>
<TEAM_CITY>Kansas City</TEAM_CITY>
<TEAM_NAME>Royals</TEAM_NAME>
</TEAM>
<TEAM>
<TEAM_CITY>Detroit</TEAM_CITY>
<TEAM_NAME>Tigers</TEAM_NAME>
</TEAM>
<TEAM>
<TEAM_CITY>Cleveland</TEAM_CITY>
<TEAM_NAME>Indians</TEAM_NAME>
</TEAM>
<TEAM>
<TEAM_CITY>Minnesota</TEAM_CITY>
<TEAM_NAME>Twins</TEAM_NAME>
</TEAM>
</DIVISION>
<DIVISION>
<DIVISION_NAME>West</DIVISION_NAME>
<TEAM>
<TEAM_CITY>Anaheim</TEAM_CITY>
<TEAM_NAME>Angels</TEAM_NAME>
</TEAM>
<TEAM>
<TEAM_CITY>Oakland</TEAM_CITY>
<TEAM_NAME>Athletics</TEAM_NAME>
</TEAM>
<TEAM>
<TEAM_CITY>Seattle</TEAM_CITY>
<TEAM_NAME>Mariners</TEAM_NAME>
</TEAM>
<TEAM>
<TEAM_CITY>Texas</TEAM_CITY>
<TEAM_NAME>Rangers</TEAM_NAME>
</TEAM>
</DIVISION>
</LEAGUE>
</SEASON>
Figure 4-1 shows this document loaded into Internet Explorer 5.0.
21. 79
Chapter 4 ✦ Structuring Data
Figure 4-1: The 1998 major league statistics displayed
in Internet Explorer 5.0
Even now this document is incomplete. It only contains players from one team (the
Atlanta Braves) and only nine players from that team. Showing more than that
would make the example too long to include in this book.
A more complete XML document called 1998statistics.xml with statistics for
On the
CD-ROM all players in the 1998 major league is on the CD-ROM in the examples/base-
ball directory.Furthermore, I’ve deliberately limited the data included to
make this a manageable example within the confines of this book. In reality
there are far more details you could include. I’ve already alluded to the pos-
sibility of arranging the data game by game, pitch by pitch. Even without
going to that extreme, there are a lot of details that could be added to indi-
vidual elements. Teams also have coaches, managers, owners (How can you
think of the Yankees without thinking of George Steinbrenner?), home stadi-
ums, and more.
I’ve also deliberately omitted numbers that can be calculated from other numbers
given here, such as batting average (number of hits divided by number of at bats).
Nonetheless, players have batting arms, throwing arms, heights, weights, birth
dates, positions, numbers, nicknames, colleges attended, and much more. And of
course there are many more players than I’ve shown here. All of this is equally easy
to include in XML. But we will stop the XMLification of the data here so we can
move on; first to a brief discussion of why this data format is useful, then to the
techniques that can be used for actually displaying it in a Web browser.
22. 80 Part I ✦ Introducing XML
The Advantages of the XML Format
Table 4-1 does a pretty good job of displaying the batting data for a team in a
comprehensible and compact fashion. What exactly have we gained by rewriting
that table as the much longer XML document of Example 4-1? There are several
benefits. Among them:
✦ The data is self-describing
✦ The data can be manipulated with standard tools
✦ The data can be viewed with standard tools
✦ Different views of the same data are easy to create with style sheets
The first major benefit of the XML format is that the data is self-describing. The
meaning of each number is clearly and unmistakably associated with the number
itself. When reading the document, you know that the 121 in <HITS>121</HITS>
refers to hits and not runs batted in or strikeouts. If the person typing in the
document skips a number, that doesn’t mean that every number after it is
misinterpreted. HITS is still HITS even if the preceding RUNS element is missing.
In Part II you’ll see that XML can even use DTDs to enforce constraints that certain
Cross-
Reference elements like HITS or RUNS must be present.
The second benefit to providing the data in XML is that it enables the data to be
manipulated in a wide range of XML-enabled tools, from expensive payware like
Adobe FrameMaker to free open-source software like Python and Perl. The data
may be bigger, but the extra redundancy allows more tools to process it.
The same is true when the time comes to view the data. The XML document can be
loaded into Internet Explorer 5.0, Mozilla, FrameMaker 5.5.6, and many other tools,
all of which provide unique, useful views of the data. The document can even be
loaded into simple, bare-bones text editors like vi, BBEdit, and TextPad. So it’s at
least marginally viewable on most platforms.
Using new software isn’t the only way to get a different view of the data either. In
the next section, we’ll build a style sheet for baseball statistics that provides a
completely different way of looking at the data than what you see in Figure 4-1.
Every time you apply a different style sheet to the same document you see a
different picture.
Lastly, you should ask yourself if the size is really that important. Modern hard
drives are quite big, and can a hold a lot of data, even if it’s not stored very
efficiently. Furthermore, XML files compress very well. The complete major league
1998 statistics document is 653K. However, compressing the file with gzip gets that
all the way down to 66K, almost 90 percent less. Advanced HTTP servers like Jigsaw
23. 81
Chapter 4 ✦ Structuring Data
can actually send compressed files rather than the uncompressed files so that
network bandwidth used by a document like this is fairly close to its actual
information content. Finally, you should not assume that binary file formats,
especially general-purpose ones, are necessarily more efficient. A Microsoft Excel
file that contains the same data as the 1998statistics.xml actually takes up 2.37 MB,
more than three times as much space. Although you can certainly create more
efficient file formats and encoding of this data, in practice that simply isn’t often
necessary.
Preparing a Style Sheet for Document Display
The view of the raw XML document shown in Figure 4-1 is not bad for some uses.
For instance, it allows you to collapse and expand individual elements so you see
only those parts of the document you want to see. However, most of the time you’d
probably like a more finished look, especially if you’re going to display it on the
Web. To provide a more polished look, you must write a style sheet for the
document.
In this chapter, we’ll use CSS style sheets. A CSS style sheet associates particular
formatting with each element of the document. The complete list of elements used
in our XML document is:
SEASON
YEAR
LEAGUE
LEAGUE_NAME
DIVISION
DIVISION_NAME
TEAM
TEAM_CITY
TEAM_NAME
PLAYER
SURNAME
GIVEN_NAME
POSITION
GAMES
GAMES_STARTED
AT_BATS
RUNS
24. 82 Part I ✦ Introducing XML
HITS
DOUBLES
TRIPLES
HOME_RUNS
RBI
STEALS
CAUGHT_STEALING
SACRIFICE_HITS
SACRIFICE_FLIES
ERRORS
WALKS
STRUCK_OUT
HIT_BY_PITCH
Generally, you’ll want to follow an iterative procedure, adding style rules for each of
these elements one at a time, checking that they do what you expect, then moving
on to the next element. In this example, such an approach also has the advantage of
introducing CSS properties one at a time for those who are not familiar with them.
Linking to a Style Sheet
The style sheet can be named anything you like. If it’s only going to apply to one
document, then it’s customary to give it the same name as the document but with
the three-letter extension .css instead of .xml. For instance, the style sheet for the
XML document 1998shortstats.xml might be called 1998shortstats.css. On the other
hand, if the same style sheet is going to be applied to many documents, then it
should probably have a more generic name like baseballstats.css.
Since CSS style sheets cascade, more than one can be applied to the same docu-
Cross-
Reference ment. Thus it’s possible that baseballstats.css would apply some general format-
ting rules, while 1998shortstats.css would override a few to handle specific details
in the one document 1998shortstats.xml. We’ll discuss this procedure in Chapter
12, Cascading Style Sheets Level 1.
To attach a style sheet to the document, you simply add an additional <?xml-
stylesheet?> processing instruction between the XML declaration and the root
element, like this:
<?xml version=”1.0” standalone=”yes”?>
<?xml-stylesheet type=”text/css” href=”baseballstats.css”?>
<SEASON>
...
25. 83
Chapter 4 ✦ Structuring Data
This tells a browser reading the document to apply the style sheet found in the file
baseballstats.css to this document. This file is assumed to reside in the same
directory and on the same server as the XML document itself. In other words,
baseballstats.css is a relative URL. Complete URLs may also be used. For example:
<?xml version=”1.0” standalone=”yes”?>
<?xml-stylesheet type=”text/css”
href=”http://metalab.unc.edu/xml/examples/baseballstats.css”?>
<SEASON>
...
You can begin by simply placing an empty file named baseballstats.css in the same
directory as the XML document. Once you’ve done this and added the necessary
processing instruction to 1998shortstats.xml (Listing 4-1), the document now
appears as shown in Figure 4-2. Only the element content is shown. The collapsible
outline view of Figure 4-1 is gone. The formatting of the element content uses the
browser’s defaults, black 12-point Times Roman on a white background in this case.
Figure 4-2: The 1998 major league statistics displayed after a blank
style sheet is applied
You’ll also see a view much like Figure 4-2 if the style sheet named by the xml-
Note
stylesheet processing instruction can’t be found in the specified location.
26. 84 Part I ✦ Introducing XML
Assigning Style Rules to the Root Element
You do not have to assign a style rule to each element in the list. Many elements
can simply allow the styles of their parents to cascade down. The most important
style, therefore, is the one for the root element, which is SEASON in this example.
This defines the default for all the other elements on the page. Computer monitors
at roughly 72 dpi don’t have as high a resolution as paper at 300 or more dpi.
Therefore, Web pages should generally use a larger point size than is customary.
Let’s make the default 14-point type, black on a white background, as shown below:
SEASON {font-size: 14pt; background-color: white;
color: black; display: block}
Place this statement in a text file, save the file with the name baseballstats.css in
the same directory as Listing 4-1, 1998shortstats.xml, and open 1998shortstats.xml
in your browser. You should see something like what is shown in Figure 4-3.
Figure 4-3: Baseball statistics in 14-point type with a black-on-
white background
The default font size changed between Figure 4-2 and Figure 4-3. The text color and
background color did not. Indeed, it was not absolutely required to set them, since
black foreground and white background are the defaults. Nonetheless, nothing is
lost by being explicit regarding what you want.
27. 85
Chapter 4 ✦ Structuring Data
Assigning Style Rules to Titles
The YEAR element is more or less the title of the document. Therefore, let’s make it
appropriately large and bold — 32 points should be big enough. Furthermore, it
should stand out from the rest of the document rather than simply running
together with the rest of the content, so let’s make it a centered block element. All
of this can be accomplished by the following style rule.
YEAR {display: block; font-size: 32pt; font-weight: bold;
text-align: center}
Figure 4-4 shows the document after this rule has been added to the style sheet.
Notice in particular the line break after “1998.” That’s there because YEAR is now a
block-level element. Everything else in the document is an inline element. You can
only center (or left-align, right-align or justify) block-level elements.
Figure 4-4: Stylizing the YEAR element as a title
In this document with this style rule, YEAR duplicates the functionality of HTML’s H1
header element. Since this document is so neatly hierarchical, several other
elements serve the role of H2 headers, H3 headers, etc. These elements can be
formatted by similar rules with only a slightly smaller font size.
For instance, SEASON is divided into two LEAGUE elements. The name of each
LEAGUE, that is, the LEAGUE_NAME element — has the same role as an H2 element in
HTML. Each LEAGUE element is divided into three DIVISION elements. The name of
28. 86 Part I ✦ Introducing XML
each DIVISION — that is, the DIVISION_NAME element — has the same role as an H3
element in HTML. These two rules format them accordingly:
LEAGUE_NAME {display: block; text-align: center; font-size:
28pt; font-weight: bold}
DIVISION_NAME {display: block; text-align: center; font-size:
24pt; font-weight: bold}
Figure 4-5 shows the resulting document.
Figure 4-5: Stylizing the LEAGUE_NAME and DIVISION_NAME
elements as headings
One crucial difference between HTML and XML is that in HTML there’s generally
Note
no one element that contains both the title of a section (the H2, H3, H4, etc.,
header) and the complete contents of the section. Instead the contents of a sec-
tion have to be implied as everything between the end of one level of header and
the start of the next header at the same level. This is particularly important for soft-
ware that has to parse HTML documents, for instance to generate a table of con-
tents automatically.
Divisions are divided into TEAM elements. Formatting these is a little trickier
because the title of a team is not simply the TEAM_NAME element but rather the
TEAM_CITY concatenated with the TEAM_NAME. Therefore these need to be inline
elements rather than separate block-level elements. However, they are still titles so
we set them to bold, italic, 20-point type. Figure 4-6 shows the results of adding
these two rules to the style sheet.
29. 87
Chapter 4 ✦ Structuring Data
TEAM_CITY {font-size: 20pt; font-weight: bold;
font-style: italic}
TEAM_NAME {font-size: 20pt; font-weight: bold;
font-style: italic}
Figure 4-6: Stylizing Team Names
At this point it would be nice to arrange the team names and cities as a combined
block-level element. There are several ways to do this. You could, for instance, add
an additional TEAM_TITLE element to the XML document whose sole purpose is
merely to contain the TEAM_NAME and TEAM_CITY. For instance:
<TEAM>
<TEAM_TITLE>
<TEAM_CITY>Colorado</TEAM_CITY>
<TEAM_NAME>Rockies</TEAM_NAME>
</TEAM_TITLE>
</TEAM>
Next, you would add a style rule that applies block-level formatting to TEAM_TITLE:
TEAM_TITLE {display: block; text-align: center}
However, you really should never reorganize an XML document just to make the
style sheet work easier. After all, the whole point of a style sheet is to keep
formatting information out of the document itself. However, you can achieve much
the same effect by making the immediately preceding and following elements block-
30. 88 Part I ✦ Introducing XML
level elements; that is, TEAM and PLAYER respectively. This places the TEAM_NAME
and TEAM_CITY in an implicit block-level element of their own. Figure 4-7 shows the
result.
TEAM {display: block}
PLAYER {display: block}
Figure 4-7: Stylizing team names and cities as headers
Assigning Style Rules to Player
and Statistics Elements
The trickiest formatting this document requires is for the individual players and
statistics. Each team has a couple of dozen players. Each player has statistics. You
could think of a TEAM element as being divided into PLAYER elements, and place
each player in his own block-level section as you did for previous elements.
However, a more attractive and efficient way to organize this is to use a table. The
style rules that accomplish this look like this:
TEAM {display: table}
TEAM_CITY {display: table-caption}
TEAM_NAME {display: table-caption}
PLAYER {display: table-row}
SURNAME {display: table-cell}
GIVEN_NAME {display: table-cell}
POSITION {display: table-cell}
31. 89
Chapter 4 ✦ Structuring Data
GAMES {display: table-cell}
GAMES_STARTED {display: table-cell}
AT_BATS {display: table-cell}
RUNS {display: table-cell}
HITS {display: table-cell}
DOUBLES {display: table-cell}
TRIPLES {display: table-cell}
HOME_RUNS {display: table-cell}
RBI {display: table-cell}
STEALS {display: table-cell}
CAUGHT_STEALING {display: table-cell}
SACRIFICE_HITS {display: table-cell}
SACRIFICE_FLIES {display: table-cell}
ERRORS {display: table-cell}
WALKS {display: table-cell}
STRUCK_OUT {display: table-cell}
HIT_BY_PITCH {display: table-cell}
Unfortunately, table properties are only supported in CSS Level 2, and this is not yet
supported by Internet Explorer 5.0 or any other browser available at the time of
this writing. Instead, since table formatting doesn’t yet work, I’ll settle for just
making TEAM and PLAYER block-level elements, and leaving all the rest with the
default formatting.
Summing Up
Listing 4-2 shows the finished style sheet. CSS style sheets don’t have a lot of
structure beyond the individual rules. In essence, this is just a list of all the rules I
introduced separately above. Reordering them wouldn’t make any difference as
long as they’re all present.
Listing 4-2: baseballstats.css
SEASON {font-size: 14pt; background-color: white;
color: black; display: block}
YEAR {display: block; font-size: 32pt; font-weight: bold;
text-align: center}
LEAGUE_NAME {display: block; text-align: center;
font-size: 28pt; font-weight: bold}
DIVISION_NAME {display: block; text-align: center;
font-size: 24pt; font-weight: bold}
TEAM_CITY {font-size: 20pt; font-weight: bold;
font-style: italic}
TEAM_NAME {font-size: 20pt; font-weight: bold;
font-style: italic}
TEAM {display: block}
PLAYER {display: block}
32. 90 Part I ✦ Introducing XML
This completes the basic formatting for baseball statistics. However, work clearly
remains to be done. Browsers that support real table formatting would definitely
help. However, there are some other pieces as well. They are noted below in no
particular order:
✦ The numbers are presented raw with no indication of what they represent. Each
number should be identified by a caption that names it, like “RBI” or “At Bats.”
✦ Interesting data like batting average that could be calculated from the data
presented here is not included.
✦ Some of the titles are a little short. For instance, it would be nice if the title of
the document were “1998 Major League Baseball” instead of simply “1998”.
✦ If all players in the Major League were included, this document would be so
long it would be hard to read. Something similar to Internet Explorer’s
collapsible outline view for documents with no style sheet would be useful in
this situation.
✦ Because pitcher statistics are so different from batter statistics, it would be
nice to sort them separately in the roster.
Many of these points could be addressed by adding more content to the document.
For instance, to change the title “1998” to “1998 Major League Baseball,” all you
have to do is rewrite the YEAR element like this:
1998 Major League Baseball
Captions can be added to the player stats with a phantom player at the top of each
roster, like this:
<PLAYER>
<SURNAME>Surname</SURNAME>
<GIVEN_NAME>Given name</GIVEN_NAME>
<POSITION>Postion</POSITION>
<GAMES>Games</GAMES>
<GAMES_STARTED>Games Started</GAMES_STARTED>
<AT_BATS>At Bats</AT_BATS>
<RUNS>Runs</RUNS>
<HITS>Hits</HITS>
<DOUBLES>Doubles</DOUBLES>
<TRIPLES>Triples</TRIPLES>
<HOME_RUNS>Home Runs</HOME_RUNS>
<RBI>Runs Batted In</RBI>
<STEALS>Steals</STEALS>
<CAUGHT_STEALING>Caught Stealing</CAUGHT_STEALING>
<SACRIFICE_HITS>Sacrifice Hits</SACRIFICE_HITS>
<SACRIFICE_FLIES>Sacrifice Flies</SACRIFICE_FLIES>
<ERRORS>Errors</ERRORS>
<WALKS>Walks</WALKS>
<STRUCK_OUT>Struck Out</STRUCK_OUT>
<HIT_BY_PITCH>Hit By Pitch</HIT_BY_PITCH>
</PLAYER>
33. 91
Chapter 4 ✦ Structuring Data
Still, there’s something fundamentally troublesome about such tactics. The year is
1998, not “1998 Major League Baseball.” The caption “At Bats” is not the same as a
number of at bats. (It’s the difference between the name of a thing and the thing
itself.) You can encode still more markup like this:
<TABLE_HEAD>
<COLUMN_LABEL>Surname</COLUMN_LABEL>
<COLUMN_LABEL>Given name</COLUMN_LABEL>
<COLUMN_LABEL>Position</COLUMN_LABEL>
<COLUMN_LABEL>Games</COLUMN_LABEL>
<COLUMN_LABEL>Games Started</COLUMN_LABEL>
<COLUMN_LABEL>At Bats</COLUMN_LABEL>
<COLUMN_LABEL>Runs</COLUMN_LABEL>
<COLUMN_LABEL>Hits</COLUMN_LABEL>
<COLUMN_LABEL>Doubles</COLUMN_LABEL>
<COLUMN_LABEL>Triples</COLUMN_LABEL>
<COLUMN_LABEL>Home Runs</COLUMN_LABEL>
<COLUMN_LABEL>Runs Batted In</COLUMN_LABEL>
<COLUMN_LABEL>Steals</COLUMN_LABEL>
<COLUMN_LABEL>Caught Stealing</COLUMN_LABEL>
<COLUMN_LABEL>Sacrifice Hits</COLUMN_LABEL>
<COLUMN_LABEL>Sacrifice Flies</COLUMN_LABEL>
<COLUMN_LABEL>Errors</COLUMN_LABEL>
<COLUMN_LABEL>Walks</COLUMN_LABEL>
<COLUMN_LABEL>Struck Out</COLUMN_LABEL>
<COLUMN_LABEL>Hit By Pitch</COLUMN_LABEL>
</TABLE_HEAD>
However, this basically reinvents HTML, and returns us to the point of using
markup for formatting rather than meaning. Furthermore, we’re still simply
repeating the information that’s already contained in the names of the elements.
The full document is large enough as is. We’d prefer not to make it larger.
Adding batting and other averages is easy. Just include the data as additional
elements. For example, here’s a player with batting, slugging, and on-base averages:
<PLAYER>
<SURNAME>Malloy</SURNAME>
<GIVEN_NAME>Marty</GIVEN_NAME>
<POSITION>Second Base</POSITION>
<GAMES>11</GAMES>
<GAMES_STARTED>8</GAMES_STARTED>
<ON_BASE_AVERAGE>.233</ON_BASE_AVERAGE>
<SLUGGING_AVERAGE>.321</SLUGGING_AVERAGE>
<BATTING_AVERAGE>.179</BATTING_AVERAGE>
<AT_BATS>28</AT_BATS>
<RUNS>3</RUNS>
<HITS>5</HITS>
<DOUBLES>1</DOUBLES>
<TRIPLES>0</TRIPLES>
<HOME_RUNS>1</HOME_RUNS>
<RBI>1</RBI>
34. 92 Part I ✦ Introducing XML
<STEALS>0</STEALS>
<CAUGHT_STEALING>0</CAUGHT_STEALING>
<SACRIFICE_HITS>0</SACRIFICE_HITS>
<SACRIFICE_FLIES>0</SACRIFICE_FLIES>
<ERRORS>0</ERRORS>
<WALKS>2</WALKS>
<STRUCK_OUT>2</STRUCK_OUT>
<HIT_BY_PITCH>0</HIT_BY_PITCH>
</PLAYER>
However, this information is redundant because it can be calculated from the other
information already included in a player’s listing. Batting average, for example, is
simply the number of base hits divided by the number of at bats; that is,
HITS/AT_BATS. Redundant data makes maintaining and updating the document
exponentially more difficult. A simple change or addition to a single element
requires changes and recalculations in multiple locations.
What’s really needed is a different style-sheet language that enables you to add
certain boiler-plate content to elements and to perform transformations on the
element content that is present. Such a language exists — the Extensible Style
Language (XSL).
Extensible Style Language (XSL) is covered in Chapters 5, 14, and 15.
Cross-
Reference
CSS is simpler than XSL and works well for basic Web pages and reasonably
straightforward documents. XSL is considerably more complex, but also more
powerful. XSL builds on the simple CSS formatting you’ve learned about here, but
also provides transformations of the source document into various forms the
reader can view. It’s often a good idea to make a first pass at a problem using CSS
while you’re still debugging your XML, then move to XSL to achieve greater
flexibility.
Summary
In this chapter, you saw examples demonstrating the creation of an XML document
from scratch. In particular you learned
✦ How to examine the data you’ll include in your XML document to identify the
elements.
✦ How to mark up the data with XML tags you define.
✦ The advantages XML formats provide over traditional formats.
✦ How to write a style sheet that says how the document should be formatted
and displayed.
35. 93
Chapter 4 ✦ Structuring Data
This chapter was full of seat-of-the-pants/back-of-the-envelope coding. The
document was written without more than minimal concern for details. In the next
chapter, we’ll explore some additional means of embedding information in XML
documents including attributes, comments, and processing instructions, and look
at an alternative way of encoding baseball statistics in XML.
✦ ✦ ✦