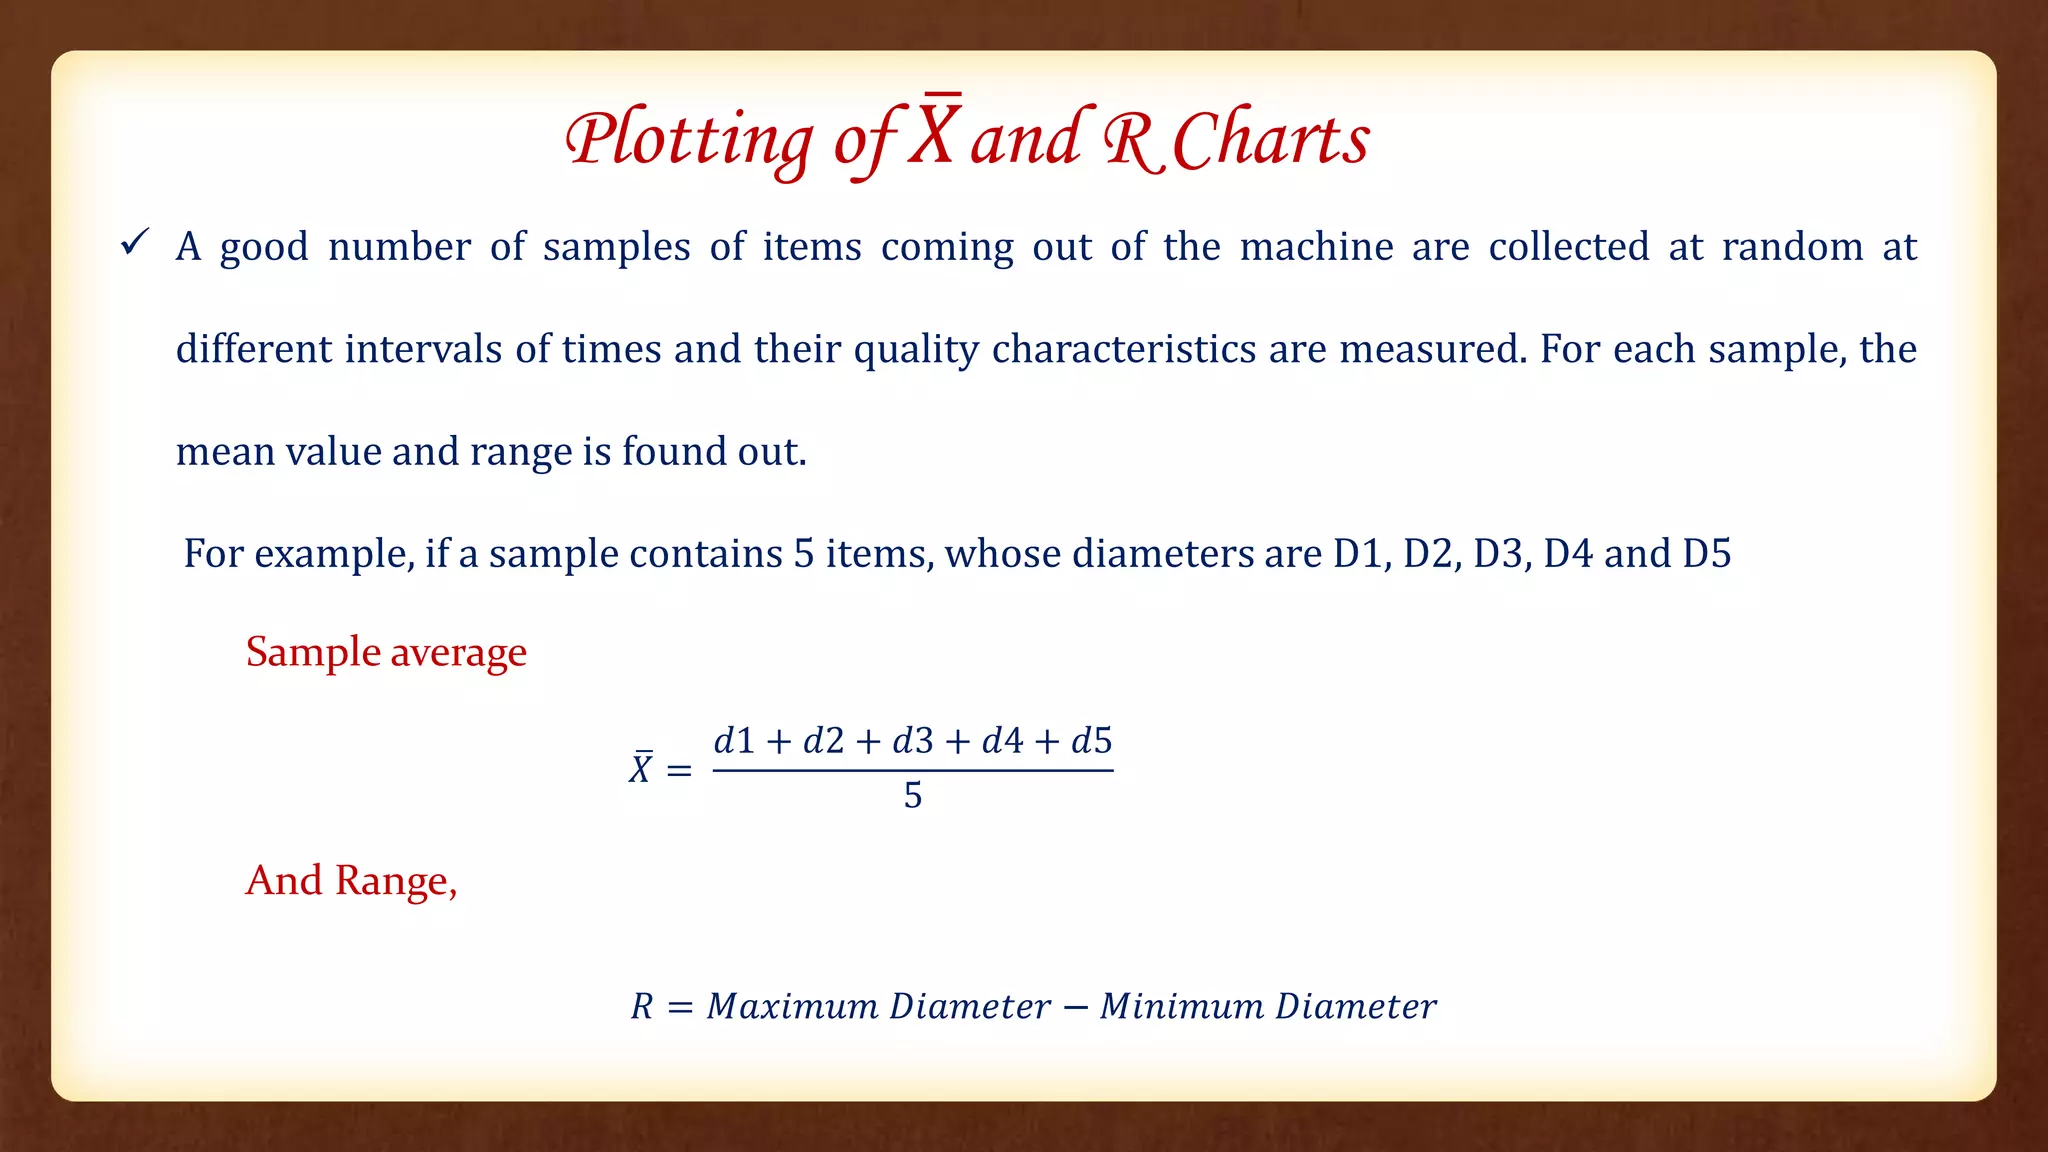
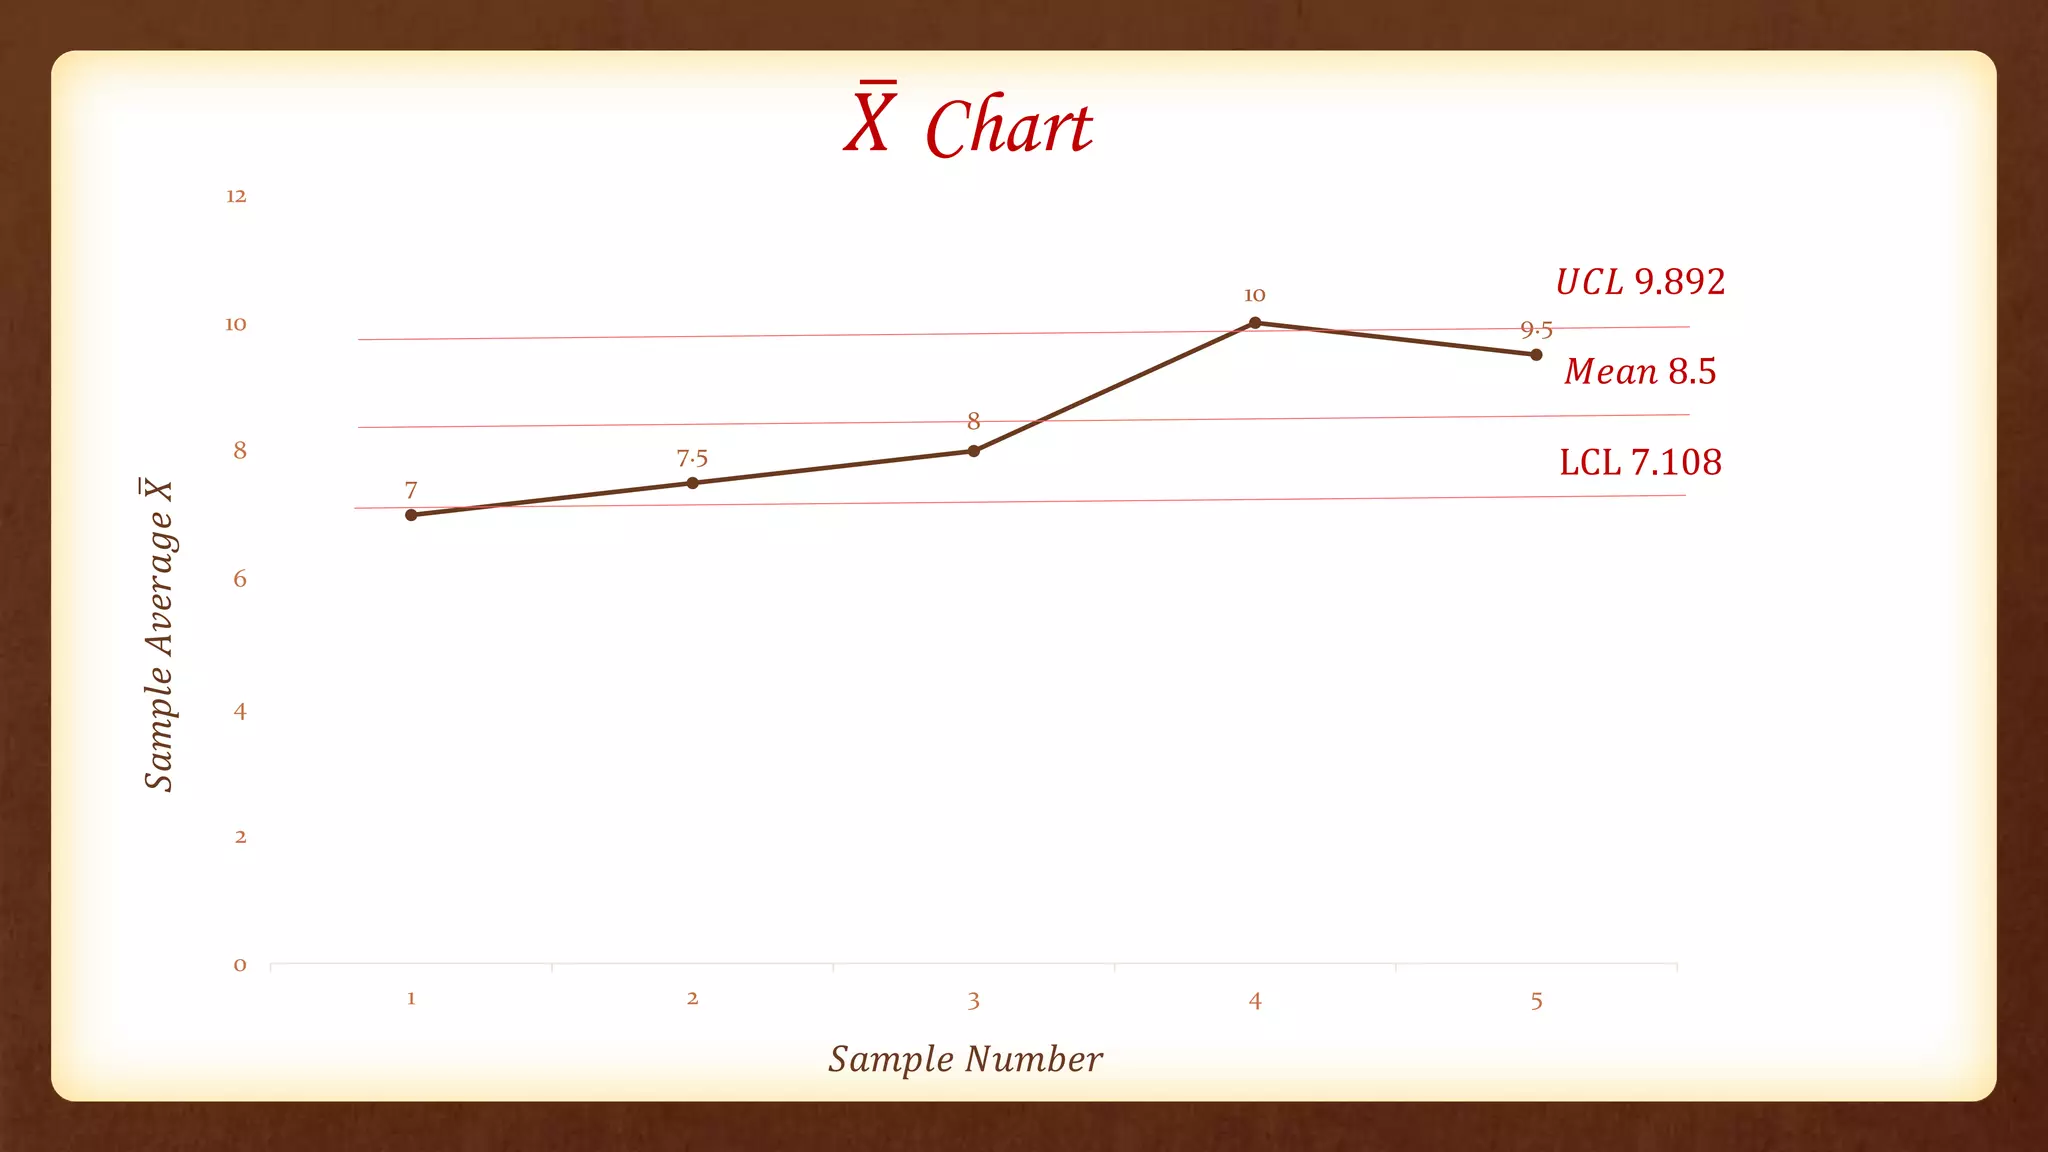
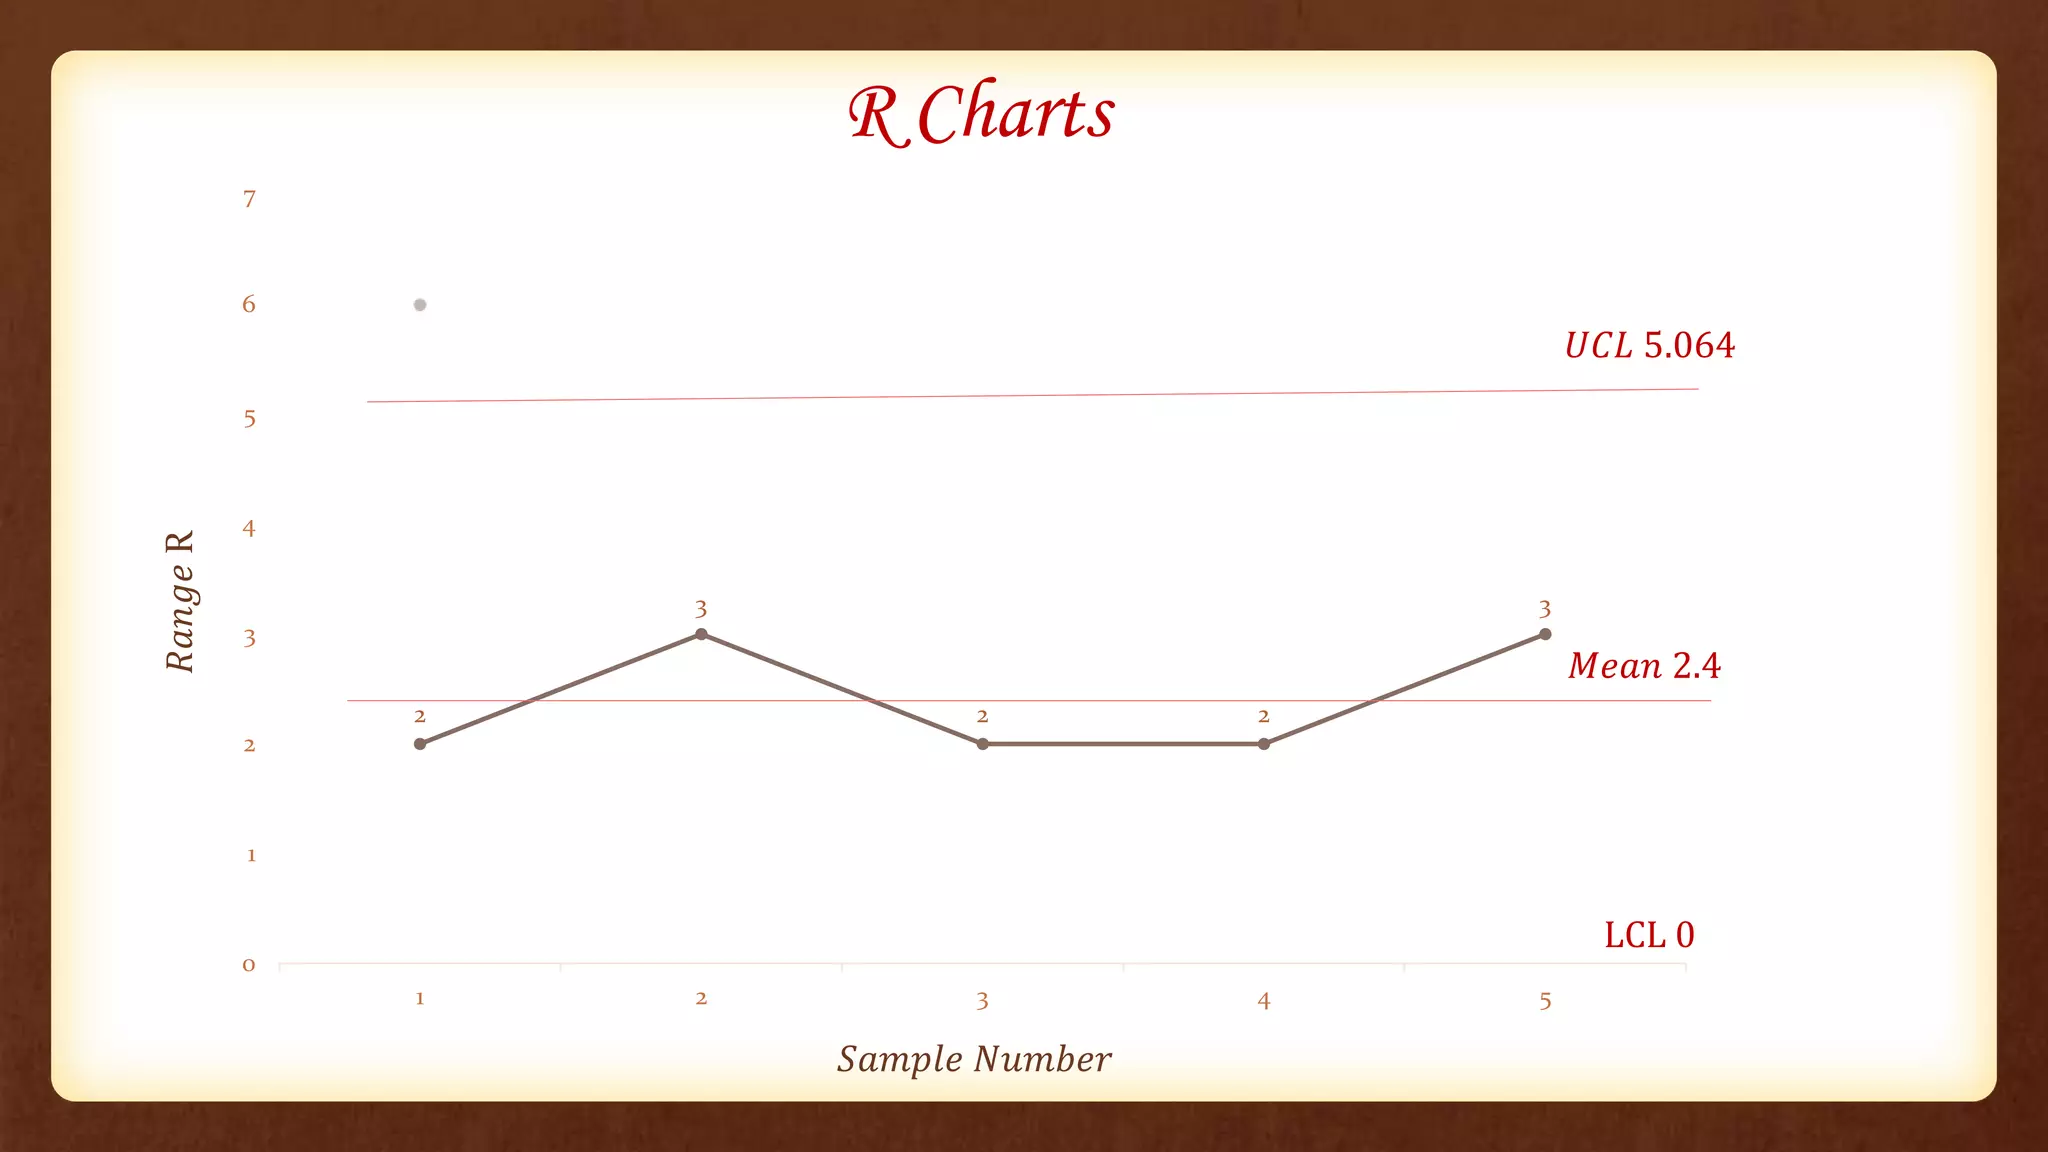
X Chart and R Chart
Dr. Kumar Abhishek
Assistant Professor
Department of Mechanical Engineering
IITRAM
& Control
 It shows changes in process average and is affected by changes in process variability.
 It is a chart for the measure of central tendency.
 It shows cyclic shifts in the process.
 It detects study progress changes, light tool wear.
 It is the most commonly used variables chart.
 𝑋 and R charts when used together form a powerful instrument for diagnosing quality
problems.
𝑋 Chart
R Chart
 It controls general variability of the process and is affected by changes in process
variability.
 It is a chart for measure of spread.
 It is generally used along with an 𝑋 chart.
 A good number of samples of items coming out of the machine are collected at random at
different intervals of times and their quality characteristics are measured. For each sample, the
mean value and range is found out.
For example, if a sample contains 5 items, whose diameters are D1, D2, D3, D4 and D5
𝑅 = 𝑀𝑎𝑥𝑖𝑚𝑢𝑚 𝐷𝑖𝑎𝑚𝑒𝑡𝑒𝑟 − 𝑀𝑖𝑛𝑖𝑚𝑢𝑚 𝐷𝑖𝑎𝑚𝑒𝑡𝑒𝑟
𝑋 =
𝑑1 + 𝑑2 + 𝑑3 + 𝑑4 + 𝑑5
5
Sample average
And Range,
Plotting of 𝑋and R Charts
Sample No. (Sample Size: 5) 𝑋 R
1 7.0 2
2 7.5 3
3 8.0 2
4 10.0 2
5 9.5 3
𝚺𝐗 = 𝟒𝟐. 𝟎 𝚺𝑹 = 𝟏𝟐
𝑋 =
𝛴𝑋
𝑁𝑜.𝑜𝑓 𝑆𝑎𝑚𝑝𝑙𝑒𝑠
=
42
5
= 8.5
𝑅 =
𝛴𝑅
𝑁𝑜.𝑜𝑓 𝑆𝑎𝑚𝑝𝑙𝑒𝑠
=
12
5
= 2.4
Plotting of 𝑋and R Charts
UCL= X + A2R
LCL= X − A2R
𝑈𝐶𝐿 = 𝐷4𝑅
𝐿𝐶𝐿 = 𝐷3𝑅
Upper Control Limit
Lower Control Limit
For R Chart
For 𝑋 Chart
Upper Control Limit
Lower Control Limit
Plotting of 𝑋and R Charts
Sample Size
(No. of items in a Sample)
A2
(Limit Average)
D3
(Range Lower Limit)
D4
(Range Upper Limit)
2 1.88 0 3.27
3 1.02 0 2.57
4 0.73 0 2.28
5 0.58 0 2.11
6 0.48 0 2.00
8 0.37 0.14 1.86
10 0.31 0.22 1.78
12 0.27 0.28 1.72
 The value of various factors (like A2, D4, D3) based on normal distribution can be found
from the following table:
For Sample Size 5
A2 = 0.58 D3 = 0 D4 = 2.11
Plotting of 𝑋and R Charts
UCL = X + A2R
= 8.5 + (0.58 * 2.4)
= 9.892
LCL = X − A2R
= 8.5 - (0.58 * 2.4)
= 7.108
UCL = 𝐷4𝑅
= 2.11 * 2.4
= 5.064
LCL = 𝐷3𝑅
= 0 * 2.4
= 0
Upper Control Limit
Lower Control Limit
For R Chart
For 𝑋 Chart
Upper Control Limit
Lower Control Limit
𝑋 Chart
7
7.5
8
10
9.5
0
2
4
6
8
10
12
1 2 3 4 5
𝑆𝑎𝑚𝑝𝑙𝑒 𝑁𝑢𝑚𝑏𝑒𝑟
LCL 7.108
𝑀𝑒𝑎𝑛 8.5
𝑈𝐶𝐿 9.892
R Charts
2
3
2 2
3
0
1
2
3
4
5
6
7
1 2 3 4 5
R
𝑆𝑎𝑚𝑝𝑙𝑒 𝑁𝑢𝑚𝑏𝑒𝑟
LCL 0
𝑀𝑒𝑎𝑛 2.4
𝑈𝐶𝐿 5.064
X chart and R chart.pptx

X chart and R chart.pptx

  • 1.
    X Chart andR Chart Dr. Kumar Abhishek Assistant Professor Department of Mechanical Engineering IITRAM & Control
  • 2.
     It showschanges in process average and is affected by changes in process variability.  It is a chart for the measure of central tendency.  It shows cyclic shifts in the process.  It detects study progress changes, light tool wear.  It is the most commonly used variables chart.  𝑋 and R charts when used together form a powerful instrument for diagnosing quality problems. 𝑋 Chart
  • 3.
    R Chart  Itcontrols general variability of the process and is affected by changes in process variability.  It is a chart for measure of spread.  It is generally used along with an 𝑋 chart.
  • 4.
     A goodnumber of samples of items coming out of the machine are collected at random at different intervals of times and their quality characteristics are measured. For each sample, the mean value and range is found out. For example, if a sample contains 5 items, whose diameters are D1, D2, D3, D4 and D5 𝑅 = 𝑀𝑎𝑥𝑖𝑚𝑢𝑚 𝐷𝑖𝑎𝑚𝑒𝑡𝑒𝑟 − 𝑀𝑖𝑛𝑖𝑚𝑢𝑚 𝐷𝑖𝑎𝑚𝑒𝑡𝑒𝑟 𝑋 = 𝑑1 + 𝑑2 + 𝑑3 + 𝑑4 + 𝑑5 5 Sample average And Range, Plotting of 𝑋and R Charts
  • 5.
    Sample No. (SampleSize: 5) 𝑋 R 1 7.0 2 2 7.5 3 3 8.0 2 4 10.0 2 5 9.5 3 𝚺𝐗 = 𝟒𝟐. 𝟎 𝚺𝑹 = 𝟏𝟐 𝑋 = 𝛴𝑋 𝑁𝑜.𝑜𝑓 𝑆𝑎𝑚𝑝𝑙𝑒𝑠 = 42 5 = 8.5 𝑅 = 𝛴𝑅 𝑁𝑜.𝑜𝑓 𝑆𝑎𝑚𝑝𝑙𝑒𝑠 = 12 5 = 2.4 Plotting of 𝑋and R Charts
  • 6.
    UCL= X +A2R LCL= X − A2R 𝑈𝐶𝐿 = 𝐷4𝑅 𝐿𝐶𝐿 = 𝐷3𝑅 Upper Control Limit Lower Control Limit For R Chart For 𝑋 Chart Upper Control Limit Lower Control Limit Plotting of 𝑋and R Charts
  • 7.
    Sample Size (No. ofitems in a Sample) A2 (Limit Average) D3 (Range Lower Limit) D4 (Range Upper Limit) 2 1.88 0 3.27 3 1.02 0 2.57 4 0.73 0 2.28 5 0.58 0 2.11 6 0.48 0 2.00 8 0.37 0.14 1.86 10 0.31 0.22 1.78 12 0.27 0.28 1.72  The value of various factors (like A2, D4, D3) based on normal distribution can be found from the following table: For Sample Size 5 A2 = 0.58 D3 = 0 D4 = 2.11 Plotting of 𝑋and R Charts
  • 8.
    Plotting of 𝑋andR Charts UCL = X + A2R = 8.5 + (0.58 * 2.4) = 9.892 LCL = X − A2R = 8.5 - (0.58 * 2.4) = 7.108 UCL = 𝐷4𝑅 = 2.11 * 2.4 = 5.064 LCL = 𝐷3𝑅 = 0 * 2.4 = 0 Upper Control Limit Lower Control Limit For R Chart For 𝑋 Chart Upper Control Limit Lower Control Limit
  • 9.
    𝑋 Chart 7 7.5 8 10 9.5 0 2 4 6 8 10 12 1 23 4 5 𝑆𝑎𝑚𝑝𝑙𝑒 𝑁𝑢𝑚𝑏𝑒𝑟 LCL 7.108 𝑀𝑒𝑎𝑛 8.5 𝑈𝐶𝐿 9.892
  • 10.
    R Charts 2 3 2 2 3 0 1 2 3 4 5 6 7 12 3 4 5 R 𝑆𝑎𝑚𝑝𝑙𝑒 𝑁𝑢𝑚𝑏𝑒𝑟 LCL 0 𝑀𝑒𝑎𝑛 2.4 𝑈𝐶𝐿 5.064