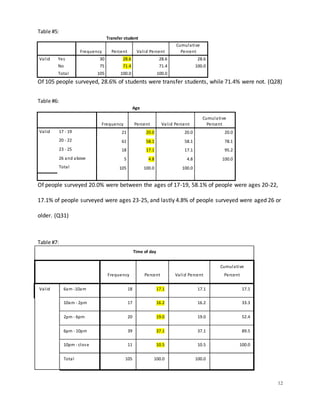
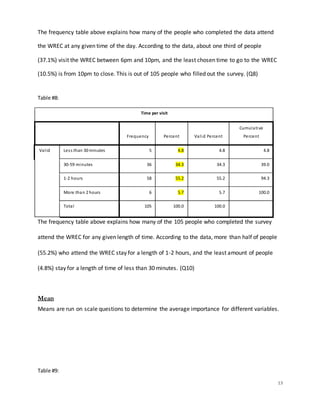
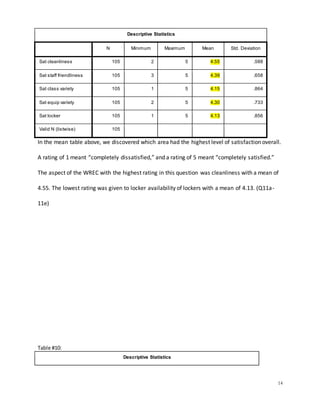
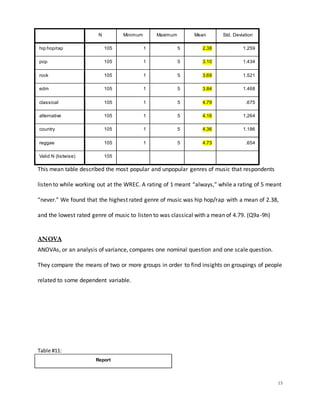
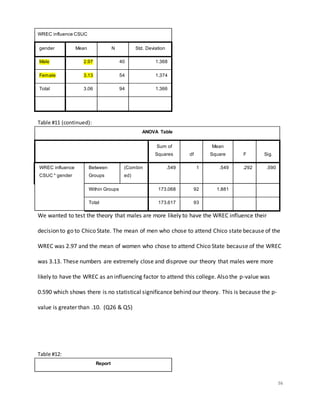
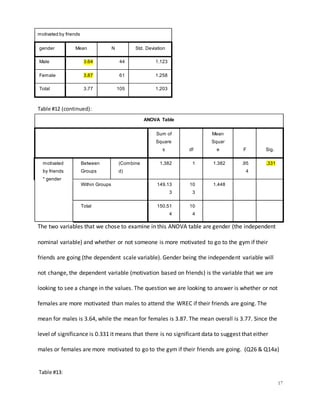
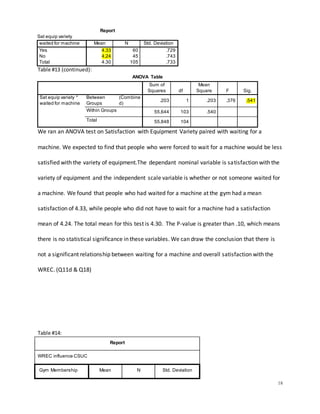
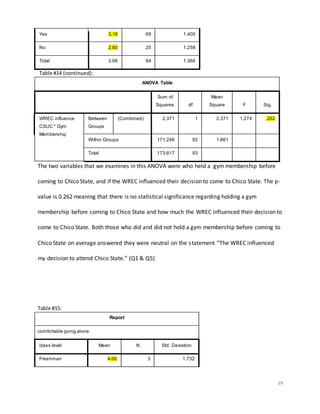
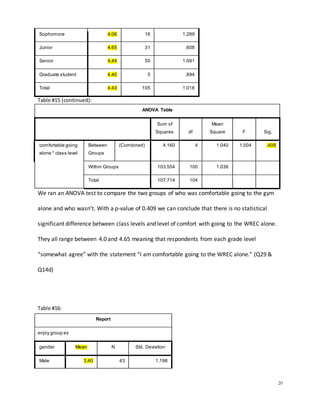
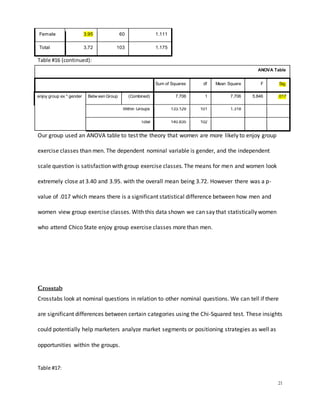
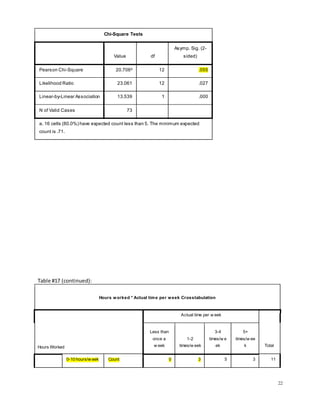
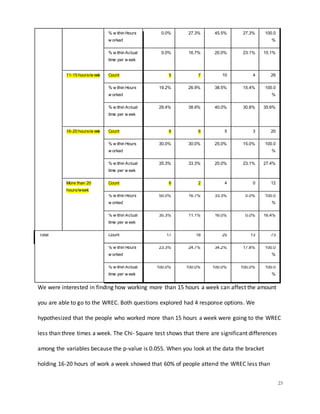
CALIFORNIA STATE UNIVERSITY,CHICO –DECEMBER 2015
Veronica
Carousos
Gabrielle
Coyne
Caroline
Meyers
Ashley
Ryan
Amanda
Zanette
California State
University, Chico
Marketing Research 380
Final Report
1
Table of Contents
I. Executive Summary 2
II. Introduction 4
III. Methodology 5
a. Question Development 5
b. Data Collection 6
c. Data Entry Process 7
IV. A
nalysis & Discussion of Findings 10
a. Frequency 10
b. Mean 13
c. ANOVA 15
d. Crosstab 22
e. Correlation 30
f. Regression 33
V. Conclusion 36
VI. Appendix 38
2
I. Executive Summary
The purpose of the following findings from this marketing research project are to
assist the WREC at Chico State University in any decision making processes they may
undergo that would have an effect on the students who visit the WREC. There was a
simple, yet time-consuming, set of guidelines that we had to follow in order to meet all of
the requirements of a marketing research project.
The steps are in order as follows: identify problem/opportunity, determine
research design & method of research, establish sampling procedure, collect data,
analyze data and write report. We began by identifying the opportunity as analyzing the
differences in feelings and opinions between students based on a variety of factors
including class level, age, gender and work-life balance.
Developing the questions for the survey was one of the most lengthy processes
that we underwent throughout the project. Since the beginning of the development of
the survey questions, we altered the survey approximately 4 times; adding, changing, or
removing questions altogether. Once the survey was fully approved and all of the
questions were coded in order to be able to analyze them after data collection, we began
the process of attempting to distribute and recover 100-125 completed surveys.
Data collection consisted of a few different methods including: passing out surveys
to students in the library, distributing them to fellow members of a Chico State club,
asking coworkers to fill them out and passing out surveys to students in our classes. All of
the respondents were Chico State students, being that we were collecting data about a
Chico State facility. We ended up collecting a total of 105 surveys from a variety of
3
different students who attend Chico State, from which we were able to uncover their
feelings and opinions regarding multiple aspects of the WREC.
The tests that we ran were in a program called “SPSS,” which is a data analytics
software. Once the data was uploaded into SPSS, we ran a total of 34 tests in order to
compare a variety of question combinations. The 6 different tests that we ran are as
follows: regressions, correlations, ANOVAs, frequencies, crosstabs and mean tests. In
order to avoid any misinterpretation of data among group members, we (Gabi, Amanda,
Ashley and Ronnie) divided the 34 tests equally among ourselves providing that we each
were doing at least 4 different kinds of tests. Once we analyzed the data separately, we
came together in order to create a cohesive report to illustrate our findings.
In general, most of the tests that we ran on our data were not significant. We
believe that this is due, in part, to the fact that convenience sampling was our main
method of data collection. Throughout data analysis, we noticed that the data we
collected did not support our hypothesis as much as we had hoped it would. However,
that doesn’t mean we were left with no significant data. There were a number of tests
that we ran that turned out to have extremely reliable outcomes. In the preceding
sections of the report, we further explain each individual test we ran and what we were
able to learn from the results.
4
II. Introduction
Every year millions of Americans frequent their local exercise facility in hopes of
increasing their health and perhaps decreasing their weight. The story is no different for college
students. At Chico State University, the gym provided by the school, the WREC, is a popular
place for students to spend their downtime. Our sole purpose for this research project was to
gather information from students who have visited the WREC and uncover their feelings and
opinions about certain aspects of the facility. We explored a variety of different topics
including, but not limited to, popular times of the day that students visit the WREC, which areas
of the WREC are the most or least popular, opinions on group exercise classes and a number of
other topics. The outcome of the project is to inform the managers of the WREC on what they
are doing well from the perspective of the students and what they can improve on. The
managers can use this information to assist themin making improvements to help increase the
satisfaction of the WREC customers, as well as increase the amount of users the WREC obtains
throughout the year. These improvements can be as simple as hanging up more fliers to inform
students about group exercise classes, activities, etc. Based on the information we collected, it
will give the WREC a clear direction to take in its marketing edd One of the group members who
works at the WREC spoke to her manager, Mark Mooradian, in order to better gauge the types
of information that the managers felt would be the most useful for our project. He states, “We
just want to make this a more welcoming environment so that we can create an overall positive
experience for the students.”
5
III. Methodology
Through the process of developing this research analysis, we have gone through many steps to
come to the conclusions we have. After choosing our group, we had to select a topic to
research. We waivered between a few different ideas related to Chico State nightlife, eating
habits of Chico State students, and finally decided on exercise activities of Chico State WREC
students.
Question Development
We had a large amount of direction with the question development process. We began
by simply coming up with some interesting aspects about exercising at the WREC. We were
interested in satisfaction with different equipment, variations between male and female gym
users, upper and lower division students and even the “customer service” aspects at the WREC.
We had many different exercises in class working as a group trying to come up with related
scale, nominal and rank order questions. While we were in class, we brainstormed as a group
about which variables we thought would provide the most useful data. We turned in 4 revised
surveys hoping that we had it right and once we finally had our survey approved on November
5th, it was time to start our data collection.
6
Data Collection
Our sample for the data collection process was Chico State students because only
students are able to access the facility. We collected our data through pencil and paper surveys
by passing them out to students on campus. Gabi collected 25 surveys by asking members of
her co-ed professional fraternity, roommates, friends, and classmates in business and history
classes. Ashley collected 13 surveys from classmates in business classes and friends. Veronica
asked her coworkers at the WREC and students at the WREC (MMA class students and some
students sitting outside of the classes) and ended up collecting a total of 25 completed surveys.
Caroline got her 25 completed surveys from roommates and classmates in her REC classes as
well as friends. Amanda collected 28 by asking students in the library as well as coworkers
whom she knew were Chico State students. In the end, we were forced to throw out 11 surveys
due to them being either incomplete or incorrectly filled out. The data collection took place
over the course of one week, November 15th through November 20th. Some of the troubles we
experienced during the collection period were convenience sampling and the unreliability of
the respondents. Convenience sampling was something that was extremely hard to avoid, since
we are all students and could not afford the time of going out and sampling from a larger
variety of people. The fact that we were left with a less diverse group of respondents is evident
in our data; 46.7% of our respondents were seniors.
7
Data Entry Process
The approach we took for data entry was to start a Google Sheet and have each of our
group members enter their survey data themselves. We assigned each member a set of 25
surveys. Amanda was responsible for filling out 1-25, Ashley had 26-50, Caroline had 51-75 ,
Gabi had 76-100 and finally Veronica had 101-125. We ended up having to throw out a number
of bad surveys but still managed to collect 105 completed survey responses. Using Google
Sheets caused some complications when we had to transfer the data into SPSS. Since there
were some gaps with survey numbers on the Google sheets we had to manipulate the rows
which caused a bit of frustration. We ended up simply making some adjustments to our survey
numbers and deleting rows in Sheets to fix the issue. We met as a group and Gabi was able to
move the data from Excel into SPSS and alter the variable view. Veronica and Gabi went
through the data to clean it up and make sure that we were not missing anything while Amanda
worked on breaking up the data analysis portions to assign to each group member. We wanted
to avoid having one person work on an entire test section that they may or may not have
understood so Amanda, Veronica, Ashley, and Gabi each conducted frequencies, means,
ANOVAs, crosstabs, correlations, and regressions. Gabi and Veronica worked on their analyses
from VSL on their laptops, while Ashley and Amanda completed their analyses in the CSUC
computer labs in the library and Tehama Hall. The breakdown of who ran which analyses is as
follows:
Frequencies:
Gabi:
- Have you ever held a gym membership before coming to Chico State?
- Are you currently employed?
8
Veronica:
- What gender do you identify with?
- What is your current class standing?
Ashley:
- Did you come to Chico State as a transfer student?
- How old are you?
Amanda:
- What time of the day are you most likely to utilize the WREC?
- On average, how much time do you spend at the WREC per visit?
Correlation:
Gabi:
- Satisfaction with the variety of classes related to overall satisfaction with group classes
Amanda:
- Whether or not people who are motivated to go to the WREC with friends enjoy group
exercise classes.
- Whether or not overall satisfaction with the WREC influenced the decision to attend
Chico State
Regressions:
Veronica:
- Whether or not healthy eating affects satisfaction with the WREC.
Ashley:
- Whether or not use of the downstairs weight room affects someone’s level of
comfortability going to the WREC alone.
- Whether or not someone’s job affects someone’s level of comfortability going to the
WREC alone.
Means:
Group effort:
- Satisfaction with cleanliness, friendliness, variety of exercise classes, variety of
equipment, and locker availability.
- Frequency of listening to hip hop/rap, pop, rock, EDM, classical, alternative, country,
and reggae.
9
-
ANOVAs:
Ronnie:
- Gender vs. WREC influence on decision to attend Chico State.
- Gender vs. likelihood of group exercise class enjoyment
Gabi:
- People who have held a gym membership before attending Chico State related to
influence of WREC on CSUC college choice.
- Class standing related to comfortability going to gym alone.
Ashley:
- Wait for machine related to satisfaction with variety of equipment.
Amanda:
- Gender related to motivation by friends going.
Crosstabs:
Veronica:
- Frequency of hours worked per week related to the number of days per week visiting
the WREC.
Gabi:
- Gender related to length of time spent at the WREC.
Ashley:
- Gender related to whether or not a pervious gym membership was held.
Amanda:
- Class level related to number of days per week visiting the WREC.
10
IV. Analysis & DiscussionofFindings
Frequency
Frequency tables are run on nominal questions in order to find interesting insights. They show
how many respondents choose each specific option available.
Table #1:
gender
Frequency Percent Valid Percent
Cumulative
Percent
Valid Male 44 41.9 41.9 41.9
Female 61 58.1 58.1 100.0
Total 105 100.0 100.0
We ran a frequency table to test how many males and females were taking our surveys. We
learned that 41.9% of survey takers were male and 58.1% of takers were female. This was out
of 105 respondents. (Q26)
Table #2:
class level
Frequency Percent Valid Percent
Cumulative
Percent
Valid Freshman 3 2.9 2.9 2.9
Sophomore 16 15.2 15.2 18.1
Junior 31 29.5 29.5 47.6
Senior 50 47.6 47.6 95.2
Graduate student 5 4.8 4.8 100.0
Total 105 100.0 100.0
11
We also ran a frequency to see the amount of freshman, sophomores, juniors, seniors and
graduate students we had taking our surveys. The percents we got from the tests are as
follows. Freshman: 2.9% Sophomore: 15.2% Junior: 29.5% Senior: 47.6% Graduate Student:
4.8%. These numbers obviously show that we had more seniors than any other class standing
taking our surveys. This is probably due to the fact that we are all seniors and the people we
most often associate with are going to be seniors as well. (Q27)
Table #3:
Gym Membership
Frequency Percent Valid Percent
Cumulative
Percent
Valid Yes 76 72.4 72.4 72.4
No 29 27.6 27.6 100.0
Total 105 100.0 100.0
Of 105 respondents who were asked whether or not they held a gym membership before
coming to Chico State, 72.4% of them had a gym membership and 27.6% did not. (Q1)
Table #4:
Employed
Frequency Percent Valid Percent
Cumulative
Percent
Valid Yes 67 63.8 63.8 63.8
No 38 36.2 36.2 100.0
Total 105 100.0 100.0
Of 105 respondents who were asked if they are employed, 63.8% are employed and 36.2% are
not. (Q2)
12
Table #5:
Transfer student
Frequency Percent Valid Percent
Cumulative
Percent
Valid Yes 30 28.6 28.6 28.6
No 75 71.4 71.4 100.0
Total 105 100.0 100.0
Of 105 people surveyed, 28.6% of students were transfer students, while 71.4% were not. (Q28)
Table #6:
Age
Frequency Percent Valid Percent
Cumulative
Percent
Valid 17 - 19 21 20.0 20.0 20.0
20 - 22 61 58.1 58.1 78.1
23 - 25 18 17.1 17.1 95.2
26 and above 5 4.8 4.8 100.0
Total 105 100.0 100.0
Of people surveyed 20.0% were between the ages of 17-19, 58.1% of people were ages 20-22,
17.1% of people surveyed were ages 23-25, and lastly 4.8% of people surveyed were aged 26 or
older. (Q31)
Table #7:
Time of day
Frequency Percent Valid Percent
Cumulative
Percent
Valid 6am -10am 18 17.1 17.1 17.1
10am - 2pm 17 16.2 16.2 33.3
2pm - 6pm 20 19.0 19.0 52.4
6pm - 10pm 39 37.1 37.1 89.5
10pm - close 11 10.5 10.5 100.0
Total 105 100.0 100.0
13
The frequency table above explains how many of the people who completed the data attend
the WREC at any given time of the day. According to the data, about one third of people
(37.1%) visit the WREC between 6pm and 10pm, and the least chosen time to go to the WREC
(10.5%) is from 10pm to close. This is out of 105 people who filled out the survey. (Q8)
Table #8:
Time per visit
Frequency Percent Valid Percent
Cumulative
Percent
Valid Less than 30 minutes 5 4.8 4.8 4.8
30-59 minutes 36 34.3 34.3 39.0
1-2 hours 58 55.2 55.2 94.3
More than 2 hours 6 5.7 5.7 100.0
Total 105 100.0 100.0
The frequency table above explains how many of the 105 people who completed the survey
attend the WREC for any given length of time. According to the data, more than half of people
(55.2%) who attend the WREC stay for a length of 1-2 hours, and the least amount of people
(4.8%) stay for a length of time of less than 30 minutes. (Q10)
Mean
Means are run on scale questions to determine the average importance for different variables.
Table #9:
14
Descriptive Statistics
N Minimum Maximum Mean Std. Deviation
Sat cleanliness 105 2 5 4.55 .588
Sat staff friendliness 105 3 5 4.39 .658
Sat class variety 105 1 5 4.15 .864
Sat equip variety 105 2 5 4.30 .733
Sat locker 105 1 5 4.13 .856
Valid N (listwise) 105
In the mean table above, we discovered which area had the highest level of satisfaction overall.
A rating of 1 meant “completely dissatisfied,” and a rating of 5 meant “completely satisfied.”
The aspect of the WREC with the highest rating in this question was cleanliness with a mean of
4.55. The lowest rating was given to locker availability of lockers with a mean of 4.13. (Q11a-
11e)
Table #10:
Descriptive Statistics
15
N Minimum Maximum Mean Std. Deviation
hip hop/rap 105 1 5 2.38 1.259
pop 105 1 5 3.10 1.434
rock 105 1 5 3.69 1.521
edm 105 1 5 3.84 1.468
classical 105 1 5 4.79 .675
alternative 105 1 5 4.16 1.264
country 105 1 5 4.36 1.186
reggae 105 1 5 4.73 .654
Valid N (listwise) 105
This mean table described the most popular and unpopular genres of music that respondents
listen to while working out at the WREC. A rating of 1 meant “always,” while a rating of 5 meant
“never.” We found that the highest rated genre of music was hip hop/rap with a mean of 2.38,
and the lowest rated genre of music to listen to was classical with a mean of 4.79. (Q9a-9h)
ANOVA
ANOVAs, or an analysis of variance, compares one nominal question and one scale question.
They compare the means of two or more groups in order to find insights on groupings of people
related to some dependent variable.
Table #11:
Report
16
WREC influence CSUC
gender Mean N Std. Deviation
Male 2.97 40 1.368
Female 3.13 54 1.374
Total 3.06 94 1.366
Table #11 (continued):
ANOVA Table
Sum of
Squares df
Mean
Square F Sig.
WREC influence
CSUC * gender
Between
Groups
(Combin
ed)
.549 1 .549 .292 .590
Within Groups 173.068 92 1.881
Total 173.617 93
We wanted to test the theory that males are more likely to have the WREC influence their
decision to go to Chico State. The mean of men who chose to attend Chico state because of the
WREC was 2.97 and the mean of women who chose to attend Chico State because of the WREC
was 3.13. These numbers are extremely close and disprove our theory that males were more
likely to have the WREC as an influencing factor to attend this college. Also the p-value was
0.590 which shows there is no statistical significance behind our theory. This is because the p-
value is greater than .10. (Q26 & Q5)
Table #12:
Report
17
motivated by friends
gender Mean N Std. Deviation
Male 3.64 44 1.123
Female 3.87 61 1.258
Total 3.77 105 1.203
Table #12 (continued):
ANOVA Table
Sum of
Square
s df
Mean
Squar
e F Sig.
motivated
by friends
* gender
Between
Groups
(Combine
d)
1.382 1 1.382 .95
4
.331
Within Groups 149.13
3
10
3
1.448
Total 150.51
4
10
4
The two variables that we chose to examine in this ANOVA table are gender (the independent
nominal variable) and whether or not someone is more motivated to go to the gym if their
friends are going (the dependent scale variable). Gender being the independent variable will
not change, the dependent variable (motivation based on friends) is the variable that we are
looking to see a change in the values. The question we are looking to answer is whether or not
females are more motivated than males to attend the WREC if their friends are going. The
mean for males is 3.64, while the mean for females is 3.87. The mean overall is 3.77. Since the
level of significance is 0.331 it means that there is no significant data to suggest that either
males or females are more motivated to go to the gym if their friends are going. (Q26 & Q14a)
Table #13:
18
Report
Sat equip variety
waited for machine Mean N Std. Deviation
Yes 4.33 60 .729
No 4.24 45 .743
Total 4.30 105 .733
Table #13 (continued):
ANOVA Table
Sum of
Squares df
Mean
Square F Sig.
Sat equip variety *
waited for machine
Between
Groups
(Combine
d)
.203 1 .203 .376 .541
Within Groups 55.644 103 .540
Total 55.848 104
We ran an ANOVA test on Satisfaction with Equipment Variety paired with waiting for a
machine. We expected to find that people who were forced to wait for a machine would be less
satisfied with the variety of equipment.The dependant nominal variable is satisfaction with the
variety of equipment and the independent scale variable is whether or not someone waited for
a machine. We found that people who had waited for a machine at the gym had a mean
satisfaction of 4.33, while people who did not have to wait for a machine had a satisfaction
mean of 4.24. The total mean for this test is 4.30. The P-value is greater than .10, which means
there is no statistical significance in these variables. We can draw the conclusion that there is
not a significant relationship between waiting for a machine and overall satisfaction with the
WREC. (Q11d & Q18)
Table #14:
Report
WREC influence CSUC
Gym Membership Mean N Std. Deviation
19
Yes 3.16 69 1.400
No 2.80 25 1.258
Total 3.06 94 1.366
Table #14 (continued):
ANOVA Table
Sum of
Squares df
Mean
Square F Sig.
WREC influence
CSUC * Gym
Membership
Between
Groups
(Combined) 2.371 1 2.371 1.274 .262
Within Groups 171.246 92 1.861
Total 173.617 93
The two variables that we examines in this ANOVA were who held a gym membership before
coming to Chico State, and if the WREC influenced their decision to come to Chico State. The p-
value is 0.262 meaning that there is no statistical significance regarding holding a gym
membership before coming to Chico State and how much the WREC influenced their decision to
come to Chico State. Both those who did and did not hold a gym membership before coming to
Chico State on average answered they were neutral on the statement “The WREC influenced
my decision to attend Chico State.” (Q1 & Q5)
Table #15:
Report
comfortable going alone
class level Mean N Std. Deviation
Freshman 4.00 3 1.732
20
Sophomore 4.06 16 1.289
Junior 4.65 31 .608
Senior 4.44 50 1.091
Graduate student 4.40 5 .894
Total 4.43 105 1.018
Table #15 (continued):
ANOVA Table
Sum of
Squares df
Mean
Square F Sig.
comfortable going
alone * class level
Between
Groups
(Combined) 4.160 4 1.040 1.004 .409
Within Groups 103.554 100 1.036
Total 107.714 104
We ran an ANOVA test to compare the two groups of who was comfortable going to the gym
alone and who wasn’t. With a p-value of 0.409 we can conclude that there is no statistical
significant difference between class levels and level of comfort with going to the WREC alone.
They all range between 4.0 and 4.65 meaning that respondents from each grade level
“somewhat agree” with the statement “I am comfortable going to the WREC alone.” (Q29 &
Q14d)
Table #16:
Report
enjoy group ex
gender Mean N Std. Deviation
Male 3.40 43 1.198
21
Female 3.95 60 1.111
Total 3.72 103 1.175
Table #16 (continued):
ANOVA Table
Sum of Squares df Mean Square F Sig.
enjoy group ex * gender Betw een Group (Combined) 7.706 1 7.706 5.846 .017
Within Groups 133.129 101 1.318
Total 140.835 102
Our group used an ANOVA table to test the theory that women are more likely to enjoy group
exercise classes than men. The dependent nominal variable is gender, and the independent
scale question is satisfaction with group exercise classes. The means for men and women look
extremely close at 3.40 and 3.95. with the overall mean being 3.72. However there was a p-
value of .017 which means there is a significant statistical difference between how men and
women view group exercise classes. With this data shown we can say that statistically women
who attend Chico State enjoy group exercise classes more than men.
Crosstab
Crosstabs look at nominal questions in relation to other nominal questions. We can tell if there
are significant differences between certain categories using the Chi-Squared test. These insights
could potentially help marketers analyze market segments or positioning strategies as well as
opportunities within the groups.
Table #17:
22
Chi-Square Tests
Value df
Asymp. Sig. (2-
sided)
Pearson Chi-Square 20.706a
12 .055
Likelihood Ratio 23.061 12 .027
Linear-by-Linear Association 13.539 1 .000
N of Valid Cases 73
a. 16 cells (80.0%) have expected count less than 5. The minimum expected
count is .71.
Table #17 (continued):
Hours worked * Actual time per week Crosstabulation
Hours Worked
Actual time per w eek
Total
Less than
once a
w eek
1-2
times/w eek
3-4
times/w e
ek
5+
times/w ee
k
0-10 hours/w eek Count 0 3 5 3 11
23
% w ithin Hours
w orked
0.0% 27.3% 45.5% 27.3% 100.0
%
% w ithin Actual
time per w eek
0.0% 16.7% 20.0% 23.1% 15.1%
11-15 hours/w eek Count 5 7 10 4 26
% w ithin Hours
w orked
19.2% 26.9% 38.5% 15.4% 100.0
%
% w ithin Actual
time per w eek
29.4% 38.9% 40.0% 30.8% 35.6%
16-20 hours/w eek Count 6 6 5 3 20
% w ithin Hours
w orked
30.0% 30.0% 25.0% 15.0% 100.0
%
% w ithin Actual
time per w eek
35.3% 33.3% 20.0% 23.1% 27.4%
More than 20
hours/week
Count 6 2 4 0 12
% w ithin Hours
w orked
50.0% 16.7% 33.3% 0.0% 100.0
%
% w ithin Actual
time per w eek
35.3% 11.1% 16.0% 0.0% 16.4%
Total Count 17 18 25 13 73
% w ithin Hours
w orked
23.3% 24.7% 34.2% 17.8% 100.0
%
% w ithin Actual
time per w eek
100.0% 100.0% 100.0% 100.0% 100.0
%
We were interested in finding how working more than 15 hours a week can affect the amount
you are able to go to the WREC. Both questions explored had 4 response options. We
hypothesized that the people who worked more than 15 hours a week were going to the WREC
less than three times a week. The Chi- Square test shows that there are significant differences
among the variables because the p-value is 0.055. When you look at the data the bracket
holding 16-20 hours of work a week showed that 60% of people attend the WREC less than
24
three times a week. This is showing that the majority of people in this bracket are not going to
the WREC more than 3 times per week. This is a large contrast to the 0-10 hours per week
bracket in which only 27.3% of people are going less than three times a week. When the hours
move up to the more than 20 hours per week bracket the amount of people who make it to the
WREC less than three times a week jumps to 66.7%. This data supports our hypothesis that if
students are working more than 15 hours per week they are attending the WREC less than
three times a week. (Q3 & Q6)
Table #18:
Time per visit * gender Crosstabulation
gender
TotalMale Female
Time per visit Less than 30 minutes Count 4 1 5
% within Time per visit 80.0% 20.0% 100.0%
% within gender 9.1% 1.6% 4.8%
25
30-59 minutes Count 9 27 36
% within Time per visit 25.0% 75.0% 100.0%
% within gender 20.5% 44.3% 34.3%
1-2 hours Count 27 31 58
% within Time per visit 46.6% 53.4% 100.0%
% within gender 61.4% 50.8% 55.2%
More than 2 hours Count 4 2 6
% within Time per visit 66.7% 33.3% 100.0%
% within gender 9.1% 3.3% 5.7%
Total Count 44 61 105
% within Time per visit 41.9% 58.1% 100.0%
% within gender 100.0% 100.0% 100.0%
Table #18 (continued):
Chi-Square Tests
Value df
Asymp. Sig. (2-
sided)
Pearson Chi-Square 9.232a
3 .026
Likelihood Ratio 9.537 3 .023
Linear-by-Linear Association 1.231 1 .267
N of Valid Cases 105
a. 4 cells (50.0%) have expected countless than 5. The minimum expected
26
count is 2.10.
We ran this cross tabulation test above in order to show that men stay at the WREC longer
than women. There were 2 response options for gender and 4 response options for amount of
time spent at the WREC. The Pearson Chi-square value of 0.026 means that there are significant
differences between gender and time spent at the WREC. Most males (61.4%) and females
(50.8%) spend 1-2 hours at the WREC. Of students who spend more than 2 hours at the WREC,
66.7% are male but only 33.3% are female. Of those who spend 30-59 minutes at the gym 25%
are male and 75% are female. Of all males who answered, only 9.1% go for less than 30 minutes
while only 1.6% of females spend less than 30 minutes at the WREC. This data proves that our
hypothesis was correct, men stay at the WREC for longer periods of time than women. (Q26 &
Q10)
Table #19:
ClassLevel * Actual time per week Crosstabulation
Crosstab 29&6
Actual time per week
Total
Less than
once a
week
1-2
times/wee
k
3-4
times/wee
k
5+
times/wee
k
ClassLevel 1.00 Count 3 5 5 6 19
% within
ClassLevel
15.8% 26.3% 26.3% 31.6% 100.0%
% within Actual 12.5% 19.2% 13.2% 35.3% 18.1%
27
time per week
2.00 Count 21 21 33 11 86
% within
ClassLevel
24.4% 24.4% 38.4% 12.8% 100.0%
% within Actual
time per week
87.5% 80.8% 86.8% 64.7% 81.9%
Total Count 24 26 38 17 105
% within
ClassLevel
22.9% 24.8% 36.2% 16.2% 100.0%
% within Actual
time per week
100.0% 100.0% 100.0% 100.0% 100.0%
Table #19 (continued):
Chi-Square Tests
Value df
Asymp. Sig.
(2-sided)
Pearson Chi-Square 4.548a
3 .208
Likelihood Ratio 4.086 3 .252
Linear-by-Linear
Association
1.747 1 .186
N of Valid Cases 105
The Crosstabulation table above was executed using two variables consisting of class level and
how many times per week one goes to the WREC. For class level, 5 response options are
offered, and for how many times someone goes to the WREC per week there are 4 response
28
options. In the original data, upperclassmen and lowerclassmen are separated into five
different categories: freshmen, sophomores, juniors, seniors and graduate students. For the
convenience of the test above, and in order to make the data more reader-friendly, lower
classmen (freshmen and sophomores) have been given the value “1,” and upper classmen
(juniors, seniors and graduate students) have been given the value “2.” The question being
explored is whether or not lower classmen visit the WREC more often than upperclassmen.
According to the data, the highest volume of lower classmen visit the WREC 5+ times per week,
while the highest volume of upperclassmen that visit the WREC is 3-4 times per week. The
lowest volume of lower classmen that attend the WREC is less than once a week at 15.8%, while
the lowest volume of upperclassmen that attend the WREC falls under the 5+ days per week
option at 12.8%. The Asymp. Sig. is .208. Since the p-value is .1, this means that there is no
significant data to suggest that upper classmen visit the WREC more or less days per week than
lower classmen, and vice versa. (Q29 & Q6)
Table #20:
gender * Gym Membership Crosstabulation
Gym Membership
TotalYes No
gender Male Count 34 10 44
% within gender 77.3% 22.7% 100.0%
% within Gym Membership 44.7% 34.5% 41.9%
Female Count 42 19 61
% within gender 68.9% 31.1% 100.0%
% within Gym Membership 55.3% 65.5% 58.1%
Total Count 76 29 105
% within gender 72.4% 27.6% 100.0%
% within Gym Membership 100.0% 100.0% 100.0%
Table #20 (continued):
Chi-Square Tests
Value df
Asymp. Sig. (2-
sided)
Exact Sig. (2-
sided)
Exact Sig. (1-
sided)
Pearson Chi-Square .907a
1 .341
Continuity Correctionb
.534 1 .465
Likelihood Ratio .919 1 .338
Fisher's Exact Test .383 .233
Linear-by-Linear Association .898 1 .343
29
N of Valid Cases 105
a. 0 cells (0.0%) have expected count less than 5.The minimum expected countis 12.15.
b. Computed onlyfor a 2x2 table
We ran a crosstab comparing gender with whether or not they had previously held a gym
membership. Both questions offered 2 different responses. In our findings, we discovered that
out of 44 men surveyed, 34 had previously held a gym membership (77.3% of males) and that
10 did not (22.7% of males). Out of the 61 women surveyed, 42 had previously held a gym
membership (68.9% of women), while 19 had not (31.3% of women). The p-value is greater
than 0.10, which makes the two nominal variables not statistically significant. We discovered
that men are not more likely to have held a gym membership before coming to Chico State, as
we had hypothesized. (Q1 & Q26)
Correlation
Correlations give us insights between two scale variables by proving a relationship between the
variables. The two variables move together in either a positive or negative correlation. A
positive correlation means that as one variable goes up, the other does too while a negative
correlation means that as one variable goes up, the other goes down. The Pearson Correlation,
or r-value, signifies the strength of that connection.
Table #21:
Descriptive Statistics
Mean Std. Deviation N
motivated by friends 3.77 1.203 105
enjoy group ex 3.72 1.175 103
Table #21 (continued):
Correlations
motivated by enjoy group ex
30
friends
motivated by friends Pearson Correlation 1 .038
Sig. (2-tailed) .703
N 105 103
enjoy group ex Pearson Correlation .038 1
Sig. (2-tailed) .703
N 103 103
The two variables explored above are whether or not people are motivated more to go to the
gym when their friends are going, and whether or not they enjoy group exercise classes; we
expected these two variables to have a positive correlation. The scales were 1-5, 1 being
“strongly disagree,” 5 being “strongly agree.” We ran a correlation on these 2 variables in order
to find out if the results of one question affects the result of the other. Since the r-value is
positive at 0.038, this means that there is an extremely weak positive correlation between the
two, based on the rule of thumb that an r-value of 0-0.30 means that there is either a weak
correlation or no correlation at all. The p-value is 0.703, which means that there is no significant
data suggesting that either one of these variables affects the other. People who are motivated
to go to the gym because of their friends are not more likely to enjoy group exercises, and
people who enjoy group exercises are not more likely to be motivated to go to the gym if their
friends are going. (Q14a & Q14b)
Table #22:
Descriptive Statistics
Mean Std. Deviation N
overall satwith WREC 4.31 .934 105
31
WREC influence CSUC 3.06 1.366 94
Table #22 (continued):
Correlations
overall sat with
WREC
WREC influence
CSUC
overall satwith WREC Pearson Correlation 1 .328**
Sig. (2-tailed) .001
N 105 94
WREC influence CSUC Pearson Correlation .328**
1
Sig. (2-tailed) .001
N 94 94
**. Correlation is significantatthe 0.01 level (2-tailed).
The two variables explored in this correlation are people’s overall satisfaction with the WREC,
and whether or not the WREC was an influencing factor for people to attend Chico State. We
assumed that there would be a positive correlation between the two. We ran a correlation on
these two variables in order to find out if the results of one question affects the result of the
other one. The scale we used was 1-5, 1 being “very dissatisfied” and 5 being “very satisfied.”
Since the r-value is 0.328, there is a moderate positive correlation of the two variables. This is
based on the rule of thumb that an r-value of 0.30-0.70 means there is a moderate correlation.
Also, since the p-value is 0.001, this suggests that there is significant data that suggests that the
answers to these questions affect each other. Therefore, someone who is satisfied with the
WREC is more likely to have had the WREC influence their decision to attend, and someone
who was influenced by the WREC to attend Chico State is more likely to be satisfied overall with
the WREC itself. (Q17 & Q4)
32
Table #23:
Descriptive Statistics
Mean Std. Deviation N
Sat class variety 4.15 .864 105
enjoy group ex 3.72 1.175 103
Table #23 (continued):
Correlations
Sat class variety enjoy group ex
Sat class variety Pearson Correlation 1 .222*
Sig. (2-tailed) .024
N 105 103
enjoy group ex Pearson Correlation .222* 1
Sig. (2-tailed) .024
N 103 103
*. Correlation is significantatthe 0.05 level (2-tailed).
These two variables explored the relationship between respondents’ satisfaction with the
WREC’s variety of classes with how much they enjoy going to group exercise classes. We
hypothesized that they would be closely related with a positive correlation. The scaled we used
was 1-5. The data showed us that the correlation between the variables has a weak positive
33
connection due to the r-value being 0.222. We also know that the correlation is highly
significant because the p-value is 0.024. This means that as people enjoy group exercise classes
more, they also tend to be more satisfied with the variety of classes. (Q11c & Q14b)
Regression
Regressions look at the relationship between two scale variables. These test explain causation.
One independent variable affects a dependent variable. The r-squared value explains how
much of the variation in the dependent variable is explained by the independent variable.
Table #24:
Model Summary
Model R R Square
Adjusted R
Square
Std. Error of the
Estimate
1 .340a
.115 .107 .882
a. Predictors:(Constant),imp healthy eating
Table #24 (continued):
Coefficientsa
Model
Unstandardized Coefficients
Standardized
Coefficients
t Sig.B Std. Error Beta
1 (Constant) 3.285 .294 11.191 .000
imp healthy eating .287 .078 .340 3.667 .000
a. DependentVariable:overall satwith WREC
34
Our group was interested in finding out how the importance of healthy eating affected people's
overall satisfaction of the WREC. The independent variable is the importance placed on healthy
eating, while the dependant variable it overall satisfaction with the WREC. We theorized that if
people thought healthy eating was more important, they would have a higher opinion of the
WREC overall. We ran a regression to test this theory. There is a 10.7% correlation between the
importance of healthy eating and overall WREC satisfaction. Since the t-value is positive at
3.667, there is a strong correlation between these variables. The p-value is 0.000 which gives a
very high level of significance. With this information we can say that healthy eating causes
higher satisfaction with the WREC. (Q25 & Q17)
Table #25:
Model Summary
Model R R Square
Adjusted R
Square
Std. Error of the
Estimate
1 .330a
.109 .100 .965
a. Predictors:(Constant),weightroom use per week
Table #25 (continued):
Coefficientsa
Model
Unstandardized Coefficients
Standardized
Coefficients
t Sig.B Std. Error Beta
1 (Constant) 3.885 .180 21.581 .000
weightroom use per week .246 .069 .330 3.543 .001
a. DependentVariable:comfortable going alone
We ran a regression analysis comparing comfortability with going to the WREC alone as our
dependent variable contrasted with how often they use the weight room per week as the
independent variable. We expected to find that the less someone uses the weight room, the
less comfortable they are going to the WREC alone. The p-value is less than 0.10, making the
relationship between the two variables statistically significant, and since the t-value is positive
at 3.543 this means that there is a strong correlation. We found that our hypothesis was correct
35
and that people who never use the downstairs weight room are less likely to feel comfortable
going to the WREC alone. The adjusted R-square value is 0.100 (10%) meaning that 10% of
variation can be explained by the data. (Q15 & 14d)
V. Conclusions
In conclusion, we have been able to gain insights to our fellow classmate’s feelings and
opinions about the WREC at CSUC. Overall, each and every one of us underestimated the
amount of time that it takes to put together a successful marketing research project. The data
analysis alone proved to be extremely time consuming. Not to mention, attempting to
distribute and collect the surveys themselves was a week-long task. Even after a whole week
collecting data, we still ended up with surveys that we needed to discard.
As far as the data itself, there were a few different tests that we ran that proved to be
highly significant information for the WREC to consider. In one of our regression tests, we
examined how the someone’s view of healthy eating influenced their overall satisfaction of the
WREC. Since the p-value for this test was 0.000, it showed that there is an extremely strong
statistical significance between the two variables. You can view the outcomes from this test in
table #24. This test was important because the WREC can use this information in order to
36
better accommodate its customers in the future. Another highly significant test that we ran can
be found in table #22. In this correlation test, we examined respondents overall satisfaction
with the WREC and whether or not the WREC was an influencing factor in deciding to attend
CSUC. The p-value was .001, showing that there was in fact an extremely strong correlation
between the two variables. High satisfaction with one of those variables guarantees high
satisfaction with the other. A third test that we ran that had a statistical significance was table
#18, a crosstab. In this test, we examined gender and whether or not the length of time one
gender spends at the WREC is higher or lower than the other. The p-value is .026, meaning that
the data is significant. Of the people who spend 30-59 minutes at the WREC, 75% of them are
women, while 25% are men. Of those who spend more than 2 hours, 66.7% of them are men,
and 33.3% are women.
Although not all of our tests provided us with significant data, we were able to learn a
lot about the WREC and how slight differences in someone’s demographics or behaviors could
have a significant effect on the data that we collect from them. Knowing what we know now,
we probably would have started the data collection and analysis stages of the report a few days
sooner than we did. However, this report has been an extremely beneficial experience in
learning how to create and execute a successful marketing research project. We hope that our
findings provide valuable information to the managers at the WREC, and that they are able to
better satisfy their customers based on the information we collected in our research.
37
VI. Appendix
38
Hello! You are invited to participate in our survey regarding exercise activities of Chico State students.
This survey will take approximately 5-10 minutes to complete. Please answer these questions as honestly
as possible. Your participation in this study is completely voluntary. Thank you very much for your time
and support!
1. Have you ever held a gym membership before coming to Chico State?
1. Yes
2. No
2. Are you currently employed?
1. Yes
2. No (Please skip to question 5)
3. On average, how many hours per week do you work?
1. 0-10 hours/week
2. 11-15 hours/week
3. 16-20 hours/week
4. More than 20 hours/week
4. My job prevents me from working out as much as I would like.
Strongly
disagree
Somewhat
disagree
Neutral Somewhat
agree
Strongly
agree
❏ ❏ ❏ ❏ ❏
5. The WREC influenced my decision to attend Chico State:
Strongly
disagree
Somewhat
disagree
Neutral Somewhat
agree
Strongly
agree
❏ ❏ ❏ ❏ ❏
6. On average, how often do you utilize the WREC?
1. Less than once a week
2. 1-2 times/week
3. 3-4 times/week
4. 5+ times/ week
39
7. How often would you LIKE to go to the WREC?
1. None
2. Less than once a week
3. 1-2 times/week
4. 3-4 times/week
5. 5+ times/week
8. What time of the day are you most likely to utilize the WREC?
1. 6 am - 10 am
2. 10 am - 2 pm
3. 2 pm - 6 pm
4. 6pm - 10 pm
5. 10 pm - close
9. Please rank (1-5) the following in order of importance when considering what time to go to the WREC
(1 being most important, 5 being least important):
_________ School schedule (9a)
_________ Work schedule (9b)
_________ How busy the WREC is (9c)
_________ Whether or not friends can go (9d)
_________ Group exercise times (9e)
10. On average, how much time do you spend at the WREC per visit?
1. less than 30 minutes
2. 30-59 minutes
3. 1-2 hours
4. More than 2 hours
11. How satisfied are you with the following aspects of the WREC?
Completely
dissatisfied
Somewhat
dissatisfied
Neither
satisfied nor
dissatisfied
Somewhat
satisfied
Completely
satisfied
40
Overall cleanliness
❏ ❏ ❏ ❏ ❏
Friendliness of staff
❏ ❏ ❏ ❏ ❏
Variety of classes
❏ ❏ ❏ ❏ ❏
Variety of equipment
❏ ❏ ❏ ❏ ❏
Availability of lockers
❏ ❏ ❏ ❏ ❏
12. Please rank in order of importance (1-5) the following things you would most like to be improved
about the WREC (1 meaning the most important, 5 meaning the least important):
_________ Overall cleanliness (12a)
_________ Friendliness of staff (12b)
_________ Variety of classes (12c)
_________ Variety of equipment (12d)
_________ Availability of lockers (12e)
13. Please rank (1-7) the following in order of interest for using to exercise (1 being the most interested in,
7 being the least interested in):
_________ Basketball courts (13a)
_________ Track (13b)
_________ Rock wall (13c)
_________ Weight room (downstairs) (13d)
_________ Pool (13e)
_________ Group exercise classes (13f)
_________ Machinery/Cable weights (upstairs) (13g)
14.
Rate how much you agree / disagree with these statements:
Strongly
disagree
Somewha
t disagree
Neutral Somewha
t agree
Strongly
agree
I am more motivated to go to the WREC
when friends are also going.
❏ ❏ ❏ ❏ ❏
I enjoy group exercise classes.
❏ ❏ ❏ ❏ ❏
41
I am open to trying new group exercise
classes. ❏ ❏ ❏ ❏ ❏
I am comfortable going to the WREC
alone. ❏ ❏ ❏ ❏ ❏
I am comfortable using the downstairs
weight room. ❏ ❏ ❏ ❏ ❏
After I use the WREC my mood is
improved. ❏ ❏ ❏ ❏ ❏
15. On average, how often do you use the downstairs weight room?
1. Never
2. Less than once a week
3. 1-2 times/week
4. 3-4 times/week
5. 5+ times/week
16. How frequently do you go to group exercise classes?
1. Never
2. Less than once a week
3. 1-2 times/week
4. 3-4 times/week
5. 5+ times/week
17. Overall, how satisfied are you with the WREC?
1. Very dissatisfied
2. Somewhat dissatisfied
3. Neither satisfied nor dissatisfied
4. Somewhat satisfied
5. Very satisfied
18. Over the past semester have you had to wait for an exercise machine?
1. Yes
2. No (Please skip to question 22)
You’re over halfway there!
19. How often do you have to wait to use a machine?
42
Always Most of
the time
About
half the
time
Once in
awhile
Never
❏ ❏ ❏ ❏ ❏
20. What is the longest time you have ever waited for a machine?
1. Less than 1 minute
2. 1-3 minutes
3. 3-5 minutes
4. 5+ minutes
21. Have you ever waited so long for a machine that you chose to use a different machine or exercise
activity instead?
1. Yes
2. No
22. I listen to music when I work out.
Always Most of
the time
About
half the
time
Once in
awhile
Never
(Skip to
question
24)
❏ ❏ ❏ ❏ ❏
43
44
23. What music genres do you listen to while working out?
Always Most of
the time
About
half the
time
Once in
awhile
Never
Hip-hop / rap
❏ ❏ ❏ ❏ ❏
Pop
❏ ❏ ❏ ❏ ❏
Rock
❏ ❏ ❏ ❏ ❏
EDM
❏ ❏ ❏ ❏ ❏
Classical
❏ ❏ ❏ ❏ ❏
Alternative
❏ ❏ ❏ ❏ ❏
Country
❏ ❏ ❏ ❏ ❏
Reggae
❏ ❏ ❏ ❏ ❏
24. If there were music playing over the speakers at the gym how likely would you be to stay longer?
1. Very likely
2. Somewhat likely
3. Overhead music would have no effect
4. Somewhat unlikely
5. Very unlikely
25. How important is healthy eating to you?
1. Very unimportant
2. Somewhat unimportant
3. Neutral
4. Somewhat important
5. Very important
26. What gender do you identify with?
1. Male
45
2. Female
27. Where is your hometown located?
1. Northern California
2. Central California
3. Southern California
4. Other state within the United States
5. International
28. Did you come to Chico State as a transfer student?
1. Yes
2. No
29. What is your current class standing?
1. Freshman
2. Sophomore
3. Junior
4. Senior
5. Graduate student
30. What is your current GPA?
1. 2.0 and below
2. 2.1 - 2.5
3. 2.6 - 3.0
4. 3.1 - 3.5
5. 3.6 and above
31. How old are you?
1. 17-19
2. 20-22
3. 23-25
4. 26 or above
46
You're done! :) Thank you so much for taking the time to complete our survey!

WRECFinalResearchReport.docx

  • 1.
    CALIFORNIA STATE UNIVERSITY,CHICO–DECEMBER 2015 Veronica Carousos Gabrielle Coyne Caroline Meyers Ashley Ryan Amanda Zanette California State University, Chico Marketing Research 380 Final Report
  • 2.
    1 Table of Contents I.Executive Summary 2 II. Introduction 4 III. Methodology 5 a. Question Development 5 b. Data Collection 6 c. Data Entry Process 7 IV. A nalysis & Discussion of Findings 10 a. Frequency 10 b. Mean 13 c. ANOVA 15 d. Crosstab 22 e. Correlation 30 f. Regression 33 V. Conclusion 36 VI. Appendix 38
  • 3.
    2 I. Executive Summary Thepurpose of the following findings from this marketing research project are to assist the WREC at Chico State University in any decision making processes they may undergo that would have an effect on the students who visit the WREC. There was a simple, yet time-consuming, set of guidelines that we had to follow in order to meet all of the requirements of a marketing research project. The steps are in order as follows: identify problem/opportunity, determine research design & method of research, establish sampling procedure, collect data, analyze data and write report. We began by identifying the opportunity as analyzing the differences in feelings and opinions between students based on a variety of factors including class level, age, gender and work-life balance. Developing the questions for the survey was one of the most lengthy processes that we underwent throughout the project. Since the beginning of the development of the survey questions, we altered the survey approximately 4 times; adding, changing, or removing questions altogether. Once the survey was fully approved and all of the questions were coded in order to be able to analyze them after data collection, we began the process of attempting to distribute and recover 100-125 completed surveys. Data collection consisted of a few different methods including: passing out surveys to students in the library, distributing them to fellow members of a Chico State club, asking coworkers to fill them out and passing out surveys to students in our classes. All of the respondents were Chico State students, being that we were collecting data about a Chico State facility. We ended up collecting a total of 105 surveys from a variety of
  • 4.
    3 different students whoattend Chico State, from which we were able to uncover their feelings and opinions regarding multiple aspects of the WREC. The tests that we ran were in a program called “SPSS,” which is a data analytics software. Once the data was uploaded into SPSS, we ran a total of 34 tests in order to compare a variety of question combinations. The 6 different tests that we ran are as follows: regressions, correlations, ANOVAs, frequencies, crosstabs and mean tests. In order to avoid any misinterpretation of data among group members, we (Gabi, Amanda, Ashley and Ronnie) divided the 34 tests equally among ourselves providing that we each were doing at least 4 different kinds of tests. Once we analyzed the data separately, we came together in order to create a cohesive report to illustrate our findings. In general, most of the tests that we ran on our data were not significant. We believe that this is due, in part, to the fact that convenience sampling was our main method of data collection. Throughout data analysis, we noticed that the data we collected did not support our hypothesis as much as we had hoped it would. However, that doesn’t mean we were left with no significant data. There were a number of tests that we ran that turned out to have extremely reliable outcomes. In the preceding sections of the report, we further explain each individual test we ran and what we were able to learn from the results.
  • 5.
    4 II. Introduction Every yearmillions of Americans frequent their local exercise facility in hopes of increasing their health and perhaps decreasing their weight. The story is no different for college students. At Chico State University, the gym provided by the school, the WREC, is a popular place for students to spend their downtime. Our sole purpose for this research project was to gather information from students who have visited the WREC and uncover their feelings and opinions about certain aspects of the facility. We explored a variety of different topics including, but not limited to, popular times of the day that students visit the WREC, which areas of the WREC are the most or least popular, opinions on group exercise classes and a number of other topics. The outcome of the project is to inform the managers of the WREC on what they are doing well from the perspective of the students and what they can improve on. The managers can use this information to assist themin making improvements to help increase the satisfaction of the WREC customers, as well as increase the amount of users the WREC obtains throughout the year. These improvements can be as simple as hanging up more fliers to inform students about group exercise classes, activities, etc. Based on the information we collected, it will give the WREC a clear direction to take in its marketing edd One of the group members who works at the WREC spoke to her manager, Mark Mooradian, in order to better gauge the types of information that the managers felt would be the most useful for our project. He states, “We just want to make this a more welcoming environment so that we can create an overall positive experience for the students.”
  • 6.
    5 III. Methodology Through theprocess of developing this research analysis, we have gone through many steps to come to the conclusions we have. After choosing our group, we had to select a topic to research. We waivered between a few different ideas related to Chico State nightlife, eating habits of Chico State students, and finally decided on exercise activities of Chico State WREC students. Question Development We had a large amount of direction with the question development process. We began by simply coming up with some interesting aspects about exercising at the WREC. We were interested in satisfaction with different equipment, variations between male and female gym users, upper and lower division students and even the “customer service” aspects at the WREC. We had many different exercises in class working as a group trying to come up with related scale, nominal and rank order questions. While we were in class, we brainstormed as a group about which variables we thought would provide the most useful data. We turned in 4 revised surveys hoping that we had it right and once we finally had our survey approved on November 5th, it was time to start our data collection.
  • 7.
    6 Data Collection Our samplefor the data collection process was Chico State students because only students are able to access the facility. We collected our data through pencil and paper surveys by passing them out to students on campus. Gabi collected 25 surveys by asking members of her co-ed professional fraternity, roommates, friends, and classmates in business and history classes. Ashley collected 13 surveys from classmates in business classes and friends. Veronica asked her coworkers at the WREC and students at the WREC (MMA class students and some students sitting outside of the classes) and ended up collecting a total of 25 completed surveys. Caroline got her 25 completed surveys from roommates and classmates in her REC classes as well as friends. Amanda collected 28 by asking students in the library as well as coworkers whom she knew were Chico State students. In the end, we were forced to throw out 11 surveys due to them being either incomplete or incorrectly filled out. The data collection took place over the course of one week, November 15th through November 20th. Some of the troubles we experienced during the collection period were convenience sampling and the unreliability of the respondents. Convenience sampling was something that was extremely hard to avoid, since we are all students and could not afford the time of going out and sampling from a larger variety of people. The fact that we were left with a less diverse group of respondents is evident in our data; 46.7% of our respondents were seniors.
  • 8.
    7 Data Entry Process Theapproach we took for data entry was to start a Google Sheet and have each of our group members enter their survey data themselves. We assigned each member a set of 25 surveys. Amanda was responsible for filling out 1-25, Ashley had 26-50, Caroline had 51-75 , Gabi had 76-100 and finally Veronica had 101-125. We ended up having to throw out a number of bad surveys but still managed to collect 105 completed survey responses. Using Google Sheets caused some complications when we had to transfer the data into SPSS. Since there were some gaps with survey numbers on the Google sheets we had to manipulate the rows which caused a bit of frustration. We ended up simply making some adjustments to our survey numbers and deleting rows in Sheets to fix the issue. We met as a group and Gabi was able to move the data from Excel into SPSS and alter the variable view. Veronica and Gabi went through the data to clean it up and make sure that we were not missing anything while Amanda worked on breaking up the data analysis portions to assign to each group member. We wanted to avoid having one person work on an entire test section that they may or may not have understood so Amanda, Veronica, Ashley, and Gabi each conducted frequencies, means, ANOVAs, crosstabs, correlations, and regressions. Gabi and Veronica worked on their analyses from VSL on their laptops, while Ashley and Amanda completed their analyses in the CSUC computer labs in the library and Tehama Hall. The breakdown of who ran which analyses is as follows: Frequencies: Gabi: - Have you ever held a gym membership before coming to Chico State? - Are you currently employed?
  • 9.
    8 Veronica: - What genderdo you identify with? - What is your current class standing? Ashley: - Did you come to Chico State as a transfer student? - How old are you? Amanda: - What time of the day are you most likely to utilize the WREC? - On average, how much time do you spend at the WREC per visit? Correlation: Gabi: - Satisfaction with the variety of classes related to overall satisfaction with group classes Amanda: - Whether or not people who are motivated to go to the WREC with friends enjoy group exercise classes. - Whether or not overall satisfaction with the WREC influenced the decision to attend Chico State Regressions: Veronica: - Whether or not healthy eating affects satisfaction with the WREC. Ashley: - Whether or not use of the downstairs weight room affects someone’s level of comfortability going to the WREC alone. - Whether or not someone’s job affects someone’s level of comfortability going to the WREC alone. Means: Group effort: - Satisfaction with cleanliness, friendliness, variety of exercise classes, variety of equipment, and locker availability. - Frequency of listening to hip hop/rap, pop, rock, EDM, classical, alternative, country, and reggae.
  • 10.
    9 - ANOVAs: Ronnie: - Gender vs.WREC influence on decision to attend Chico State. - Gender vs. likelihood of group exercise class enjoyment Gabi: - People who have held a gym membership before attending Chico State related to influence of WREC on CSUC college choice. - Class standing related to comfortability going to gym alone. Ashley: - Wait for machine related to satisfaction with variety of equipment. Amanda: - Gender related to motivation by friends going. Crosstabs: Veronica: - Frequency of hours worked per week related to the number of days per week visiting the WREC. Gabi: - Gender related to length of time spent at the WREC. Ashley: - Gender related to whether or not a pervious gym membership was held. Amanda: - Class level related to number of days per week visiting the WREC.
  • 11.
    10 IV. Analysis &DiscussionofFindings Frequency Frequency tables are run on nominal questions in order to find interesting insights. They show how many respondents choose each specific option available. Table #1: gender Frequency Percent Valid Percent Cumulative Percent Valid Male 44 41.9 41.9 41.9 Female 61 58.1 58.1 100.0 Total 105 100.0 100.0 We ran a frequency table to test how many males and females were taking our surveys. We learned that 41.9% of survey takers were male and 58.1% of takers were female. This was out of 105 respondents. (Q26) Table #2: class level Frequency Percent Valid Percent Cumulative Percent Valid Freshman 3 2.9 2.9 2.9 Sophomore 16 15.2 15.2 18.1 Junior 31 29.5 29.5 47.6 Senior 50 47.6 47.6 95.2 Graduate student 5 4.8 4.8 100.0 Total 105 100.0 100.0
  • 12.
    11 We also rana frequency to see the amount of freshman, sophomores, juniors, seniors and graduate students we had taking our surveys. The percents we got from the tests are as follows. Freshman: 2.9% Sophomore: 15.2% Junior: 29.5% Senior: 47.6% Graduate Student: 4.8%. These numbers obviously show that we had more seniors than any other class standing taking our surveys. This is probably due to the fact that we are all seniors and the people we most often associate with are going to be seniors as well. (Q27) Table #3: Gym Membership Frequency Percent Valid Percent Cumulative Percent Valid Yes 76 72.4 72.4 72.4 No 29 27.6 27.6 100.0 Total 105 100.0 100.0 Of 105 respondents who were asked whether or not they held a gym membership before coming to Chico State, 72.4% of them had a gym membership and 27.6% did not. (Q1) Table #4: Employed Frequency Percent Valid Percent Cumulative Percent Valid Yes 67 63.8 63.8 63.8 No 38 36.2 36.2 100.0 Total 105 100.0 100.0 Of 105 respondents who were asked if they are employed, 63.8% are employed and 36.2% are not. (Q2)
  • 13.
    12 Table #5: Transfer student FrequencyPercent Valid Percent Cumulative Percent Valid Yes 30 28.6 28.6 28.6 No 75 71.4 71.4 100.0 Total 105 100.0 100.0 Of 105 people surveyed, 28.6% of students were transfer students, while 71.4% were not. (Q28) Table #6: Age Frequency Percent Valid Percent Cumulative Percent Valid 17 - 19 21 20.0 20.0 20.0 20 - 22 61 58.1 58.1 78.1 23 - 25 18 17.1 17.1 95.2 26 and above 5 4.8 4.8 100.0 Total 105 100.0 100.0 Of people surveyed 20.0% were between the ages of 17-19, 58.1% of people were ages 20-22, 17.1% of people surveyed were ages 23-25, and lastly 4.8% of people surveyed were aged 26 or older. (Q31) Table #7: Time of day Frequency Percent Valid Percent Cumulative Percent Valid 6am -10am 18 17.1 17.1 17.1 10am - 2pm 17 16.2 16.2 33.3 2pm - 6pm 20 19.0 19.0 52.4 6pm - 10pm 39 37.1 37.1 89.5 10pm - close 11 10.5 10.5 100.0 Total 105 100.0 100.0
  • 14.
    13 The frequency tableabove explains how many of the people who completed the data attend the WREC at any given time of the day. According to the data, about one third of people (37.1%) visit the WREC between 6pm and 10pm, and the least chosen time to go to the WREC (10.5%) is from 10pm to close. This is out of 105 people who filled out the survey. (Q8) Table #8: Time per visit Frequency Percent Valid Percent Cumulative Percent Valid Less than 30 minutes 5 4.8 4.8 4.8 30-59 minutes 36 34.3 34.3 39.0 1-2 hours 58 55.2 55.2 94.3 More than 2 hours 6 5.7 5.7 100.0 Total 105 100.0 100.0 The frequency table above explains how many of the 105 people who completed the survey attend the WREC for any given length of time. According to the data, more than half of people (55.2%) who attend the WREC stay for a length of 1-2 hours, and the least amount of people (4.8%) stay for a length of time of less than 30 minutes. (Q10) Mean Means are run on scale questions to determine the average importance for different variables. Table #9:
  • 15.
    14 Descriptive Statistics N MinimumMaximum Mean Std. Deviation Sat cleanliness 105 2 5 4.55 .588 Sat staff friendliness 105 3 5 4.39 .658 Sat class variety 105 1 5 4.15 .864 Sat equip variety 105 2 5 4.30 .733 Sat locker 105 1 5 4.13 .856 Valid N (listwise) 105 In the mean table above, we discovered which area had the highest level of satisfaction overall. A rating of 1 meant “completely dissatisfied,” and a rating of 5 meant “completely satisfied.” The aspect of the WREC with the highest rating in this question was cleanliness with a mean of 4.55. The lowest rating was given to locker availability of lockers with a mean of 4.13. (Q11a- 11e) Table #10: Descriptive Statistics
  • 16.
    15 N Minimum MaximumMean Std. Deviation hip hop/rap 105 1 5 2.38 1.259 pop 105 1 5 3.10 1.434 rock 105 1 5 3.69 1.521 edm 105 1 5 3.84 1.468 classical 105 1 5 4.79 .675 alternative 105 1 5 4.16 1.264 country 105 1 5 4.36 1.186 reggae 105 1 5 4.73 .654 Valid N (listwise) 105 This mean table described the most popular and unpopular genres of music that respondents listen to while working out at the WREC. A rating of 1 meant “always,” while a rating of 5 meant “never.” We found that the highest rated genre of music was hip hop/rap with a mean of 2.38, and the lowest rated genre of music to listen to was classical with a mean of 4.79. (Q9a-9h) ANOVA ANOVAs, or an analysis of variance, compares one nominal question and one scale question. They compare the means of two or more groups in order to find insights on groupings of people related to some dependent variable. Table #11: Report
  • 17.
    16 WREC influence CSUC genderMean N Std. Deviation Male 2.97 40 1.368 Female 3.13 54 1.374 Total 3.06 94 1.366 Table #11 (continued): ANOVA Table Sum of Squares df Mean Square F Sig. WREC influence CSUC * gender Between Groups (Combin ed) .549 1 .549 .292 .590 Within Groups 173.068 92 1.881 Total 173.617 93 We wanted to test the theory that males are more likely to have the WREC influence their decision to go to Chico State. The mean of men who chose to attend Chico state because of the WREC was 2.97 and the mean of women who chose to attend Chico State because of the WREC was 3.13. These numbers are extremely close and disprove our theory that males were more likely to have the WREC as an influencing factor to attend this college. Also the p-value was 0.590 which shows there is no statistical significance behind our theory. This is because the p- value is greater than .10. (Q26 & Q5) Table #12: Report
  • 18.
    17 motivated by friends genderMean N Std. Deviation Male 3.64 44 1.123 Female 3.87 61 1.258 Total 3.77 105 1.203 Table #12 (continued): ANOVA Table Sum of Square s df Mean Squar e F Sig. motivated by friends * gender Between Groups (Combine d) 1.382 1 1.382 .95 4 .331 Within Groups 149.13 3 10 3 1.448 Total 150.51 4 10 4 The two variables that we chose to examine in this ANOVA table are gender (the independent nominal variable) and whether or not someone is more motivated to go to the gym if their friends are going (the dependent scale variable). Gender being the independent variable will not change, the dependent variable (motivation based on friends) is the variable that we are looking to see a change in the values. The question we are looking to answer is whether or not females are more motivated than males to attend the WREC if their friends are going. The mean for males is 3.64, while the mean for females is 3.87. The mean overall is 3.77. Since the level of significance is 0.331 it means that there is no significant data to suggest that either males or females are more motivated to go to the gym if their friends are going. (Q26 & Q14a) Table #13:
  • 19.
    18 Report Sat equip variety waitedfor machine Mean N Std. Deviation Yes 4.33 60 .729 No 4.24 45 .743 Total 4.30 105 .733 Table #13 (continued): ANOVA Table Sum of Squares df Mean Square F Sig. Sat equip variety * waited for machine Between Groups (Combine d) .203 1 .203 .376 .541 Within Groups 55.644 103 .540 Total 55.848 104 We ran an ANOVA test on Satisfaction with Equipment Variety paired with waiting for a machine. We expected to find that people who were forced to wait for a machine would be less satisfied with the variety of equipment.The dependant nominal variable is satisfaction with the variety of equipment and the independent scale variable is whether or not someone waited for a machine. We found that people who had waited for a machine at the gym had a mean satisfaction of 4.33, while people who did not have to wait for a machine had a satisfaction mean of 4.24. The total mean for this test is 4.30. The P-value is greater than .10, which means there is no statistical significance in these variables. We can draw the conclusion that there is not a significant relationship between waiting for a machine and overall satisfaction with the WREC. (Q11d & Q18) Table #14: Report WREC influence CSUC Gym Membership Mean N Std. Deviation
  • 20.
    19 Yes 3.16 691.400 No 2.80 25 1.258 Total 3.06 94 1.366 Table #14 (continued): ANOVA Table Sum of Squares df Mean Square F Sig. WREC influence CSUC * Gym Membership Between Groups (Combined) 2.371 1 2.371 1.274 .262 Within Groups 171.246 92 1.861 Total 173.617 93 The two variables that we examines in this ANOVA were who held a gym membership before coming to Chico State, and if the WREC influenced their decision to come to Chico State. The p- value is 0.262 meaning that there is no statistical significance regarding holding a gym membership before coming to Chico State and how much the WREC influenced their decision to come to Chico State. Both those who did and did not hold a gym membership before coming to Chico State on average answered they were neutral on the statement “The WREC influenced my decision to attend Chico State.” (Q1 & Q5) Table #15: Report comfortable going alone class level Mean N Std. Deviation Freshman 4.00 3 1.732
  • 21.
    20 Sophomore 4.06 161.289 Junior 4.65 31 .608 Senior 4.44 50 1.091 Graduate student 4.40 5 .894 Total 4.43 105 1.018 Table #15 (continued): ANOVA Table Sum of Squares df Mean Square F Sig. comfortable going alone * class level Between Groups (Combined) 4.160 4 1.040 1.004 .409 Within Groups 103.554 100 1.036 Total 107.714 104 We ran an ANOVA test to compare the two groups of who was comfortable going to the gym alone and who wasn’t. With a p-value of 0.409 we can conclude that there is no statistical significant difference between class levels and level of comfort with going to the WREC alone. They all range between 4.0 and 4.65 meaning that respondents from each grade level “somewhat agree” with the statement “I am comfortable going to the WREC alone.” (Q29 & Q14d) Table #16: Report enjoy group ex gender Mean N Std. Deviation Male 3.40 43 1.198
  • 22.
    21 Female 3.95 601.111 Total 3.72 103 1.175 Table #16 (continued): ANOVA Table Sum of Squares df Mean Square F Sig. enjoy group ex * gender Betw een Group (Combined) 7.706 1 7.706 5.846 .017 Within Groups 133.129 101 1.318 Total 140.835 102 Our group used an ANOVA table to test the theory that women are more likely to enjoy group exercise classes than men. The dependent nominal variable is gender, and the independent scale question is satisfaction with group exercise classes. The means for men and women look extremely close at 3.40 and 3.95. with the overall mean being 3.72. However there was a p- value of .017 which means there is a significant statistical difference between how men and women view group exercise classes. With this data shown we can say that statistically women who attend Chico State enjoy group exercise classes more than men. Crosstab Crosstabs look at nominal questions in relation to other nominal questions. We can tell if there are significant differences between certain categories using the Chi-Squared test. These insights could potentially help marketers analyze market segments or positioning strategies as well as opportunities within the groups. Table #17:
  • 23.
    22 Chi-Square Tests Value df Asymp.Sig. (2- sided) Pearson Chi-Square 20.706a 12 .055 Likelihood Ratio 23.061 12 .027 Linear-by-Linear Association 13.539 1 .000 N of Valid Cases 73 a. 16 cells (80.0%) have expected count less than 5. The minimum expected count is .71. Table #17 (continued): Hours worked * Actual time per week Crosstabulation Hours Worked Actual time per w eek Total Less than once a w eek 1-2 times/w eek 3-4 times/w e ek 5+ times/w ee k 0-10 hours/w eek Count 0 3 5 3 11
  • 24.
    23 % w ithinHours w orked 0.0% 27.3% 45.5% 27.3% 100.0 % % w ithin Actual time per w eek 0.0% 16.7% 20.0% 23.1% 15.1% 11-15 hours/w eek Count 5 7 10 4 26 % w ithin Hours w orked 19.2% 26.9% 38.5% 15.4% 100.0 % % w ithin Actual time per w eek 29.4% 38.9% 40.0% 30.8% 35.6% 16-20 hours/w eek Count 6 6 5 3 20 % w ithin Hours w orked 30.0% 30.0% 25.0% 15.0% 100.0 % % w ithin Actual time per w eek 35.3% 33.3% 20.0% 23.1% 27.4% More than 20 hours/week Count 6 2 4 0 12 % w ithin Hours w orked 50.0% 16.7% 33.3% 0.0% 100.0 % % w ithin Actual time per w eek 35.3% 11.1% 16.0% 0.0% 16.4% Total Count 17 18 25 13 73 % w ithin Hours w orked 23.3% 24.7% 34.2% 17.8% 100.0 % % w ithin Actual time per w eek 100.0% 100.0% 100.0% 100.0% 100.0 % We were interested in finding how working more than 15 hours a week can affect the amount you are able to go to the WREC. Both questions explored had 4 response options. We hypothesized that the people who worked more than 15 hours a week were going to the WREC less than three times a week. The Chi- Square test shows that there are significant differences among the variables because the p-value is 0.055. When you look at the data the bracket holding 16-20 hours of work a week showed that 60% of people attend the WREC less than
  • 25.
    24 three times aweek. This is showing that the majority of people in this bracket are not going to the WREC more than 3 times per week. This is a large contrast to the 0-10 hours per week bracket in which only 27.3% of people are going less than three times a week. When the hours move up to the more than 20 hours per week bracket the amount of people who make it to the WREC less than three times a week jumps to 66.7%. This data supports our hypothesis that if students are working more than 15 hours per week they are attending the WREC less than three times a week. (Q3 & Q6) Table #18: Time per visit * gender Crosstabulation gender TotalMale Female Time per visit Less than 30 minutes Count 4 1 5 % within Time per visit 80.0% 20.0% 100.0% % within gender 9.1% 1.6% 4.8%
  • 26.
    25 30-59 minutes Count9 27 36 % within Time per visit 25.0% 75.0% 100.0% % within gender 20.5% 44.3% 34.3% 1-2 hours Count 27 31 58 % within Time per visit 46.6% 53.4% 100.0% % within gender 61.4% 50.8% 55.2% More than 2 hours Count 4 2 6 % within Time per visit 66.7% 33.3% 100.0% % within gender 9.1% 3.3% 5.7% Total Count 44 61 105 % within Time per visit 41.9% 58.1% 100.0% % within gender 100.0% 100.0% 100.0% Table #18 (continued): Chi-Square Tests Value df Asymp. Sig. (2- sided) Pearson Chi-Square 9.232a 3 .026 Likelihood Ratio 9.537 3 .023 Linear-by-Linear Association 1.231 1 .267 N of Valid Cases 105 a. 4 cells (50.0%) have expected countless than 5. The minimum expected
  • 27.
    26 count is 2.10. Weran this cross tabulation test above in order to show that men stay at the WREC longer than women. There were 2 response options for gender and 4 response options for amount of time spent at the WREC. The Pearson Chi-square value of 0.026 means that there are significant differences between gender and time spent at the WREC. Most males (61.4%) and females (50.8%) spend 1-2 hours at the WREC. Of students who spend more than 2 hours at the WREC, 66.7% are male but only 33.3% are female. Of those who spend 30-59 minutes at the gym 25% are male and 75% are female. Of all males who answered, only 9.1% go for less than 30 minutes while only 1.6% of females spend less than 30 minutes at the WREC. This data proves that our hypothesis was correct, men stay at the WREC for longer periods of time than women. (Q26 & Q10) Table #19: ClassLevel * Actual time per week Crosstabulation Crosstab 29&6 Actual time per week Total Less than once a week 1-2 times/wee k 3-4 times/wee k 5+ times/wee k ClassLevel 1.00 Count 3 5 5 6 19 % within ClassLevel 15.8% 26.3% 26.3% 31.6% 100.0% % within Actual 12.5% 19.2% 13.2% 35.3% 18.1%
  • 28.
    27 time per week 2.00Count 21 21 33 11 86 % within ClassLevel 24.4% 24.4% 38.4% 12.8% 100.0% % within Actual time per week 87.5% 80.8% 86.8% 64.7% 81.9% Total Count 24 26 38 17 105 % within ClassLevel 22.9% 24.8% 36.2% 16.2% 100.0% % within Actual time per week 100.0% 100.0% 100.0% 100.0% 100.0% Table #19 (continued): Chi-Square Tests Value df Asymp. Sig. (2-sided) Pearson Chi-Square 4.548a 3 .208 Likelihood Ratio 4.086 3 .252 Linear-by-Linear Association 1.747 1 .186 N of Valid Cases 105 The Crosstabulation table above was executed using two variables consisting of class level and how many times per week one goes to the WREC. For class level, 5 response options are offered, and for how many times someone goes to the WREC per week there are 4 response
  • 29.
    28 options. In theoriginal data, upperclassmen and lowerclassmen are separated into five different categories: freshmen, sophomores, juniors, seniors and graduate students. For the convenience of the test above, and in order to make the data more reader-friendly, lower classmen (freshmen and sophomores) have been given the value “1,” and upper classmen (juniors, seniors and graduate students) have been given the value “2.” The question being explored is whether or not lower classmen visit the WREC more often than upperclassmen. According to the data, the highest volume of lower classmen visit the WREC 5+ times per week, while the highest volume of upperclassmen that visit the WREC is 3-4 times per week. The lowest volume of lower classmen that attend the WREC is less than once a week at 15.8%, while the lowest volume of upperclassmen that attend the WREC falls under the 5+ days per week option at 12.8%. The Asymp. Sig. is .208. Since the p-value is .1, this means that there is no significant data to suggest that upper classmen visit the WREC more or less days per week than lower classmen, and vice versa. (Q29 & Q6) Table #20: gender * Gym Membership Crosstabulation Gym Membership TotalYes No gender Male Count 34 10 44 % within gender 77.3% 22.7% 100.0% % within Gym Membership 44.7% 34.5% 41.9% Female Count 42 19 61 % within gender 68.9% 31.1% 100.0% % within Gym Membership 55.3% 65.5% 58.1% Total Count 76 29 105 % within gender 72.4% 27.6% 100.0% % within Gym Membership 100.0% 100.0% 100.0% Table #20 (continued): Chi-Square Tests Value df Asymp. Sig. (2- sided) Exact Sig. (2- sided) Exact Sig. (1- sided) Pearson Chi-Square .907a 1 .341 Continuity Correctionb .534 1 .465 Likelihood Ratio .919 1 .338 Fisher's Exact Test .383 .233 Linear-by-Linear Association .898 1 .343
  • 30.
    29 N of ValidCases 105 a. 0 cells (0.0%) have expected count less than 5.The minimum expected countis 12.15. b. Computed onlyfor a 2x2 table We ran a crosstab comparing gender with whether or not they had previously held a gym membership. Both questions offered 2 different responses. In our findings, we discovered that out of 44 men surveyed, 34 had previously held a gym membership (77.3% of males) and that 10 did not (22.7% of males). Out of the 61 women surveyed, 42 had previously held a gym membership (68.9% of women), while 19 had not (31.3% of women). The p-value is greater than 0.10, which makes the two nominal variables not statistically significant. We discovered that men are not more likely to have held a gym membership before coming to Chico State, as we had hypothesized. (Q1 & Q26) Correlation Correlations give us insights between two scale variables by proving a relationship between the variables. The two variables move together in either a positive or negative correlation. A positive correlation means that as one variable goes up, the other does too while a negative correlation means that as one variable goes up, the other goes down. The Pearson Correlation, or r-value, signifies the strength of that connection. Table #21: Descriptive Statistics Mean Std. Deviation N motivated by friends 3.77 1.203 105 enjoy group ex 3.72 1.175 103 Table #21 (continued): Correlations motivated by enjoy group ex
  • 31.
    30 friends motivated by friendsPearson Correlation 1 .038 Sig. (2-tailed) .703 N 105 103 enjoy group ex Pearson Correlation .038 1 Sig. (2-tailed) .703 N 103 103 The two variables explored above are whether or not people are motivated more to go to the gym when their friends are going, and whether or not they enjoy group exercise classes; we expected these two variables to have a positive correlation. The scales were 1-5, 1 being “strongly disagree,” 5 being “strongly agree.” We ran a correlation on these 2 variables in order to find out if the results of one question affects the result of the other. Since the r-value is positive at 0.038, this means that there is an extremely weak positive correlation between the two, based on the rule of thumb that an r-value of 0-0.30 means that there is either a weak correlation or no correlation at all. The p-value is 0.703, which means that there is no significant data suggesting that either one of these variables affects the other. People who are motivated to go to the gym because of their friends are not more likely to enjoy group exercises, and people who enjoy group exercises are not more likely to be motivated to go to the gym if their friends are going. (Q14a & Q14b) Table #22: Descriptive Statistics Mean Std. Deviation N overall satwith WREC 4.31 .934 105
  • 32.
    31 WREC influence CSUC3.06 1.366 94 Table #22 (continued): Correlations overall sat with WREC WREC influence CSUC overall satwith WREC Pearson Correlation 1 .328** Sig. (2-tailed) .001 N 105 94 WREC influence CSUC Pearson Correlation .328** 1 Sig. (2-tailed) .001 N 94 94 **. Correlation is significantatthe 0.01 level (2-tailed). The two variables explored in this correlation are people’s overall satisfaction with the WREC, and whether or not the WREC was an influencing factor for people to attend Chico State. We assumed that there would be a positive correlation between the two. We ran a correlation on these two variables in order to find out if the results of one question affects the result of the other one. The scale we used was 1-5, 1 being “very dissatisfied” and 5 being “very satisfied.” Since the r-value is 0.328, there is a moderate positive correlation of the two variables. This is based on the rule of thumb that an r-value of 0.30-0.70 means there is a moderate correlation. Also, since the p-value is 0.001, this suggests that there is significant data that suggests that the answers to these questions affect each other. Therefore, someone who is satisfied with the WREC is more likely to have had the WREC influence their decision to attend, and someone who was influenced by the WREC to attend Chico State is more likely to be satisfied overall with the WREC itself. (Q17 & Q4)
  • 33.
    32 Table #23: Descriptive Statistics MeanStd. Deviation N Sat class variety 4.15 .864 105 enjoy group ex 3.72 1.175 103 Table #23 (continued): Correlations Sat class variety enjoy group ex Sat class variety Pearson Correlation 1 .222* Sig. (2-tailed) .024 N 105 103 enjoy group ex Pearson Correlation .222* 1 Sig. (2-tailed) .024 N 103 103 *. Correlation is significantatthe 0.05 level (2-tailed). These two variables explored the relationship between respondents’ satisfaction with the WREC’s variety of classes with how much they enjoy going to group exercise classes. We hypothesized that they would be closely related with a positive correlation. The scaled we used was 1-5. The data showed us that the correlation between the variables has a weak positive
  • 34.
    33 connection due tothe r-value being 0.222. We also know that the correlation is highly significant because the p-value is 0.024. This means that as people enjoy group exercise classes more, they also tend to be more satisfied with the variety of classes. (Q11c & Q14b) Regression Regressions look at the relationship between two scale variables. These test explain causation. One independent variable affects a dependent variable. The r-squared value explains how much of the variation in the dependent variable is explained by the independent variable. Table #24: Model Summary Model R R Square Adjusted R Square Std. Error of the Estimate 1 .340a .115 .107 .882 a. Predictors:(Constant),imp healthy eating Table #24 (continued): Coefficientsa Model Unstandardized Coefficients Standardized Coefficients t Sig.B Std. Error Beta 1 (Constant) 3.285 .294 11.191 .000 imp healthy eating .287 .078 .340 3.667 .000 a. DependentVariable:overall satwith WREC
  • 35.
    34 Our group wasinterested in finding out how the importance of healthy eating affected people's overall satisfaction of the WREC. The independent variable is the importance placed on healthy eating, while the dependant variable it overall satisfaction with the WREC. We theorized that if people thought healthy eating was more important, they would have a higher opinion of the WREC overall. We ran a regression to test this theory. There is a 10.7% correlation between the importance of healthy eating and overall WREC satisfaction. Since the t-value is positive at 3.667, there is a strong correlation between these variables. The p-value is 0.000 which gives a very high level of significance. With this information we can say that healthy eating causes higher satisfaction with the WREC. (Q25 & Q17) Table #25: Model Summary Model R R Square Adjusted R Square Std. Error of the Estimate 1 .330a .109 .100 .965 a. Predictors:(Constant),weightroom use per week Table #25 (continued): Coefficientsa Model Unstandardized Coefficients Standardized Coefficients t Sig.B Std. Error Beta 1 (Constant) 3.885 .180 21.581 .000 weightroom use per week .246 .069 .330 3.543 .001 a. DependentVariable:comfortable going alone We ran a regression analysis comparing comfortability with going to the WREC alone as our dependent variable contrasted with how often they use the weight room per week as the independent variable. We expected to find that the less someone uses the weight room, the less comfortable they are going to the WREC alone. The p-value is less than 0.10, making the relationship between the two variables statistically significant, and since the t-value is positive at 3.543 this means that there is a strong correlation. We found that our hypothesis was correct
  • 36.
    35 and that peoplewho never use the downstairs weight room are less likely to feel comfortable going to the WREC alone. The adjusted R-square value is 0.100 (10%) meaning that 10% of variation can be explained by the data. (Q15 & 14d) V. Conclusions In conclusion, we have been able to gain insights to our fellow classmate’s feelings and opinions about the WREC at CSUC. Overall, each and every one of us underestimated the amount of time that it takes to put together a successful marketing research project. The data analysis alone proved to be extremely time consuming. Not to mention, attempting to distribute and collect the surveys themselves was a week-long task. Even after a whole week collecting data, we still ended up with surveys that we needed to discard. As far as the data itself, there were a few different tests that we ran that proved to be highly significant information for the WREC to consider. In one of our regression tests, we examined how the someone’s view of healthy eating influenced their overall satisfaction of the WREC. Since the p-value for this test was 0.000, it showed that there is an extremely strong statistical significance between the two variables. You can view the outcomes from this test in table #24. This test was important because the WREC can use this information in order to
  • 37.
    36 better accommodate itscustomers in the future. Another highly significant test that we ran can be found in table #22. In this correlation test, we examined respondents overall satisfaction with the WREC and whether or not the WREC was an influencing factor in deciding to attend CSUC. The p-value was .001, showing that there was in fact an extremely strong correlation between the two variables. High satisfaction with one of those variables guarantees high satisfaction with the other. A third test that we ran that had a statistical significance was table #18, a crosstab. In this test, we examined gender and whether or not the length of time one gender spends at the WREC is higher or lower than the other. The p-value is .026, meaning that the data is significant. Of the people who spend 30-59 minutes at the WREC, 75% of them are women, while 25% are men. Of those who spend more than 2 hours, 66.7% of them are men, and 33.3% are women. Although not all of our tests provided us with significant data, we were able to learn a lot about the WREC and how slight differences in someone’s demographics or behaviors could have a significant effect on the data that we collect from them. Knowing what we know now, we probably would have started the data collection and analysis stages of the report a few days sooner than we did. However, this report has been an extremely beneficial experience in learning how to create and execute a successful marketing research project. We hope that our findings provide valuable information to the managers at the WREC, and that they are able to better satisfy their customers based on the information we collected in our research.
  • 38.
  • 39.
    38 Hello! You areinvited to participate in our survey regarding exercise activities of Chico State students. This survey will take approximately 5-10 minutes to complete. Please answer these questions as honestly as possible. Your participation in this study is completely voluntary. Thank you very much for your time and support! 1. Have you ever held a gym membership before coming to Chico State? 1. Yes 2. No 2. Are you currently employed? 1. Yes 2. No (Please skip to question 5) 3. On average, how many hours per week do you work? 1. 0-10 hours/week 2. 11-15 hours/week 3. 16-20 hours/week 4. More than 20 hours/week 4. My job prevents me from working out as much as I would like. Strongly disagree Somewhat disagree Neutral Somewhat agree Strongly agree ❏ ❏ ❏ ❏ ❏ 5. The WREC influenced my decision to attend Chico State: Strongly disagree Somewhat disagree Neutral Somewhat agree Strongly agree ❏ ❏ ❏ ❏ ❏ 6. On average, how often do you utilize the WREC? 1. Less than once a week 2. 1-2 times/week 3. 3-4 times/week 4. 5+ times/ week
  • 40.
    39 7. How oftenwould you LIKE to go to the WREC? 1. None 2. Less than once a week 3. 1-2 times/week 4. 3-4 times/week 5. 5+ times/week 8. What time of the day are you most likely to utilize the WREC? 1. 6 am - 10 am 2. 10 am - 2 pm 3. 2 pm - 6 pm 4. 6pm - 10 pm 5. 10 pm - close 9. Please rank (1-5) the following in order of importance when considering what time to go to the WREC (1 being most important, 5 being least important): _________ School schedule (9a) _________ Work schedule (9b) _________ How busy the WREC is (9c) _________ Whether or not friends can go (9d) _________ Group exercise times (9e) 10. On average, how much time do you spend at the WREC per visit? 1. less than 30 minutes 2. 30-59 minutes 3. 1-2 hours 4. More than 2 hours 11. How satisfied are you with the following aspects of the WREC? Completely dissatisfied Somewhat dissatisfied Neither satisfied nor dissatisfied Somewhat satisfied Completely satisfied
  • 41.
    40 Overall cleanliness ❏ ❏❏ ❏ ❏ Friendliness of staff ❏ ❏ ❏ ❏ ❏ Variety of classes ❏ ❏ ❏ ❏ ❏ Variety of equipment ❏ ❏ ❏ ❏ ❏ Availability of lockers ❏ ❏ ❏ ❏ ❏ 12. Please rank in order of importance (1-5) the following things you would most like to be improved about the WREC (1 meaning the most important, 5 meaning the least important): _________ Overall cleanliness (12a) _________ Friendliness of staff (12b) _________ Variety of classes (12c) _________ Variety of equipment (12d) _________ Availability of lockers (12e) 13. Please rank (1-7) the following in order of interest for using to exercise (1 being the most interested in, 7 being the least interested in): _________ Basketball courts (13a) _________ Track (13b) _________ Rock wall (13c) _________ Weight room (downstairs) (13d) _________ Pool (13e) _________ Group exercise classes (13f) _________ Machinery/Cable weights (upstairs) (13g) 14. Rate how much you agree / disagree with these statements: Strongly disagree Somewha t disagree Neutral Somewha t agree Strongly agree I am more motivated to go to the WREC when friends are also going. ❏ ❏ ❏ ❏ ❏ I enjoy group exercise classes. ❏ ❏ ❏ ❏ ❏
  • 42.
    41 I am opento trying new group exercise classes. ❏ ❏ ❏ ❏ ❏ I am comfortable going to the WREC alone. ❏ ❏ ❏ ❏ ❏ I am comfortable using the downstairs weight room. ❏ ❏ ❏ ❏ ❏ After I use the WREC my mood is improved. ❏ ❏ ❏ ❏ ❏ 15. On average, how often do you use the downstairs weight room? 1. Never 2. Less than once a week 3. 1-2 times/week 4. 3-4 times/week 5. 5+ times/week 16. How frequently do you go to group exercise classes? 1. Never 2. Less than once a week 3. 1-2 times/week 4. 3-4 times/week 5. 5+ times/week 17. Overall, how satisfied are you with the WREC? 1. Very dissatisfied 2. Somewhat dissatisfied 3. Neither satisfied nor dissatisfied 4. Somewhat satisfied 5. Very satisfied 18. Over the past semester have you had to wait for an exercise machine? 1. Yes 2. No (Please skip to question 22) You’re over halfway there! 19. How often do you have to wait to use a machine?
  • 43.
    42 Always Most of thetime About half the time Once in awhile Never ❏ ❏ ❏ ❏ ❏ 20. What is the longest time you have ever waited for a machine? 1. Less than 1 minute 2. 1-3 minutes 3. 3-5 minutes 4. 5+ minutes 21. Have you ever waited so long for a machine that you chose to use a different machine or exercise activity instead? 1. Yes 2. No 22. I listen to music when I work out. Always Most of the time About half the time Once in awhile Never (Skip to question 24) ❏ ❏ ❏ ❏ ❏
  • 44.
  • 45.
    44 23. What musicgenres do you listen to while working out? Always Most of the time About half the time Once in awhile Never Hip-hop / rap ❏ ❏ ❏ ❏ ❏ Pop ❏ ❏ ❏ ❏ ❏ Rock ❏ ❏ ❏ ❏ ❏ EDM ❏ ❏ ❏ ❏ ❏ Classical ❏ ❏ ❏ ❏ ❏ Alternative ❏ ❏ ❏ ❏ ❏ Country ❏ ❏ ❏ ❏ ❏ Reggae ❏ ❏ ❏ ❏ ❏ 24. If there were music playing over the speakers at the gym how likely would you be to stay longer? 1. Very likely 2. Somewhat likely 3. Overhead music would have no effect 4. Somewhat unlikely 5. Very unlikely 25. How important is healthy eating to you? 1. Very unimportant 2. Somewhat unimportant 3. Neutral 4. Somewhat important 5. Very important 26. What gender do you identify with? 1. Male
  • 46.
    45 2. Female 27. Whereis your hometown located? 1. Northern California 2. Central California 3. Southern California 4. Other state within the United States 5. International 28. Did you come to Chico State as a transfer student? 1. Yes 2. No 29. What is your current class standing? 1. Freshman 2. Sophomore 3. Junior 4. Senior 5. Graduate student 30. What is your current GPA? 1. 2.0 and below 2. 2.1 - 2.5 3. 2.6 - 3.0 4. 3.1 - 3.5 5. 3.6 and above 31. How old are you? 1. 17-19 2. 20-22 3. 23-25 4. 26 or above
  • 47.
    46 You're done! :)Thank you so much for taking the time to complete our survey!