Workshop 1 เบญจพร ม่วงมัมฤทธิ์
•Download as PPTX, PDF•
0 likes•113 views
Workshop power Point 1
Report
Share
Report
Share
Recommended
Events Catalogue 2015
This document provides information on event services offered by Long Island Event Rentals including lounge furniture, room décor, DJ services, dance floors, photo booths, tents, catering, staffing, and themed parties. They can provide full event packages and rentals for lounge seating, lighting, staging, production, and more. Entertainment options include musicians, magicians, casino games, and team building activities. Photo booths come in standard and "super" interactive styles.
Hansspa friends
Hans Body Spa offers EMS training and body therapy sessions to wake up the body. Sessions range from 20 to 60 minutes and are conducted by Hans, who has degrees in K-Arts and CT research and is a swimming coach and brain respiration specialist. Cash prices are discounted and range from 80,000 to 250,000 won depending on the length and type of session. Private membership is available which allows for 100% advanced reservations by email.
Infografia: Variables SEO Local para Negocios
★★★★★ Qué es Google My Business, Ventajas, Variables que le afectan, cómo hacer Posicionamiento local y Trucos para ganar visibilidad con tu negocio.
Витяг з руководство по обеспечению прозрачности в бюджетно налоговой сфере
Витяг з руководство по обеспечению прозрачности в бюджетно налоговой сфере
Workshop 5 เบญจพร ม่วงสัมฤทธิ์
This chart shows the monthly sales figures and profit margins for a company over the first 5 months of the year. Sales increased each month from January to May, reaching over 3.5 million in May. The profit margin percentage also increased each month during this period, from under 1% in January to over 3% by May.
Workshop 3 เบญจพร ม่วงสัมฤทธิ์
This graph shows sales figures compared to a target across 10 data points. Sales start at 0 and increase by 50,000 each data point up to 400,000. The target line remains steady as sales surpass it after the first few data points, showing that sales eventually exceed the target goal.
Workshop 3 เบญจพร ม่วงสัมฤทธิ์
This chart shows the sales targets and actual sales for 4 categories over 3 time periods. Category 1 met its sales target for Series 1 but fell short for Series 2 and 3. Category 2 exceeded its target for Series 1 and 2 but missed for Series 3. Category 3 surpassed its target for all 3 series. Category 4 failed to reach its target for any of the series.
Workshop 3 เบญจพร ม่วงสัมฤทธิ์
This chart shows the sales targets and actual sales for 4 categories over 3 time periods. Category 1 met its sales target for Series 1 but fell short for Series 2 and 3. Category 2 exceeded its target for Series 1 and 2 but fell short for Series 3. Category 3 met or exceeded its target each period. Category 4 fell short of its target for all 3 periods.
More Related Content
More from benjaporn2634
Workshop 5 เบญจพร ม่วงสัมฤทธิ์
This chart shows the monthly sales figures and profit margins for a company over the first 5 months of the year. Sales increased each month from January to May, reaching over 3.5 million in May. The profit margin percentage also increased each month during this period, from under 1% in January to over 3% by May.
Workshop 3 เบญจพร ม่วงสัมฤทธิ์
This graph shows sales figures compared to a target across 10 data points. Sales start at 0 and increase by 50,000 each data point up to 400,000. The target line remains steady as sales surpass it after the first few data points, showing that sales eventually exceed the target goal.
Workshop 3 เบญจพร ม่วงสัมฤทธิ์
This chart shows the sales targets and actual sales for 4 categories over 3 time periods. Category 1 met its sales target for Series 1 but fell short for Series 2 and 3. Category 2 exceeded its target for Series 1 and 2 but missed for Series 3. Category 3 surpassed its target for all 3 series. Category 4 failed to reach its target for any of the series.
Workshop 3 เบญจพร ม่วงสัมฤทธิ์
This chart shows the sales targets and actual sales for 4 categories over 3 time periods. Category 1 met its sales target for Series 1 but fell short for Series 2 and 3. Category 2 exceeded its target for Series 1 and 2 but fell short for Series 3. Category 3 met or exceeded its target each period. Category 4 fell short of its target for all 3 periods.
More from benjaporn2634 (8)
Workshop 1 เบญจพร ม่วงมัมฤทธิ์
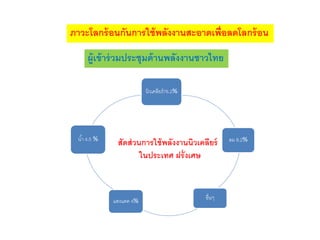
- 1. ภาวะโลกร้อนกันการใช้พลังงานสะอาดเพื่อลดโลกร้อน ผู้เข้าร่วมประชุมด้านพลังงานชาวไทย นิวเคลียร์76.2% ลม 8.2% อื่นๆแสงแดด 4% น้ำ 4.5 % สัดส่วนการใช้พลังงานนิวเคลียร์ ในประเทศ ฝรั่งเศษ