Downloaded 986 times


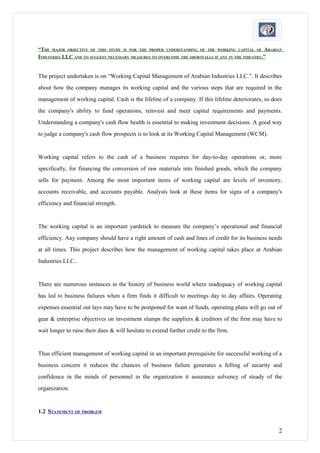
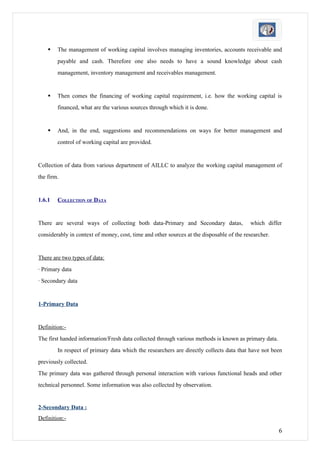

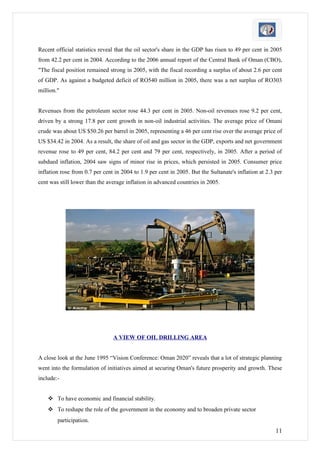


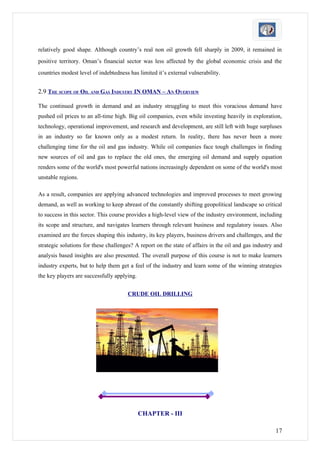

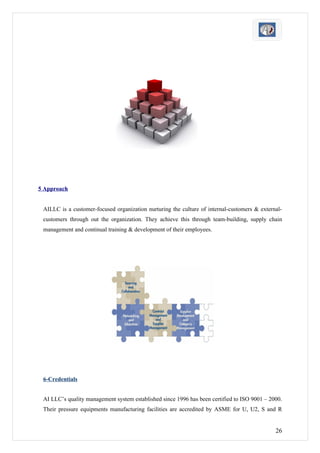
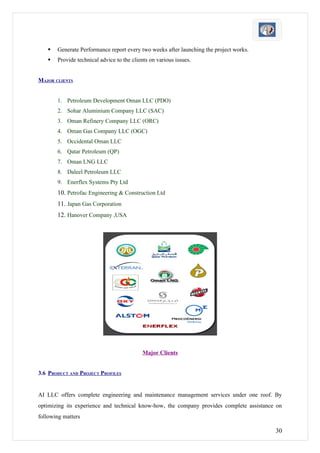
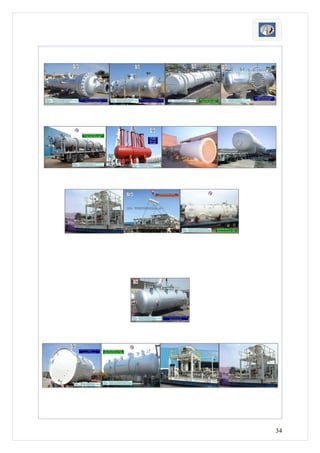
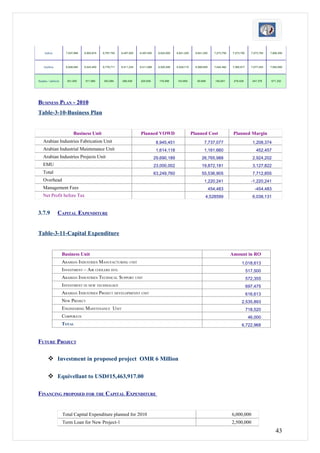
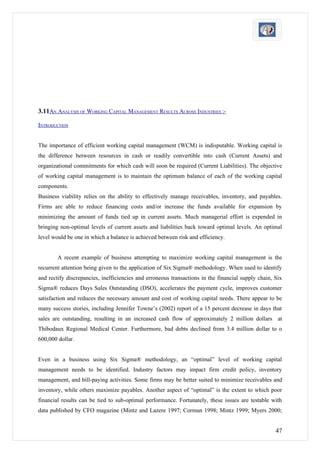
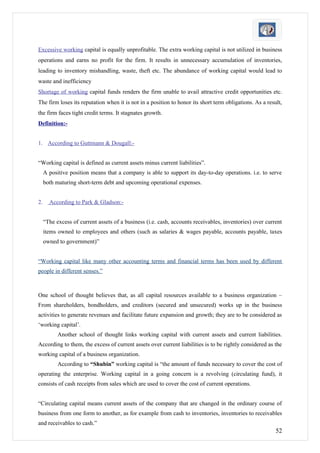
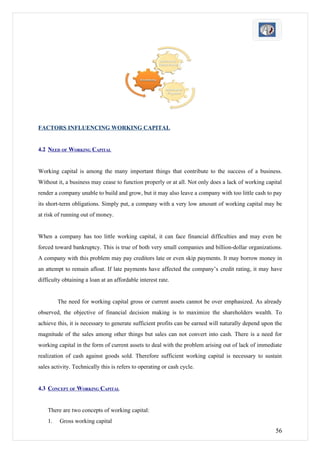
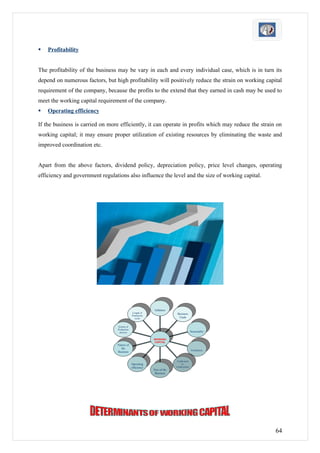
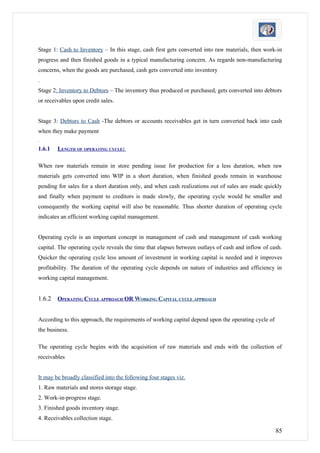
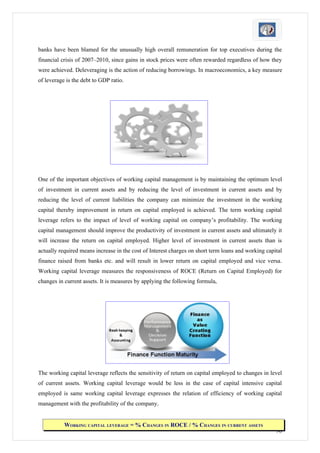
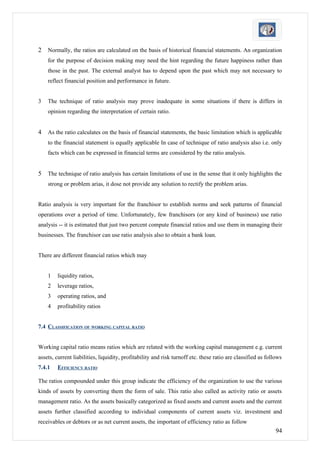
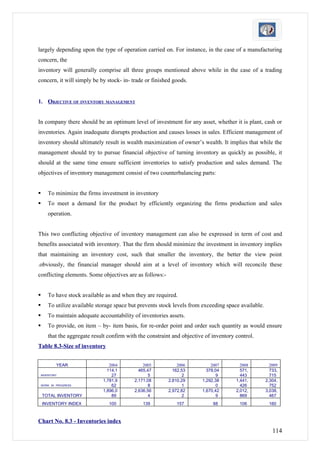
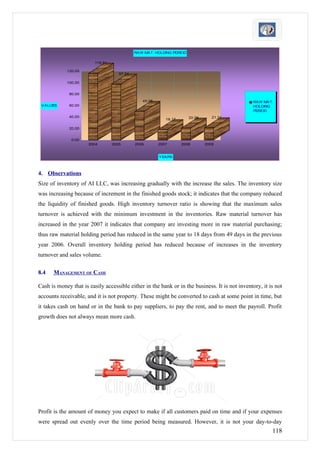
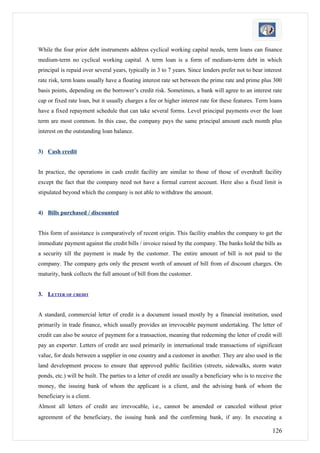
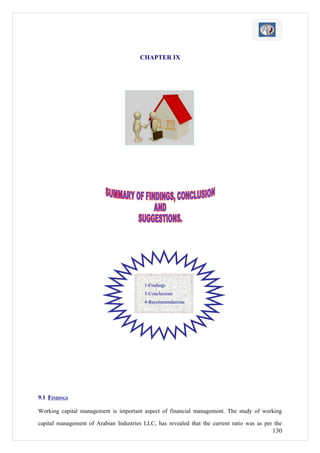
![3.7 FINANCIAL HIGHLIGHTS FOR 2009
[SOURCE: COMPANY REPORT]
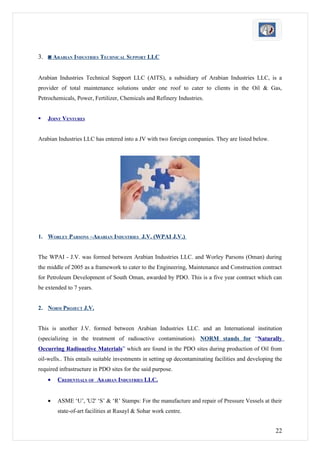
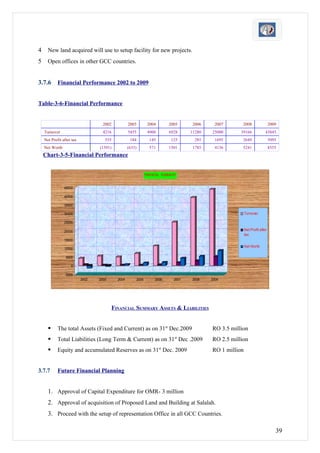
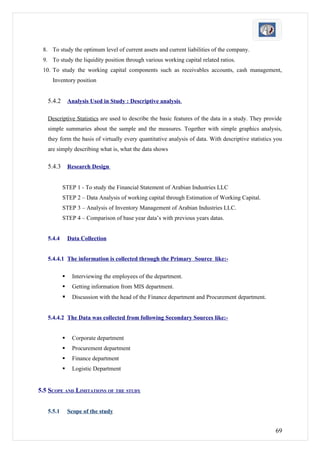
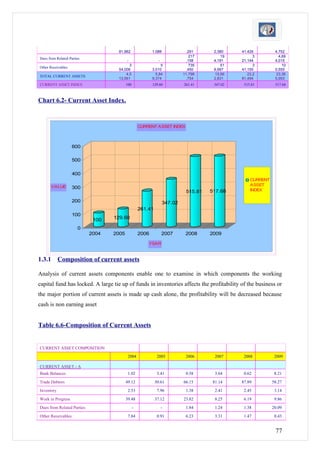
• FINANCIAL PERFORMANCE REVIEW 2009
BUSINESS PLAN – 2010
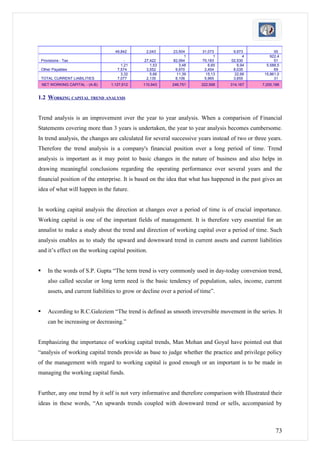
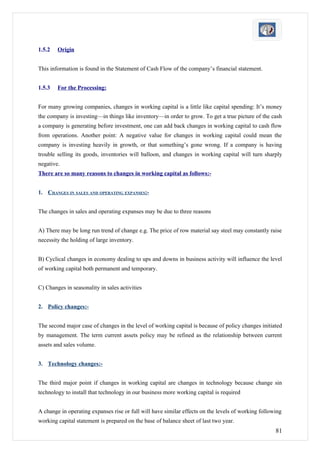
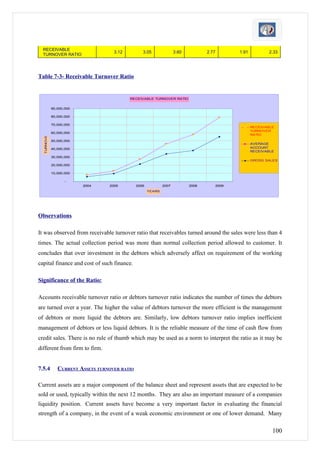
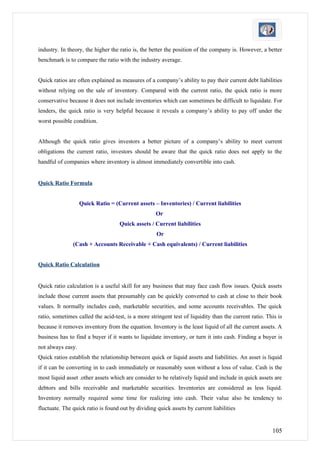
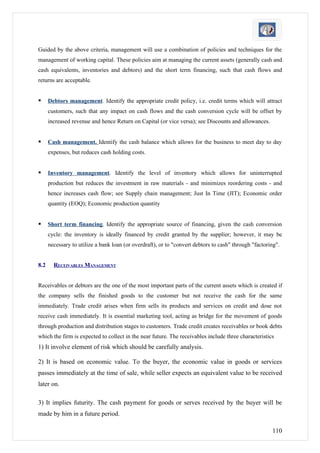
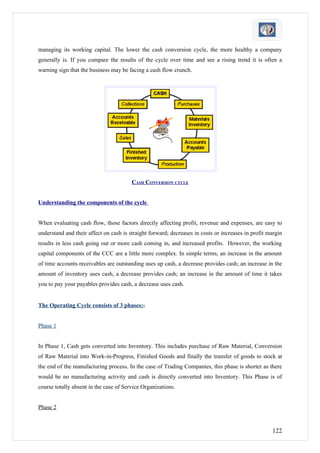
New project inflows (excluding EMU) at RO 41.58 million for the year 2008 vis-à-vis RO 20.977
million in the year 2008 – 103.4% growth year on year.
Backlog of works at RO 40.216 million as at December 2008 (of which RO 37.352 million is
expected to be executed in 2009) against RO 9.98 million as at December 200 – 347.2% growth
year on year.
Projected Gross Sales at RO 42.70 million in 2008 vis-à-vis RO 38.14 million in the previous year
– 113.44% growth year on year
Forecasted Net Profit Before Tax at RO 5.33 million in 2008 as against RO 3.58 million in the
previous year – 59.8% growth over 2008.
35](https://image.slidesharecdn.com/workingcapital-finalproject-ii-101230060546-phpapp01/85/Working-capital-final-project-ii-35-320.jpg)
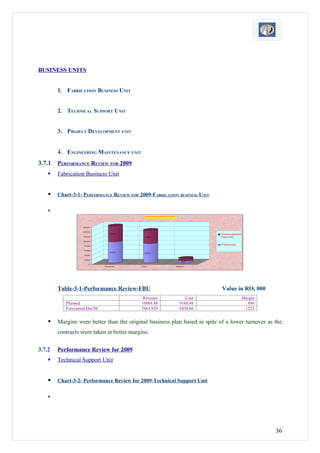
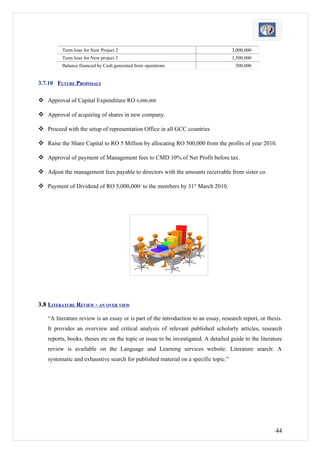
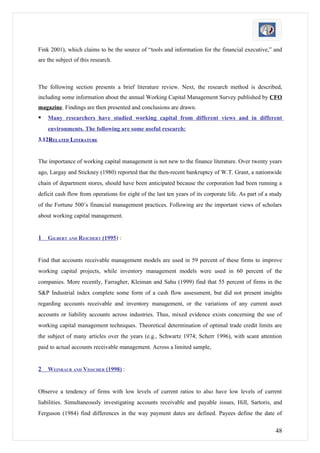

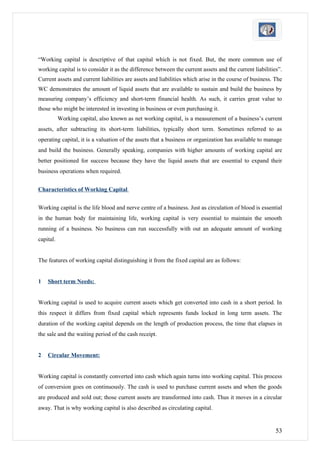
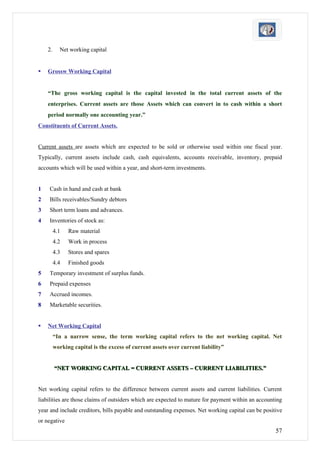

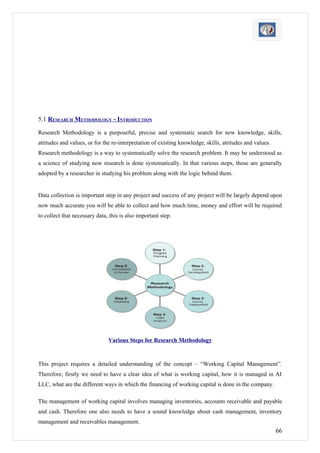
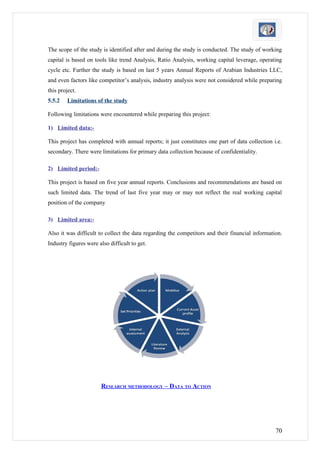
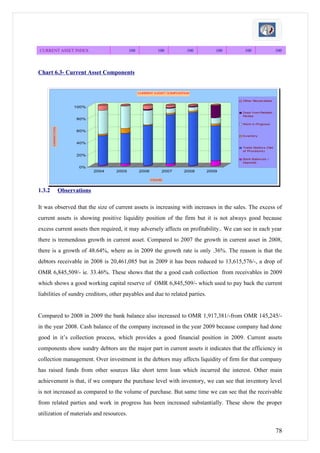
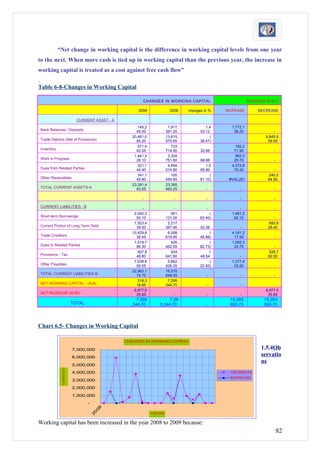
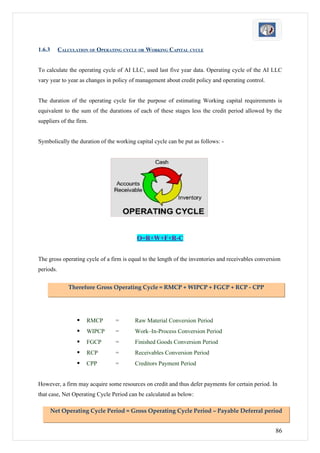
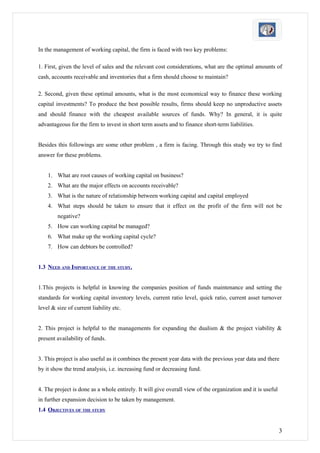
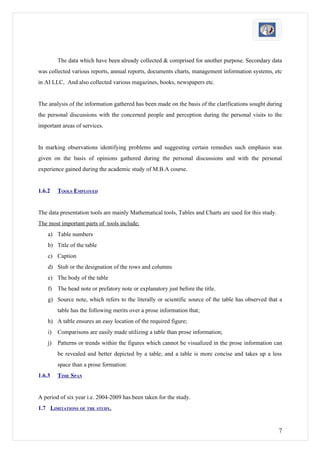
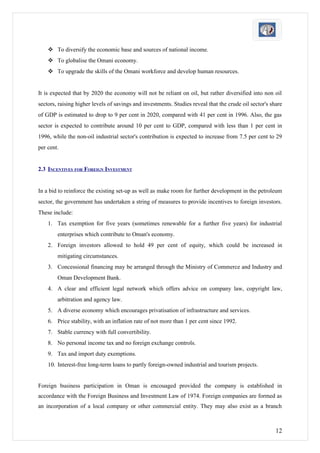
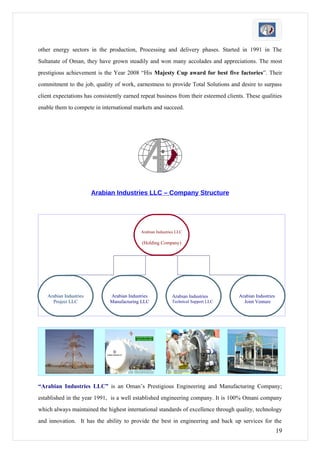
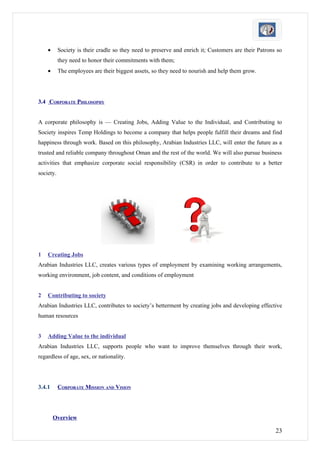
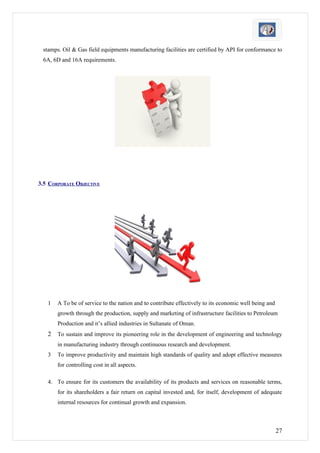
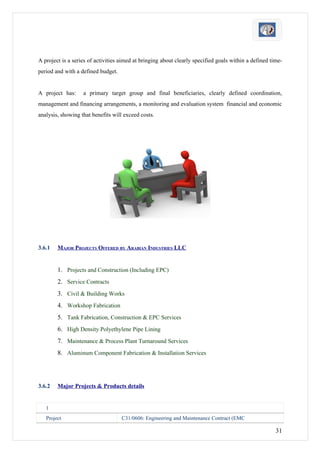
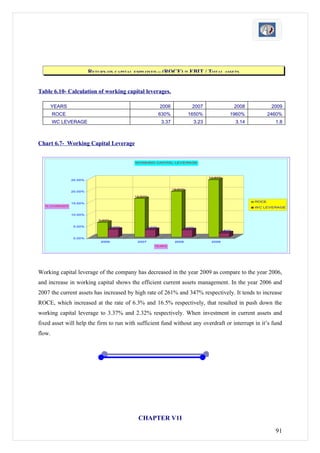
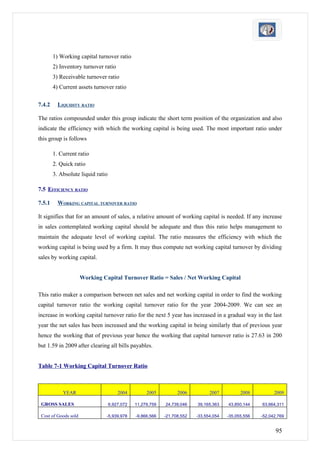
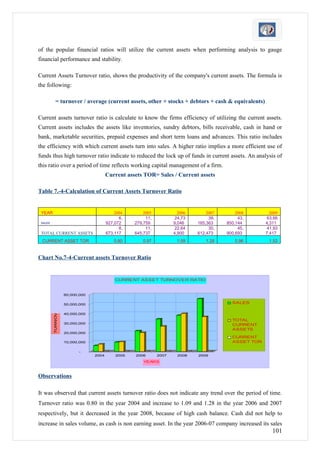
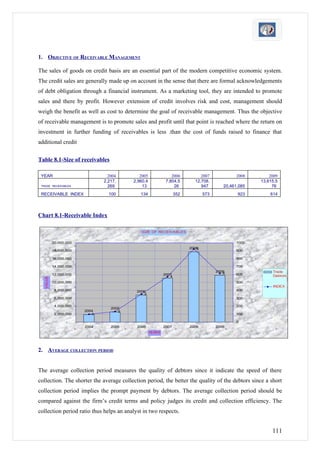
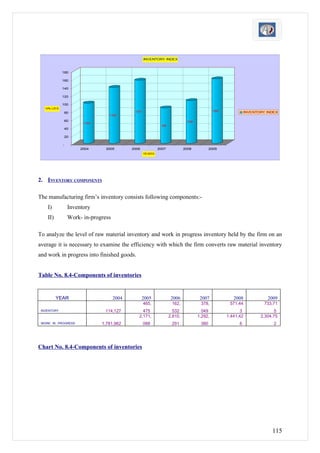
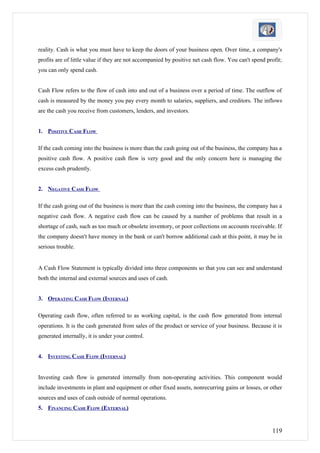
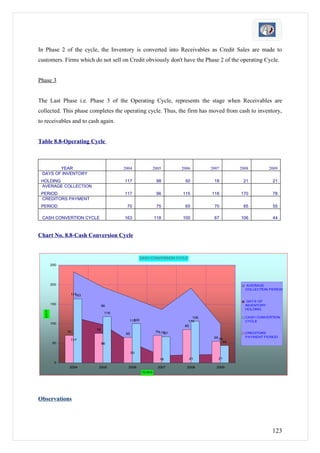
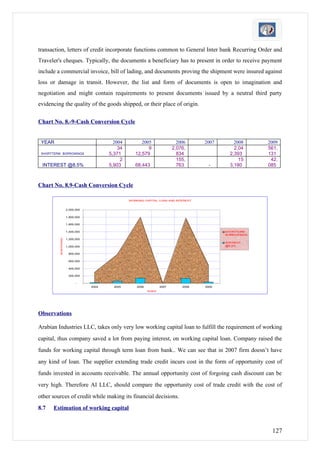
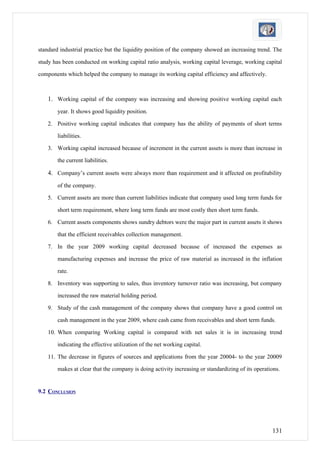
![Together they determine the efficiency of a firm regarding working capital management. While the
operating cycle is the time period from inventory purchase until the receipt of cash, the cash cycle is
the time period from when cash is paid out, to when cash is received.
Refers to the delay between the buying of raw materials and the receipt of cash from sales proceeds. In
other words, operating cycle refers to the number of days taken for the conversion of cash to inventory
through the conversion of accounts receivable to cash. It indicates towards the time period for which
cash is engaged in inventory and accounts receivable. If an operating cycle is long, then there is lower
accessibility to cash for satisfying liabilities for the short term.
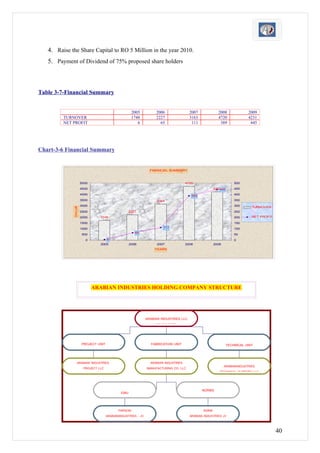
Operating cycle takes into consideration the following elements: accounts payable, cash, accounts
receivable, and inventory replacement. The following formula is used for calculating operating cycle:
(1) Disregarding the capacity to defer payables, the cash conversion cycle is the length of time
between the payment of cash for inventory and receipt of cash from accounts receivable.
(a) If a firm holds its inventory 50 days and collects its accounts receivable in 30 days, then it would
take 80 days for the original investment to be converted back into cash.
(b) However, if the firm has the option of creating an accounts payable for 20 days, the cash
conversion cycle can be reduced from 80 days to 60 days.
(2) The cash conversion cycle is equal to the inventory conversion period, plus the receivables
collection period, minus the payables deferral period.
(a) The inventory conversion period is the average time between buying inventory and selling the
goods. We have: inventory conversion period = inventory/(cost of sales/365) = 365/(inventory
turnover).
(b) The receivables collection period, or days' sales outstanding (DSO), is the average number of days
that it takes to collect on accounts receivable. We have: receivables collection period = receivables/
(sales/365) = 365/receivables turnover.
(c) The payables deferral period is (the accounts payable + wages, benefits, and payroll taxes
payable) / ([the cost of sales + selling, general, and administrative expenses]/365).
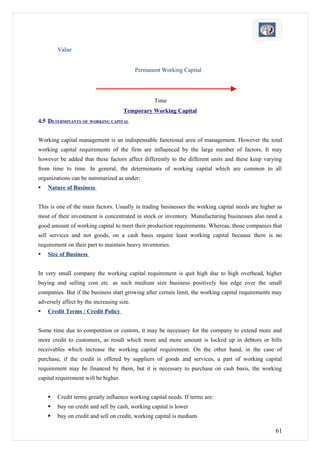
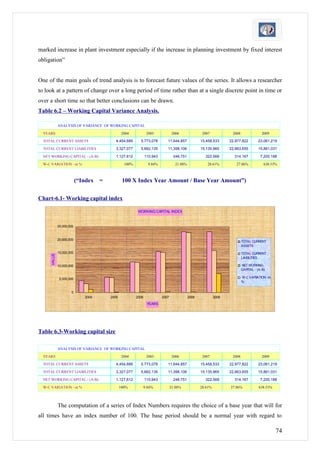
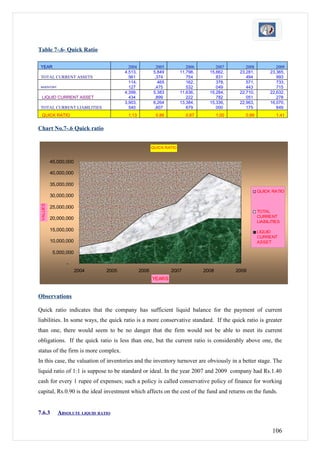
Table 6.9- Operating cycle (No. of Days)
88](https://image.slidesharecdn.com/workingcapital-finalproject-ii-101230060546-phpapp01/85/Working-capital-final-project-ii-88-320.jpg)
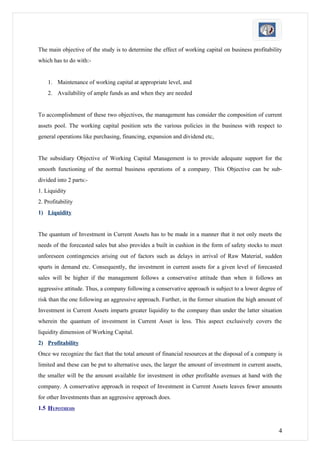
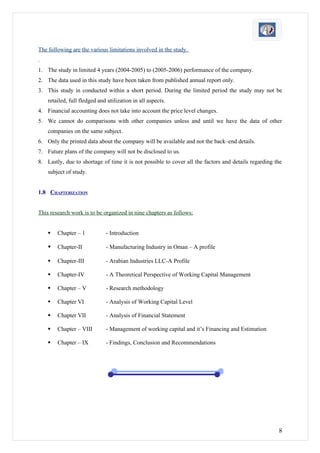
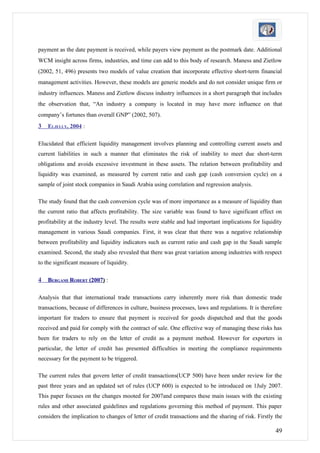
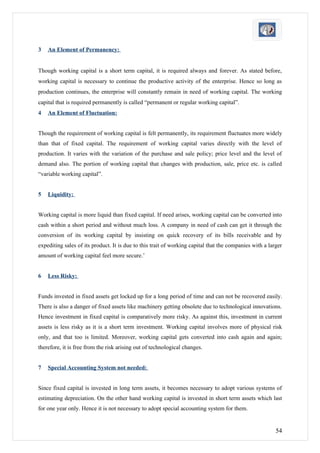
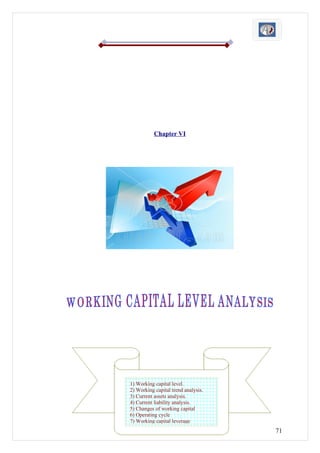
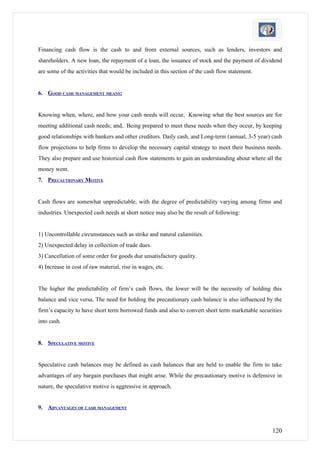
![of asset. Inventory turnover ratio explanations occur very simply through an illustration of high and
low turnover ratios. Despite this, many businesses do not survive due to issues with inventory.
Average inventory and cost of goods sold are the two elements of this ratio. Average inventory is
calculated by adding the stock in the beginning and at the and of the period and dividing it by two. In
case of monthly balances of stock, all the monthly balances are added and the total is divided by the
number of months for which the average is calculated.
A low inventory turnover ratio shows that a company may be overstocking or deficiencies in the
product line or marketing effort. It is a sign of ineffective inventory management because inventory
usually has a zero rate of return and high storage cost.
Higher inventory turnover ratios are considered a positive indicator of effective inventory
management. However, a higher inventory turnover ratio does not always mean better performance. It
sometimes may indicate inadequate inventory level, which may result in decrease in sales.
Although the first calculation is more frequently used, COGS (cost of goods sold) may be substituted
because sales are recorded at market value, while inventories are usually recorded at cost. Also,
average inventory may be used instead of the ending inventory level to minimize seasonal factors.
This ratio should be compared against industry averages. A low turnover implies poor sales and,
therefore, excess inventory. A high ratio implies either strong sales or ineffective buying.
High inventory levels are unhealthy because they represent an investment with a rate of return of zero.
It also opens the company up to trouble should prices begin to fall.
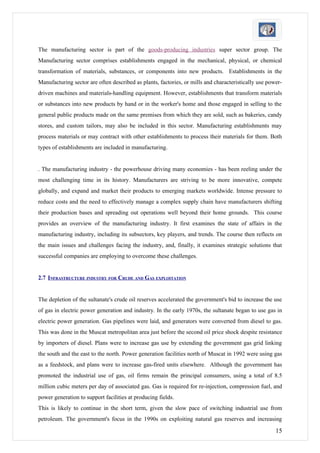
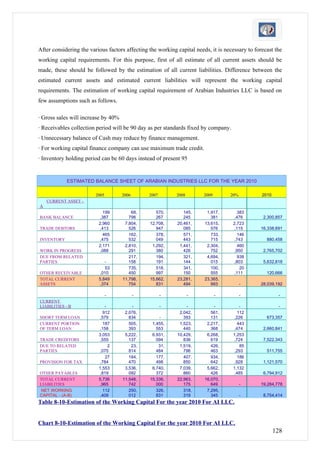
(a) [Inventory Turnover Ratio = Cost of goods sold / Average inventory at cost]
(b) [Inventory Turnover Ratio = Net Sales / Average Inventory at Cost]
(c) [Inventory Turnover Ratio = Net Sales / Average inventory at Selling Price]
(d) [Inventory Turnover Ratio = Net Sales / Inventory]
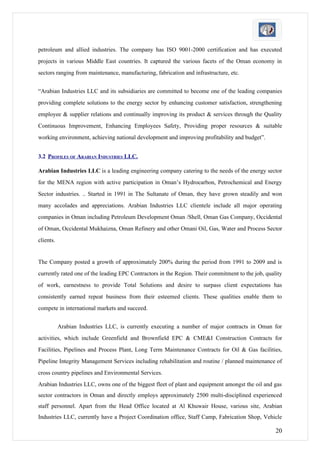
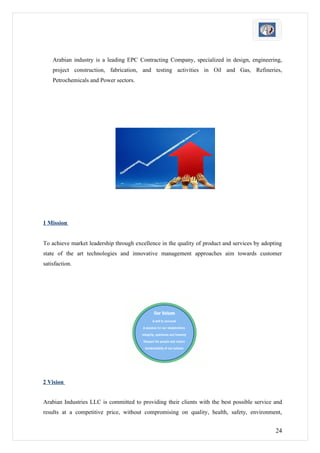
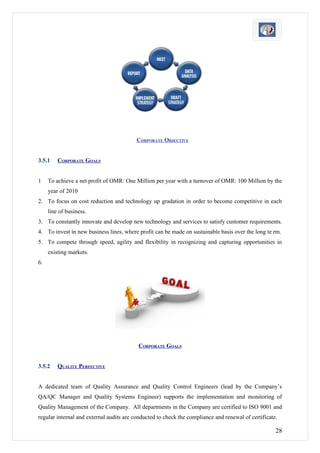
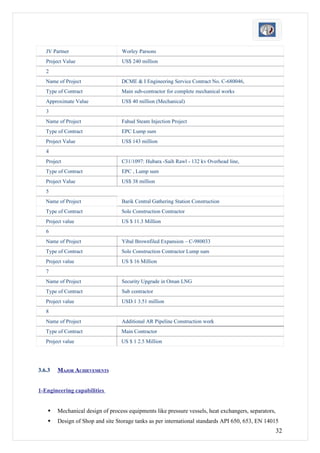
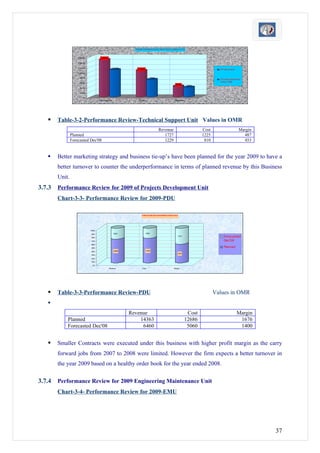
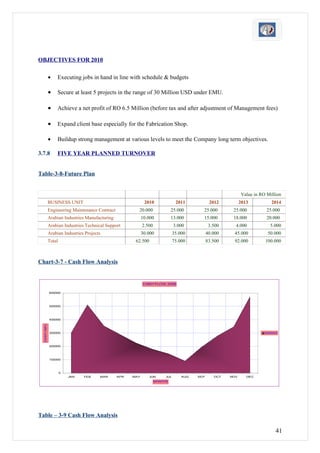
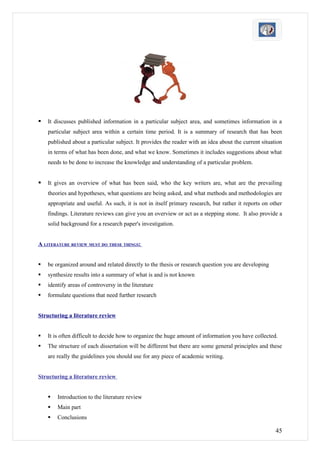
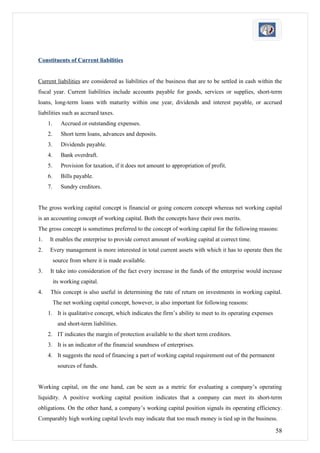
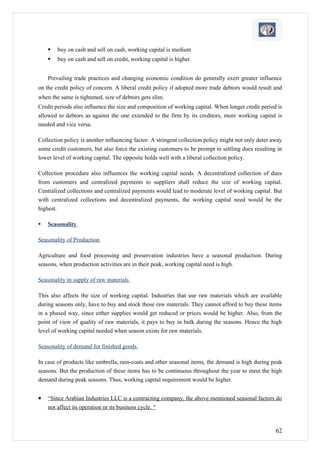
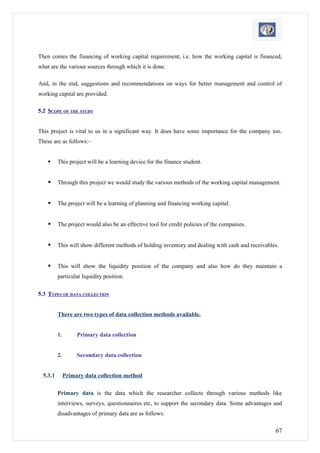
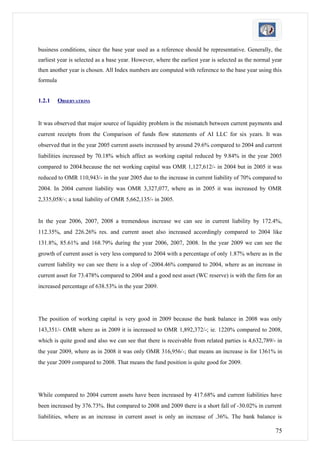
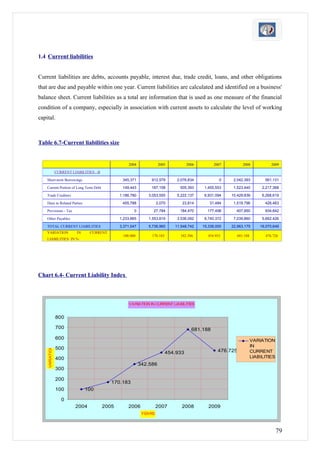
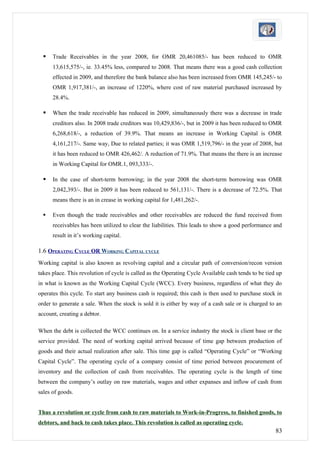
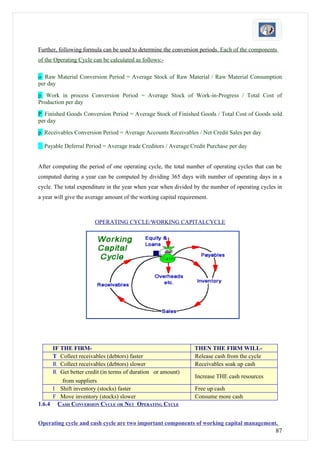
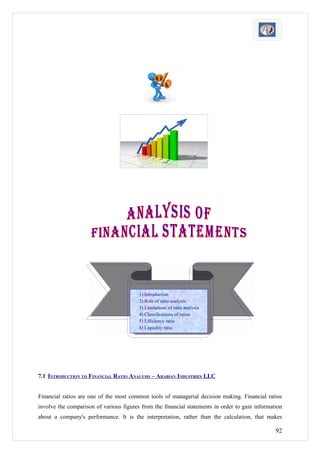
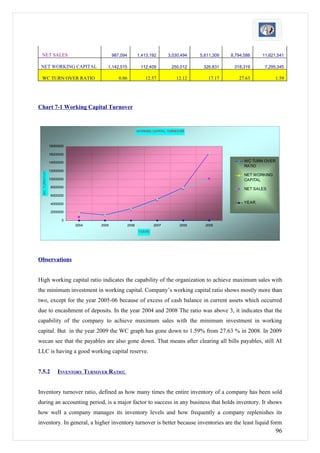
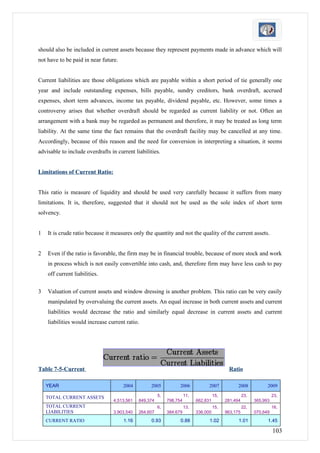
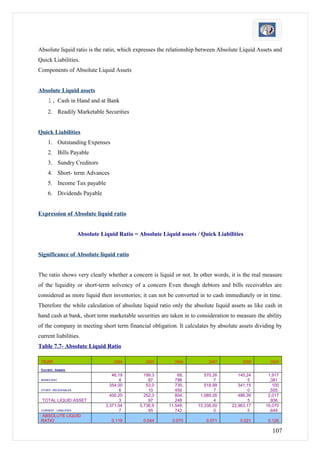
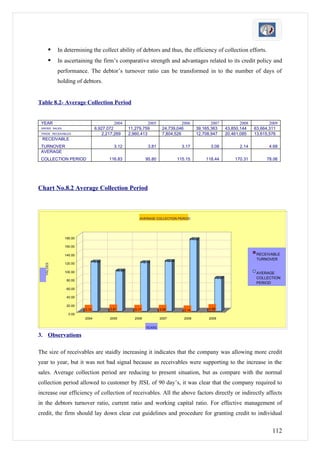
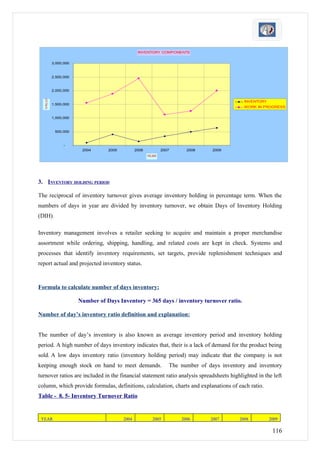
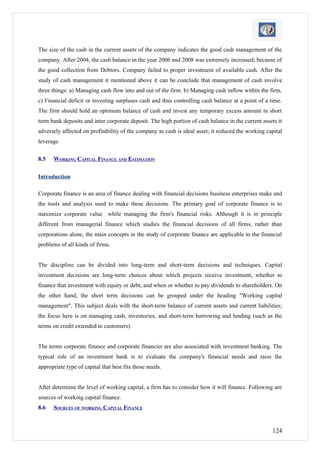
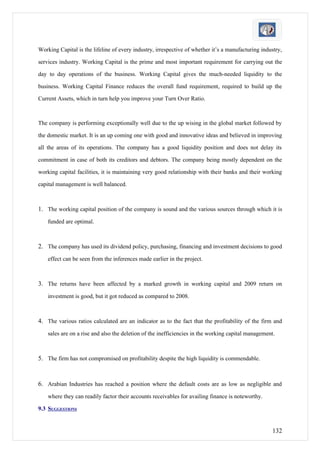
Table 7-2- Inventory Turnover
YEAR 2004 2005 2006 2007 2008 2009
5, 9, 21, 33, 35, 52,04
COST OF GOODS SOLD 939,978 866,566 708,552 554,054 055,556 2,769
1, 2, 2, 1, 2, 3,03
AVERAGE INVENTORY 896,089 636,564 972,822 670,429 012,869 8,467
INVENTORY TURNOVER 3.1 3.7 7.3 20.1 17.4 17.1
97](https://image.slidesharecdn.com/workingcapital-finalproject-ii-101230060546-phpapp01/85/Working-capital-final-project-ii-97-320.jpg)
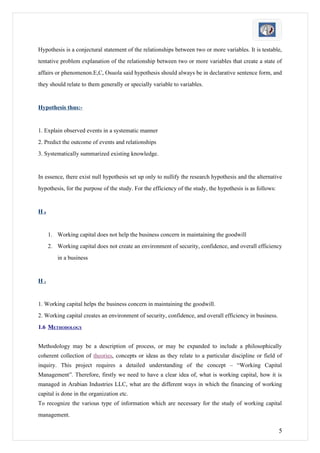
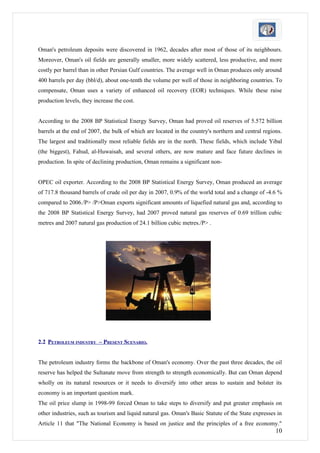
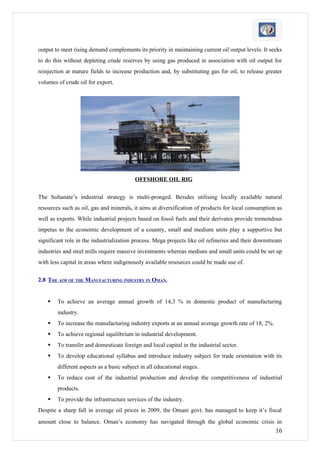
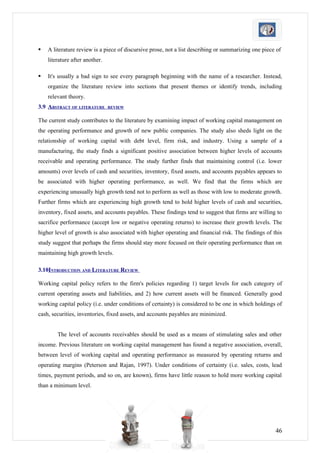
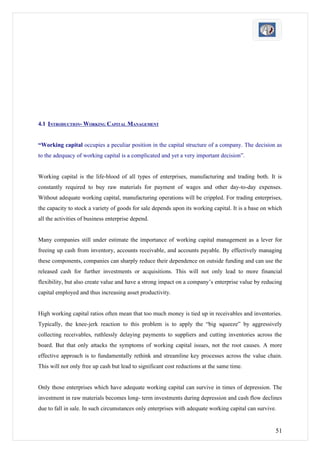
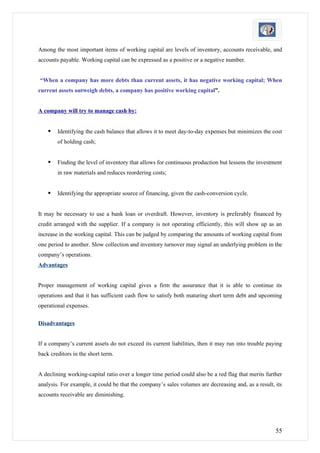
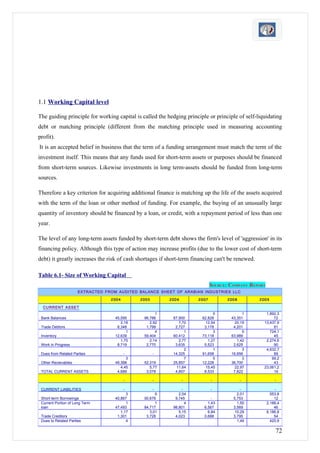
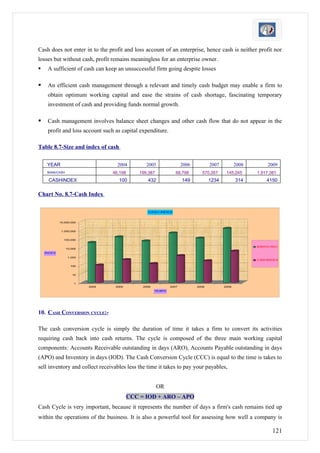
![[Debtors Turnover Ratio = Net Credit Sales / Average Trade Debtors]
The two basic components of accounts receivable turnover ratio are net credit annual sales and
average trade debtors. The trade debtors for the purpose of this ratio include the amount of Trade
Debtors & Bills Receivables. The average receivables are found by adding the opening receivables
and closing balance of receivables and dividing the total by two. It should be noted that provision for
bad and doubtful debts should not be deducted since this may give an impression that some amount of
receivables has been collected. But when the information about opening and closing balances of trade
debtors and credit sales is not available, then the debtors turnover ratio can be calculated by dividing
the total sales by the balance of debtors (inclusive of bills receivables) given. and formula can be
written as follows.
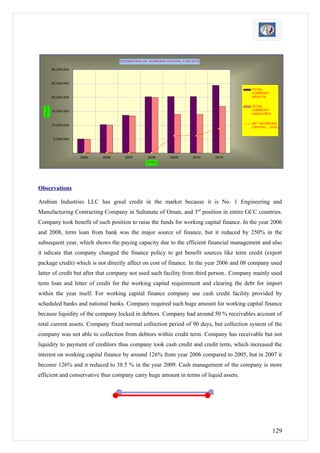
[Debtors Turnover Ratio = Total Sales / Debtors]
The derivation of this ratio is made in following way
Receivable turnover ratio = Gross sales/Average account receivables
Average receivable calculate by opening plus closing balance divide by 2. Increasing volume of
receivables without a matching increase in sales is reflected by a low receivable turnover ratio. It is
indication of slowing down of the collection system or an extend line of credit being allowed by the
customer organization. The latter may be due to the fact that the firm is loosing out to competition. A
credit manager engage in the task of granting credit or monitoring receivable should take the hint from
a falling receivable turnover ratio use his market intelligence to find out the reason behind such failing
trend.
Debtor turnover indicates the number of times debtors turnover each year. Generally the higher the
value of debtor’s turnover, the more is the management of credit.
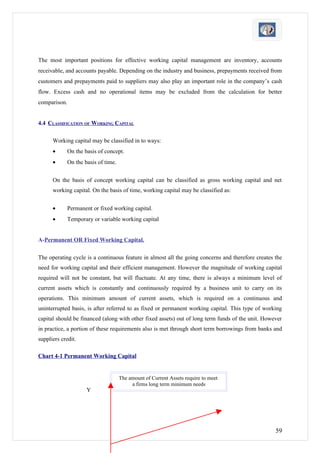
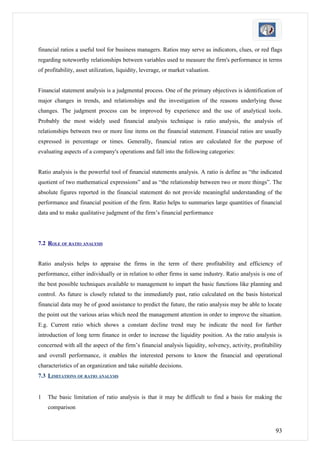
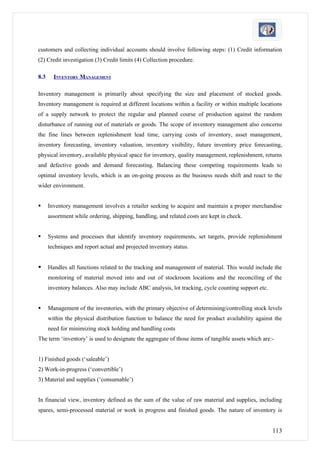
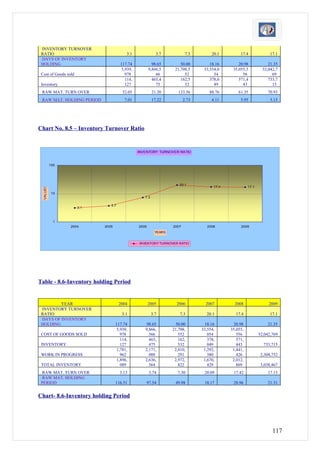
Debtor’s turnover ratio = 365 days/Receivable turnover ratio
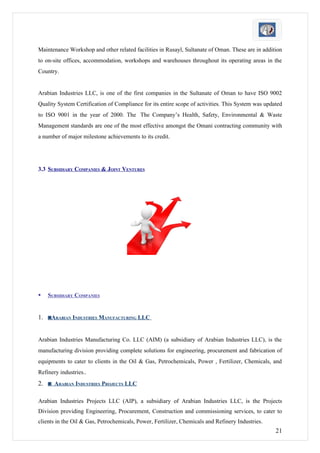
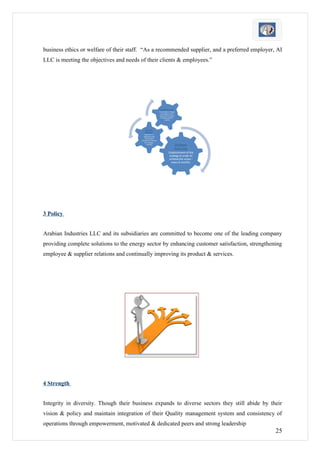
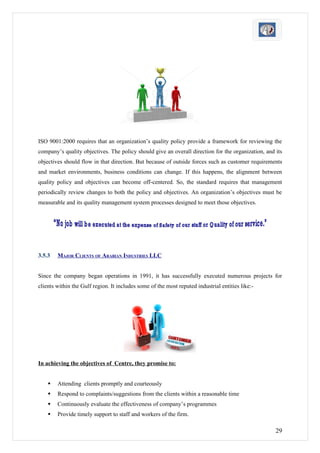
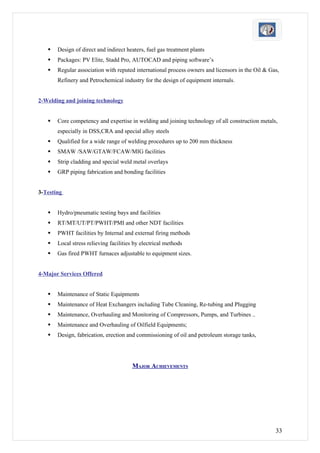
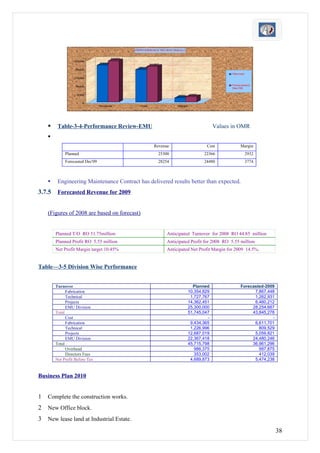
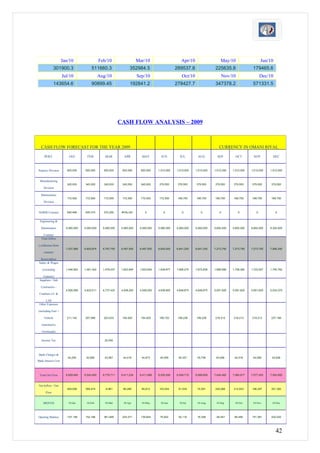
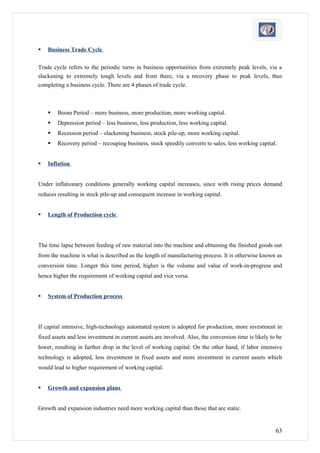
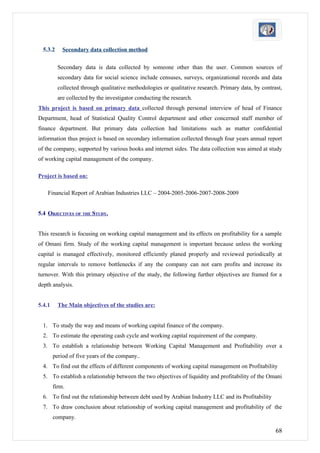
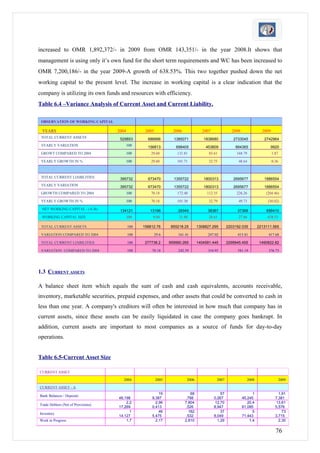
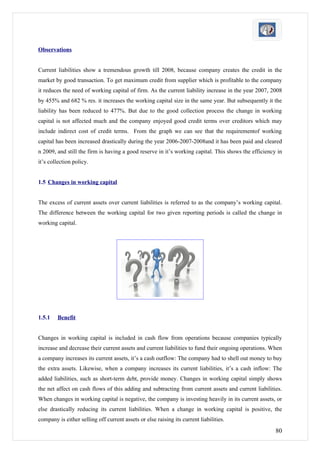
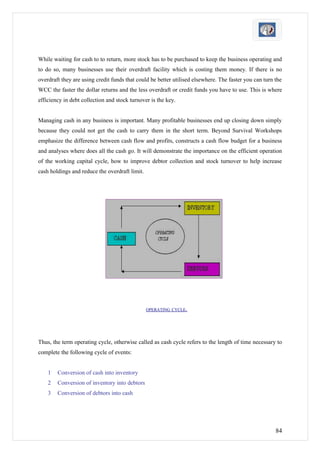
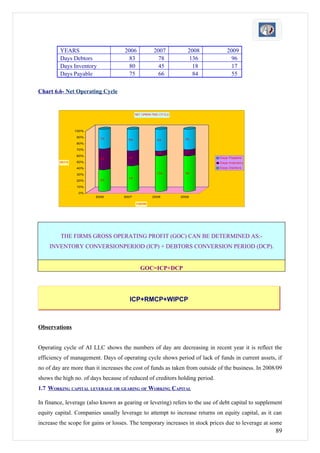
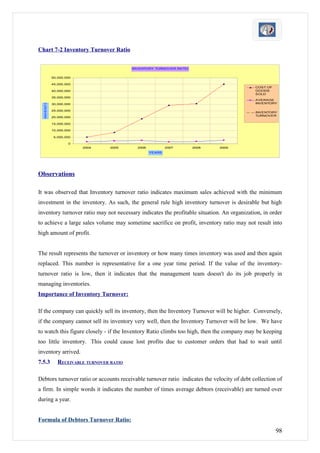
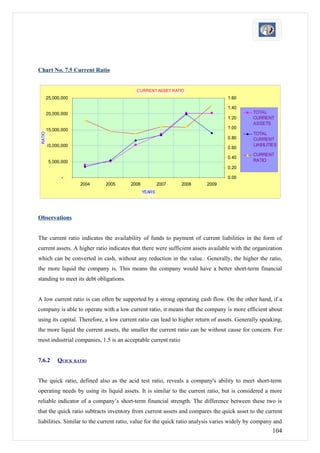
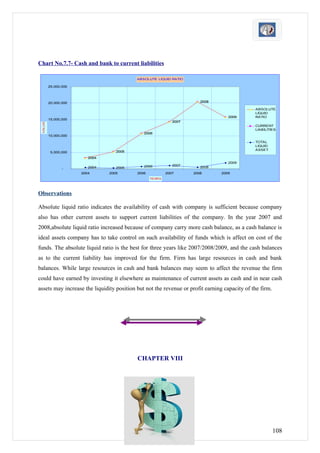
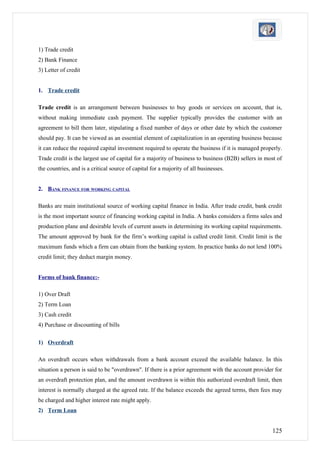
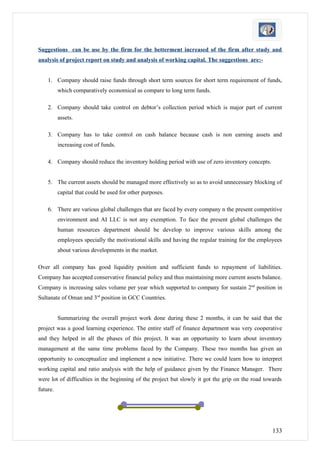
Table 7-3- Debtor’s Turnover Ratio
YEAR 2004 2005 2006 2007 2008 2009
GROSS SALES 6, 11, 24, 39,16 43,8 63,
927,072 279,759 739,046 5,363 50,144 664,311
AVERAGE ACCOUNT 2, 3, 6, 14,15 22,9 27,
RECEIVABLE 217,269 697,475 862,676 8,999 39,489 268,874
99](https://image.slidesharecdn.com/workingcapital-finalproject-ii-101230060546-phpapp01/85/Working-capital-final-project-ii-99-320.jpg)
![with increased investment in current assets, thus current assets turnover ratio increased to 1.28 from
1.09 in the year 2006.
7.6 LIQUIDITY RATIO
7.6.1 CURRENT RATIO
Current ratio may be defined as the relationship between current assets and current liabilities. This
ratio is also known as "working capital ratio". It is a measure of general liquidity and is most widely
used to make the analysis for short term financial position or liquidity of a firm. It is calculated by
dividing the total of the current assets by total of the current liabilities.
The ratio is mainly used to give an idea of the company's ability to pay back its short-term liabilities
(debt and payables) with its short-term assets (cash, inventory, receivables). The higher the current
ratio, the more capable the company is of paying its obligations. A ratio under 1 suggests that the
company would be unable to pay off its obligations if they came due at that point. While this shows
the company is not in good financial health, it does not necessarily mean that it will go bankrupt - as
there are many ways to access financing - but it is definitely not a good sign.
The current ratio can give a sense of the efficiency of a company's operating cycle or its ability to
turn its Product into cash. Companies that have trouble getting paid on their receivables or have long
inventory turnover can run into liquidity problems because they are unable to alleviate their
obligations. Because business operations differ in each industry, it is always more useful to compare
companies within the same industry.
This ratio is similar to the acid-test ratio except that the acid-test ratio does not include inventory and
pre paid as assets that can be liquidated. The components of current ratio (current assets and current
liabilities) can be used to derive working capital (difference between current assets and current
liabilities). Working capital is frequently used to derive the working capital ratio, which is working
capital as a ratio of sales.
[Current Ratio = Current Assets / Current Liabilities]
Or
[Current Assets: Current Liabilities]
Components:
The two basic components of this ratio are current assets and current liabilities. Current assets include
cash and those assets which can be easily converted into cash within a short period of time, generally,
one year, such as marketable securities or readily realizable investments, bills receivables, sundry
debtors, (excluding bad debts or provisions), inventories, work in progress, etc. Prepaid expenses
102](https://image.slidesharecdn.com/workingcapital-finalproject-ii-101230060546-phpapp01/85/Working-capital-final-project-ii-102-320.jpg)


This document outlines the background, problem statement, objectives, hypothesis, and methodology for a study on working capital management at Arabian Industries LLC. Specifically: 1) The background provides context on working capital and its importance for business operations and financial health. 2) The problem statement identifies key issues like determining optimal levels of working capital components and financing sources. 3) The objectives are to maintain appropriate working capital levels and availability of funds, as well as ensure working capital does not negatively impact profitability. 4) The hypothesis is that working capital helps business goodwill and creates an environment of security, confidence, and efficiency. 5) The methodology will involve understanding working capital concepts, components,


![SEERAT PPT[1][1].pptx project in sant ba](https://cdn.slidesharecdn.com/ss_thumbnails/seeratppt11-250513132338-ba2462a8-thumbnail.jpg?width=640&height=640&fit=bounds)