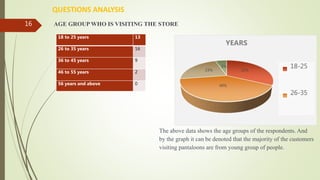
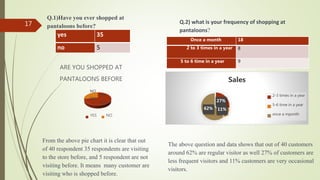
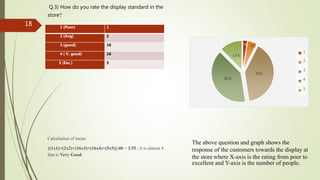
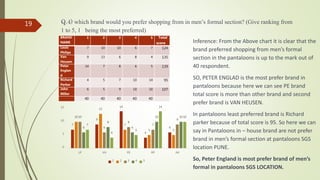
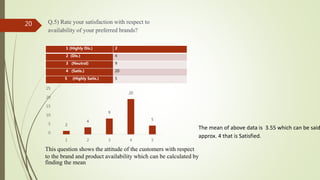
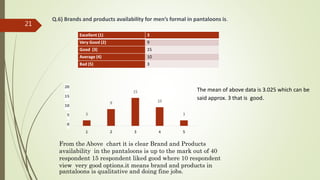
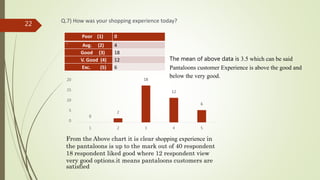
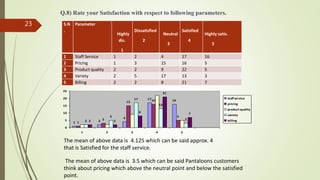
WIP PRESENTATION
ANALYSIS OF CONSUMER BUYING BEHAVIOUR OF MEN’S FORMAL AT
PANTALOONS.
SUBMITTED BY: ABHIJEET SINGH
(DM16D01)
1
SECTOR INFORMATION
 The retail sector in India is emerging as one of the largest sectors in the Indian economy.
 Indian retail one of the fastest growing markets in the world due to economic growth.
 By 2020, retail market in India is projected to reach USD1.3 trillion from USD672 billion in 2016.
 Supermarkets to total 8,500 by 2016 from 500 in 2006.
 Increasing participation from foreign and private players to boost retail infrastructure.
 Revenue generated from online retail is projected to grow to USD60 billion by 2017 and USD70
billion by 2020 from USD6 billion in 2015.
 Retail industry is expected to grow to USD 1.3 trillion by 2020, registering a CAGR of 23.09%
between 2000-2020
2
10%
90%
GDP CONTRIBUTION
RETAIL SECTOR
OTHER SECTOR
204 238 278 321 368 424 518 490 600
13000
0
2000
4000
6000
8000
10000
12000
14000
2000 2002 2004 2006 2008 2010 2012 2013 2015 2020
COMPOUND ANNUAL GROWTH RATE
CAGR
23.09%
3
REASONS FOR GROWTH
 Rising income and demand for quality products to boost consumer expenditure.
Consumer expenditure estimated US$3.6 trillion by 2020 US$1.25 trillion in 2015
 Increasing investments as foreign retailers are continuously entering the Indian market
cumulative FDI inflow in retail for September 2016 stood at US$909.12 million and is
expected to increase with 51 per cent
 Online retail business is the next generation format which has high potential for growth in
the future. The industry is projected to reach US$ 100 billion by 2020 growing from US$
30 billion in 2016
4
RETAIL
ORGANISED
UN-ORGANISED
E-RETAIL
5
ORGANISED RETAIL
 Organized Retail Penetration (ORP) in India is low (8 per cent) in 2015 compared with
that in other countries, such as the US (85 per cent). This indicates strong growth
potential for organized retail in India .
 In 2019, it is estimated that organized retail penetration share would reach 13 percent
and unorganized retail penetration would hold a major share of 87 percent.
Organized retail penetration (2019)
87%
13%
Unorganised retail penetration Organised retail penetration
6
Drivers of organized retail
Demand drivers
 Rising income levels
 Increased urbanization
 Growing aspiration levels and appetite to experiment
 Credit availability
Supply drivers
 New entrants
 Expansion plans of existing players
 Infrastructure augmentation
 Emergence of new categories
7
COMPANY SNAPSHOT
 Pantaloons Fashion & Retail Limited is an Indian premium clothing retail chain.
 The first Pantaloons store was launched in Gariahat, Kolkata in 1997.
COMPANY NAME PANTALOONS
SECTOR RETAIL
PARENT ADITYA BIRLA GROUP
NUMBER OF LOCATION 165 (APPROX)
CEO SHITAL MEHTA
HEADQUARTER Mumbai, Maharashtra, India
8
 Pantaloons was previously controlled by the Future Group, but has now been taken
over by Aditya Birla Nuvo Limited (ABNL).
 Pantaloons has now become a leading retailer in Indian retail industry.
 Pantaloons provides service to consumers in terms of apparels, accessories like
footwear, sunglasses, watches, cosmetics.
 One of the largest loyalty programs: ~4.5 MN members - 60% of sales.
 Rich portfolio spanning men’s, women’s western, women’s ethnic and kids
9
Pantaloons Brand for men’s
F factor
Richard parker
Byford
Urban Eagle
SF
Bare Denim
Pantaloons Brand for women’s
Honey
Rangmanch
Trishaa
Akriti
Candy New york
Annabelle
Non Pantaloons Brands for men’s
Levis
Pepe Jeans
Celio
Peter England
John Miller
Allen Solly
Non Pantaloons Brands for women’s
BIBA
Global DESI
Women(W)
AND
Jealous 21
BRANDS
10
BRANDS OFFERED
11
MAJOR COMPETITOR
 Shopper’s stop
 Max
 Westside
 Lifestyle
 Central
12
VISION: We shall deliver Everything, Everywhere, Every time for Every Indian Consumer in the most
Profitable Manner.
MISION: Infuse Indian Brands with Confidence and Ambition.
MARKET SIZE:
• Market leader in the Retail Industry.
• Captures 43% of the Retail Industry.
• Organized retail sector growing at rate of 5%
• .
• Growing Middle Class Group
13
PROJECT DESCRIPTION
Sample Size – 40
 Secondary objectives are:
 To study the frequency of customer’s visit to the store.
 To study the effectiveness of display of the store in attracting the customers.
 To study the satisfaction with respect to different parameters.
SAMPLING
 Type of sampling: convenient sampling
 Sample size: 40 respondents
 Sample area: Pantaloons, SGS Mall
14
DATA STUDY
 Type of Data – Primary & secondary
 Data collection Method – Survey
 Data collection Tool – Questionnaire Structured
 Statistical tool – Percentage, Mean
 Data presentation – Graph, Pie Chart
15
QUESTIONS ANALYSIS
AGE GROUP WHO IS VISITING THE STORE
18 to 25 years 13
26 to 35 years 16
36 to 45 years 9
46 to 55 years 2
56 years and above 0
32%
40%
23%
5%
YEARS
18-25
26-35
The above data shows the age groups of the respondents. And
by the graph it can be denoted that the majority of the customers
visiting pantaloons are from young group of people.
16
Q.1)Have you ever shopped at
pantaloons before?
yes 35
no 5
YES
72%
NO
28%
ARE YOU SHOPPED AT
PANTALOONS BEFORE
YES NO
From the above pie chart it is clear that out
of 40 respondent 35 respondents are visiting
to the store before, and 5 respondent are not
visiting before. It means many customer are
visiting who is shopped before.
Once a month 18
2 to 3 times in a year 8
5 to 6 time in a year 9
Q.2) what is your frequency of shopping at
pantaloons?
27%
11%62%
Sales
2-3 times in a year
5-6 time in a year
once a mponth
The above question and data shows that out of 40 customers
around 62% are regular visitor as well 27% of customers are
less frequent visitors and 11% customers are very occasional
visitors.
17
Q.3) How do you rate the display standard in the
store?
2% 5%
40%
40%
13%
1
2
3
4
5
1 (Poor) 1
2 (Avg) 2
3 (good) 16
4 ( V. good) 16
5 (Exc.) 5
Calculation of mean:
{(1x1)+(2x2)+(16x3)+(16x4)+(5x5)}/40 = 3.55 ; it is almost 4
that is Very Good.
The above question and graph shows the
response of the customers towards the display at
the store where X-axis is the rating from poor to
excellent and Y-axis is the number of people.
18
Q.4) which brand would you prefer shopping from in men’s formal section? (Give ranking from
1 to 5, 1 being the most preferred)
19
BRAND
NAME
1 2 3 4 5 Total
score
Louis
Philips
7 10 10 6 7 124
Van
Heusen
9 13 6 8 4 135
Peter
Englan
d
14 7 8 6 5 139
Richard
Parker
4 5 7 10 14 95
John
Miller
6 5 9 10 10 107
40 40 40 40 40
7
9
14
4
6
10
13
7
5 5
10
6
8
7
9
6
8
6
10 10
7
4
5
14
10
0
5
10
15
LP VH PE RP JM
1 2 3 4 5
Inference: From the Above chart it is clear that the
brand preferred shopping from men’s formal
section in the pantaloons is up to the mark out of
40 respondent.
SO, PETER ENGLAD is the most prefer brand in
pantaloons because here we can see PE brand
total score is more than other brand and second
prefer brand is VAN HEUSEN.
In pantaloons least preferred brand is Richard
parker because of total score is 95. So here we can
say in Pantaloons in – house brand are not prefer
brand in men’s formal section at pantaloons SGS
location PUNE.
So, Peter England is most prefer brand of men’s
formal in pantaloons SGS LOCATION.
Q.5) Rate your satisfaction with respect to
availability of your preferred brands?
1 (Highly Dis.) 2
2 (Dis.) 4
3 (Neutral) 9
4 (Satis.) 20
5 (Highly Satis.) 5
2
4
9
20
5
0
5
10
15
20
25
1 2 3 4 5
This question shows the attitude of the customers with respect
to the brand and product availability which can be calculated by
finding the mean
The mean of above data is 3.55 which can be said
approx. 4 that is Satisfied.
20
Q.6) Brands and products availability for men’s formal in pantaloons is.
Excellent (1) 3
Very Good (2) 9
Good (3) 15
Average (4) 10
Bad (5) 3
3
9
15
10
3
0
5
10
15
20
1 2 3 4 5
From the Above chart it is clear Brand and Products
availability in the pantaloons is up to the mark out of 40
respondent 15 respondent liked good where 10 respondent
view very good options.it means brand and products in
pantaloons is qualitative and doing fine jobs.
The mean of above data is 3.025 which can be
said approx. 3 that is good.
21
Q.7) How was your shopping experience today?
Poor (1) 0
` Avg. (2) 4
Good (3) 18
V. Good (4) 12
Exc. (5) 6
0
2
18
12
6
0
5
10
15
20
1 2 3 4 5
From the Above chart it is clear shopping experience in
the pantaloons is up to the mark out of 40 respondent
18 respondent liked good where 12 respondent view
very good options.it means pantaloons customers are
satisfied
The mean of above data is 3.5 which can be said
Pantaloons customer Experience is above the good and
below the very good.
22
Q.8) Rate your Satisfaction with respect to following parameters.
S.N
.
Parameter
Highly
dis.
1
Dissatisfied
2
Neutral
3
Satisfied
4
Highly satis.
5
1 Staff Service 1 2 4 17 16
2 Pricing 1 3 15 16 5
3 Product quality 2 2 9 22 5
4 Variety 2 5 17 13 3
5 Billing 2 2 8 21 7
1 2
4
17 16
1
3
15 16
5
2
5
17
13
32 2
8
21
7
0
5
10
15
20
25
1 2 3 4 5
staff service
pricing
product quality
variety
billing
The mean of above data is 4.125 which can be said approx. 4
that is Satisfied for the staff service.
The mean of above data is 3.5 which can be said Pantaloons customers
think about pricing which above the neutral point and below the satisfied
point.
23
The mean of above data is 3.65 which can be said approx. 4
that is Satisfied for the Product Quality.
The mean of above data is 3.72 which can be said approx. 4
that is Neutral for the Billing.
The mean of above data is 3.25 which can be said approx. 3
that is Neutral for the staff Variety.
So we can see here is staff service is very good as compare to the
other option.
24
Q.9) A. Greeted at the store
yes 31
no 9
77%
23% yes
no
B. Explained Product features
yes 27
no 13
yes
67%
no
33%
yes
no
C. Encouraged to try our products
yes 32
no 8
80%
20% yes
no
The above question shows the number of customers being
greeted, explained about the product and were encouraged for a
try out. This shows the staff being inclined towards the
company’s three main point of view of providing service to the
customer at the floor.
25
OBSERVATIONS
& FINDING
 After the Internship, I came to the conclusion that Pantaloons is the most likely store in PUNE.
 Its immediate competitor is Shopper’s Stop & MAX.
 One positive sign for Pantaloons is that it has become the choice for middle class people in PUNE.
 At the same time customers belonging to the higher class society complain about the service
provided to them.
 The customers are also unhappy with the limited brands available in the store.
 Gestures like “Namaste” are always missing from the floor staff.
26
 I was able to find out the frequency of customers visit that 51% of the customers are moderate
visitors that is almost to 1 times in a month.
 The display standards of the store also has the impact on shopping and visit of the customers as the
findings show that the 80 % of the total customers have rated good and very good in the display
likeness of the store.
 Then comes the satisfaction with respect different parameter taking them one by one:
 Brands preferred by the customers is the outhouse brand with respect of the quality and brand
name and secondly the price factor of the product.
 The others parameters such as the staff service, price and the quality of the products, the variety
of options available and lastly the billing process in any store .
 There is staff service is very good .
27
CONCLUSIONS
 It was a great experience to explore the retail sector of pantaloons. Shopping in
India has witnessed a revolution with the changes in the consumer buying behavior
and the whole format of shopping altered .Pantaloons ranks in the pyramid of
Indian retail with its brilliant consumer centered approach and marketing.
Recommendations
 There should be more billing counters as during weekends there is more rush so as
to handle customers in a better way.
 Value added services can be improvised so that customer avail those services and
produce positive feedback towards the brand.
 There should be more variety of the product.
28

Wip presentation

  • 1.
    WIP PRESENTATION ANALYSIS OFCONSUMER BUYING BEHAVIOUR OF MEN’S FORMAL AT PANTALOONS. SUBMITTED BY: ABHIJEET SINGH (DM16D01) 1
  • 2.
    SECTOR INFORMATION  Theretail sector in India is emerging as one of the largest sectors in the Indian economy.  Indian retail one of the fastest growing markets in the world due to economic growth.  By 2020, retail market in India is projected to reach USD1.3 trillion from USD672 billion in 2016.  Supermarkets to total 8,500 by 2016 from 500 in 2006.  Increasing participation from foreign and private players to boost retail infrastructure.  Revenue generated from online retail is projected to grow to USD60 billion by 2017 and USD70 billion by 2020 from USD6 billion in 2015.  Retail industry is expected to grow to USD 1.3 trillion by 2020, registering a CAGR of 23.09% between 2000-2020 2
  • 3.
    10% 90% GDP CONTRIBUTION RETAIL SECTOR OTHERSECTOR 204 238 278 321 368 424 518 490 600 13000 0 2000 4000 6000 8000 10000 12000 14000 2000 2002 2004 2006 2008 2010 2012 2013 2015 2020 COMPOUND ANNUAL GROWTH RATE COMPOUND ANNUAL GROWTH RATE CAGR 23.09% 3
  • 4.
    REASONS FOR GROWTH Rising income and demand for quality products to boost consumer expenditure. Consumer expenditure estimated US$3.6 trillion by 2020 US$1.25 trillion in 2015  Increasing investments as foreign retailers are continuously entering the Indian market cumulative FDI inflow in retail for September 2016 stood at US$909.12 million and is expected to increase with 51 per cent  Online retail business is the next generation format which has high potential for growth in the future. The industry is projected to reach US$ 100 billion by 2020 growing from US$ 30 billion in 2016 4
  • 5.
  • 6.
    ORGANISED RETAIL  OrganizedRetail Penetration (ORP) in India is low (8 per cent) in 2015 compared with that in other countries, such as the US (85 per cent). This indicates strong growth potential for organized retail in India .  In 2019, it is estimated that organized retail penetration share would reach 13 percent and unorganized retail penetration would hold a major share of 87 percent. Organized retail penetration (2019) 87% 13% Unorganised retail penetration Organised retail penetration 6
  • 7.
    Drivers of organizedretail Demand drivers  Rising income levels  Increased urbanization  Growing aspiration levels and appetite to experiment  Credit availability Supply drivers  New entrants  Expansion plans of existing players  Infrastructure augmentation  Emergence of new categories 7
  • 8.
    COMPANY SNAPSHOT  PantaloonsFashion & Retail Limited is an Indian premium clothing retail chain.  The first Pantaloons store was launched in Gariahat, Kolkata in 1997. COMPANY NAME PANTALOONS SECTOR RETAIL PARENT ADITYA BIRLA GROUP NUMBER OF LOCATION 165 (APPROX) CEO SHITAL MEHTA HEADQUARTER Mumbai, Maharashtra, India 8
  • 9.
     Pantaloons waspreviously controlled by the Future Group, but has now been taken over by Aditya Birla Nuvo Limited (ABNL).  Pantaloons has now become a leading retailer in Indian retail industry.  Pantaloons provides service to consumers in terms of apparels, accessories like footwear, sunglasses, watches, cosmetics.  One of the largest loyalty programs: ~4.5 MN members - 60% of sales.  Rich portfolio spanning men’s, women’s western, women’s ethnic and kids 9
  • 10.
    Pantaloons Brand formen’s F factor Richard parker Byford Urban Eagle SF Bare Denim Pantaloons Brand for women’s Honey Rangmanch Trishaa Akriti Candy New york Annabelle Non Pantaloons Brands for men’s Levis Pepe Jeans Celio Peter England John Miller Allen Solly Non Pantaloons Brands for women’s BIBA Global DESI Women(W) AND Jealous 21 BRANDS 10
  • 11.
  • 12.
    MAJOR COMPETITOR  Shopper’sstop  Max  Westside  Lifestyle  Central 12
  • 13.
    VISION: We shalldeliver Everything, Everywhere, Every time for Every Indian Consumer in the most Profitable Manner. MISION: Infuse Indian Brands with Confidence and Ambition. MARKET SIZE: • Market leader in the Retail Industry. • Captures 43% of the Retail Industry. • Organized retail sector growing at rate of 5% • . • Growing Middle Class Group 13
  • 14.
    PROJECT DESCRIPTION Sample Size– 40  Secondary objectives are:  To study the frequency of customer’s visit to the store.  To study the effectiveness of display of the store in attracting the customers.  To study the satisfaction with respect to different parameters. SAMPLING  Type of sampling: convenient sampling  Sample size: 40 respondents  Sample area: Pantaloons, SGS Mall 14
  • 15.
    DATA STUDY  Typeof Data – Primary & secondary  Data collection Method – Survey  Data collection Tool – Questionnaire Structured  Statistical tool – Percentage, Mean  Data presentation – Graph, Pie Chart 15
  • 16.
    QUESTIONS ANALYSIS AGE GROUPWHO IS VISITING THE STORE 18 to 25 years 13 26 to 35 years 16 36 to 45 years 9 46 to 55 years 2 56 years and above 0 32% 40% 23% 5% YEARS 18-25 26-35 The above data shows the age groups of the respondents. And by the graph it can be denoted that the majority of the customers visiting pantaloons are from young group of people. 16
  • 17.
    Q.1)Have you evershopped at pantaloons before? yes 35 no 5 YES 72% NO 28% ARE YOU SHOPPED AT PANTALOONS BEFORE YES NO From the above pie chart it is clear that out of 40 respondent 35 respondents are visiting to the store before, and 5 respondent are not visiting before. It means many customer are visiting who is shopped before. Once a month 18 2 to 3 times in a year 8 5 to 6 time in a year 9 Q.2) what is your frequency of shopping at pantaloons? 27% 11%62% Sales 2-3 times in a year 5-6 time in a year once a mponth The above question and data shows that out of 40 customers around 62% are regular visitor as well 27% of customers are less frequent visitors and 11% customers are very occasional visitors. 17
  • 18.
    Q.3) How doyou rate the display standard in the store? 2% 5% 40% 40% 13% 1 2 3 4 5 1 (Poor) 1 2 (Avg) 2 3 (good) 16 4 ( V. good) 16 5 (Exc.) 5 Calculation of mean: {(1x1)+(2x2)+(16x3)+(16x4)+(5x5)}/40 = 3.55 ; it is almost 4 that is Very Good. The above question and graph shows the response of the customers towards the display at the store where X-axis is the rating from poor to excellent and Y-axis is the number of people. 18
  • 19.
    Q.4) which brandwould you prefer shopping from in men’s formal section? (Give ranking from 1 to 5, 1 being the most preferred) 19 BRAND NAME 1 2 3 4 5 Total score Louis Philips 7 10 10 6 7 124 Van Heusen 9 13 6 8 4 135 Peter Englan d 14 7 8 6 5 139 Richard Parker 4 5 7 10 14 95 John Miller 6 5 9 10 10 107 40 40 40 40 40 7 9 14 4 6 10 13 7 5 5 10 6 8 7 9 6 8 6 10 10 7 4 5 14 10 0 5 10 15 LP VH PE RP JM 1 2 3 4 5 Inference: From the Above chart it is clear that the brand preferred shopping from men’s formal section in the pantaloons is up to the mark out of 40 respondent. SO, PETER ENGLAD is the most prefer brand in pantaloons because here we can see PE brand total score is more than other brand and second prefer brand is VAN HEUSEN. In pantaloons least preferred brand is Richard parker because of total score is 95. So here we can say in Pantaloons in – house brand are not prefer brand in men’s formal section at pantaloons SGS location PUNE. So, Peter England is most prefer brand of men’s formal in pantaloons SGS LOCATION.
  • 20.
    Q.5) Rate yoursatisfaction with respect to availability of your preferred brands? 1 (Highly Dis.) 2 2 (Dis.) 4 3 (Neutral) 9 4 (Satis.) 20 5 (Highly Satis.) 5 2 4 9 20 5 0 5 10 15 20 25 1 2 3 4 5 This question shows the attitude of the customers with respect to the brand and product availability which can be calculated by finding the mean The mean of above data is 3.55 which can be said approx. 4 that is Satisfied. 20
  • 21.
    Q.6) Brands andproducts availability for men’s formal in pantaloons is. Excellent (1) 3 Very Good (2) 9 Good (3) 15 Average (4) 10 Bad (5) 3 3 9 15 10 3 0 5 10 15 20 1 2 3 4 5 From the Above chart it is clear Brand and Products availability in the pantaloons is up to the mark out of 40 respondent 15 respondent liked good where 10 respondent view very good options.it means brand and products in pantaloons is qualitative and doing fine jobs. The mean of above data is 3.025 which can be said approx. 3 that is good. 21
  • 22.
    Q.7) How wasyour shopping experience today? Poor (1) 0 ` Avg. (2) 4 Good (3) 18 V. Good (4) 12 Exc. (5) 6 0 2 18 12 6 0 5 10 15 20 1 2 3 4 5 From the Above chart it is clear shopping experience in the pantaloons is up to the mark out of 40 respondent 18 respondent liked good where 12 respondent view very good options.it means pantaloons customers are satisfied The mean of above data is 3.5 which can be said Pantaloons customer Experience is above the good and below the very good. 22
  • 23.
    Q.8) Rate yourSatisfaction with respect to following parameters. S.N . Parameter Highly dis. 1 Dissatisfied 2 Neutral 3 Satisfied 4 Highly satis. 5 1 Staff Service 1 2 4 17 16 2 Pricing 1 3 15 16 5 3 Product quality 2 2 9 22 5 4 Variety 2 5 17 13 3 5 Billing 2 2 8 21 7 1 2 4 17 16 1 3 15 16 5 2 5 17 13 32 2 8 21 7 0 5 10 15 20 25 1 2 3 4 5 staff service pricing product quality variety billing The mean of above data is 4.125 which can be said approx. 4 that is Satisfied for the staff service. The mean of above data is 3.5 which can be said Pantaloons customers think about pricing which above the neutral point and below the satisfied point. 23
  • 24.
    The mean ofabove data is 3.65 which can be said approx. 4 that is Satisfied for the Product Quality. The mean of above data is 3.72 which can be said approx. 4 that is Neutral for the Billing. The mean of above data is 3.25 which can be said approx. 3 that is Neutral for the staff Variety. So we can see here is staff service is very good as compare to the other option. 24
  • 25.
    Q.9) A. Greetedat the store yes 31 no 9 77% 23% yes no B. Explained Product features yes 27 no 13 yes 67% no 33% yes no C. Encouraged to try our products yes 32 no 8 80% 20% yes no The above question shows the number of customers being greeted, explained about the product and were encouraged for a try out. This shows the staff being inclined towards the company’s three main point of view of providing service to the customer at the floor. 25
  • 26.
    OBSERVATIONS & FINDING  Afterthe Internship, I came to the conclusion that Pantaloons is the most likely store in PUNE.  Its immediate competitor is Shopper’s Stop & MAX.  One positive sign for Pantaloons is that it has become the choice for middle class people in PUNE.  At the same time customers belonging to the higher class society complain about the service provided to them.  The customers are also unhappy with the limited brands available in the store.  Gestures like “Namaste” are always missing from the floor staff. 26
  • 27.
     I wasable to find out the frequency of customers visit that 51% of the customers are moderate visitors that is almost to 1 times in a month.  The display standards of the store also has the impact on shopping and visit of the customers as the findings show that the 80 % of the total customers have rated good and very good in the display likeness of the store.  Then comes the satisfaction with respect different parameter taking them one by one:  Brands preferred by the customers is the outhouse brand with respect of the quality and brand name and secondly the price factor of the product.  The others parameters such as the staff service, price and the quality of the products, the variety of options available and lastly the billing process in any store .  There is staff service is very good . 27
  • 28.
    CONCLUSIONS  It wasa great experience to explore the retail sector of pantaloons. Shopping in India has witnessed a revolution with the changes in the consumer buying behavior and the whole format of shopping altered .Pantaloons ranks in the pyramid of Indian retail with its brilliant consumer centered approach and marketing. Recommendations  There should be more billing counters as during weekends there is more rush so as to handle customers in a better way.  Value added services can be improvised so that customer avail those services and produce positive feedback towards the brand.  There should be more variety of the product. 28