Download to read offline
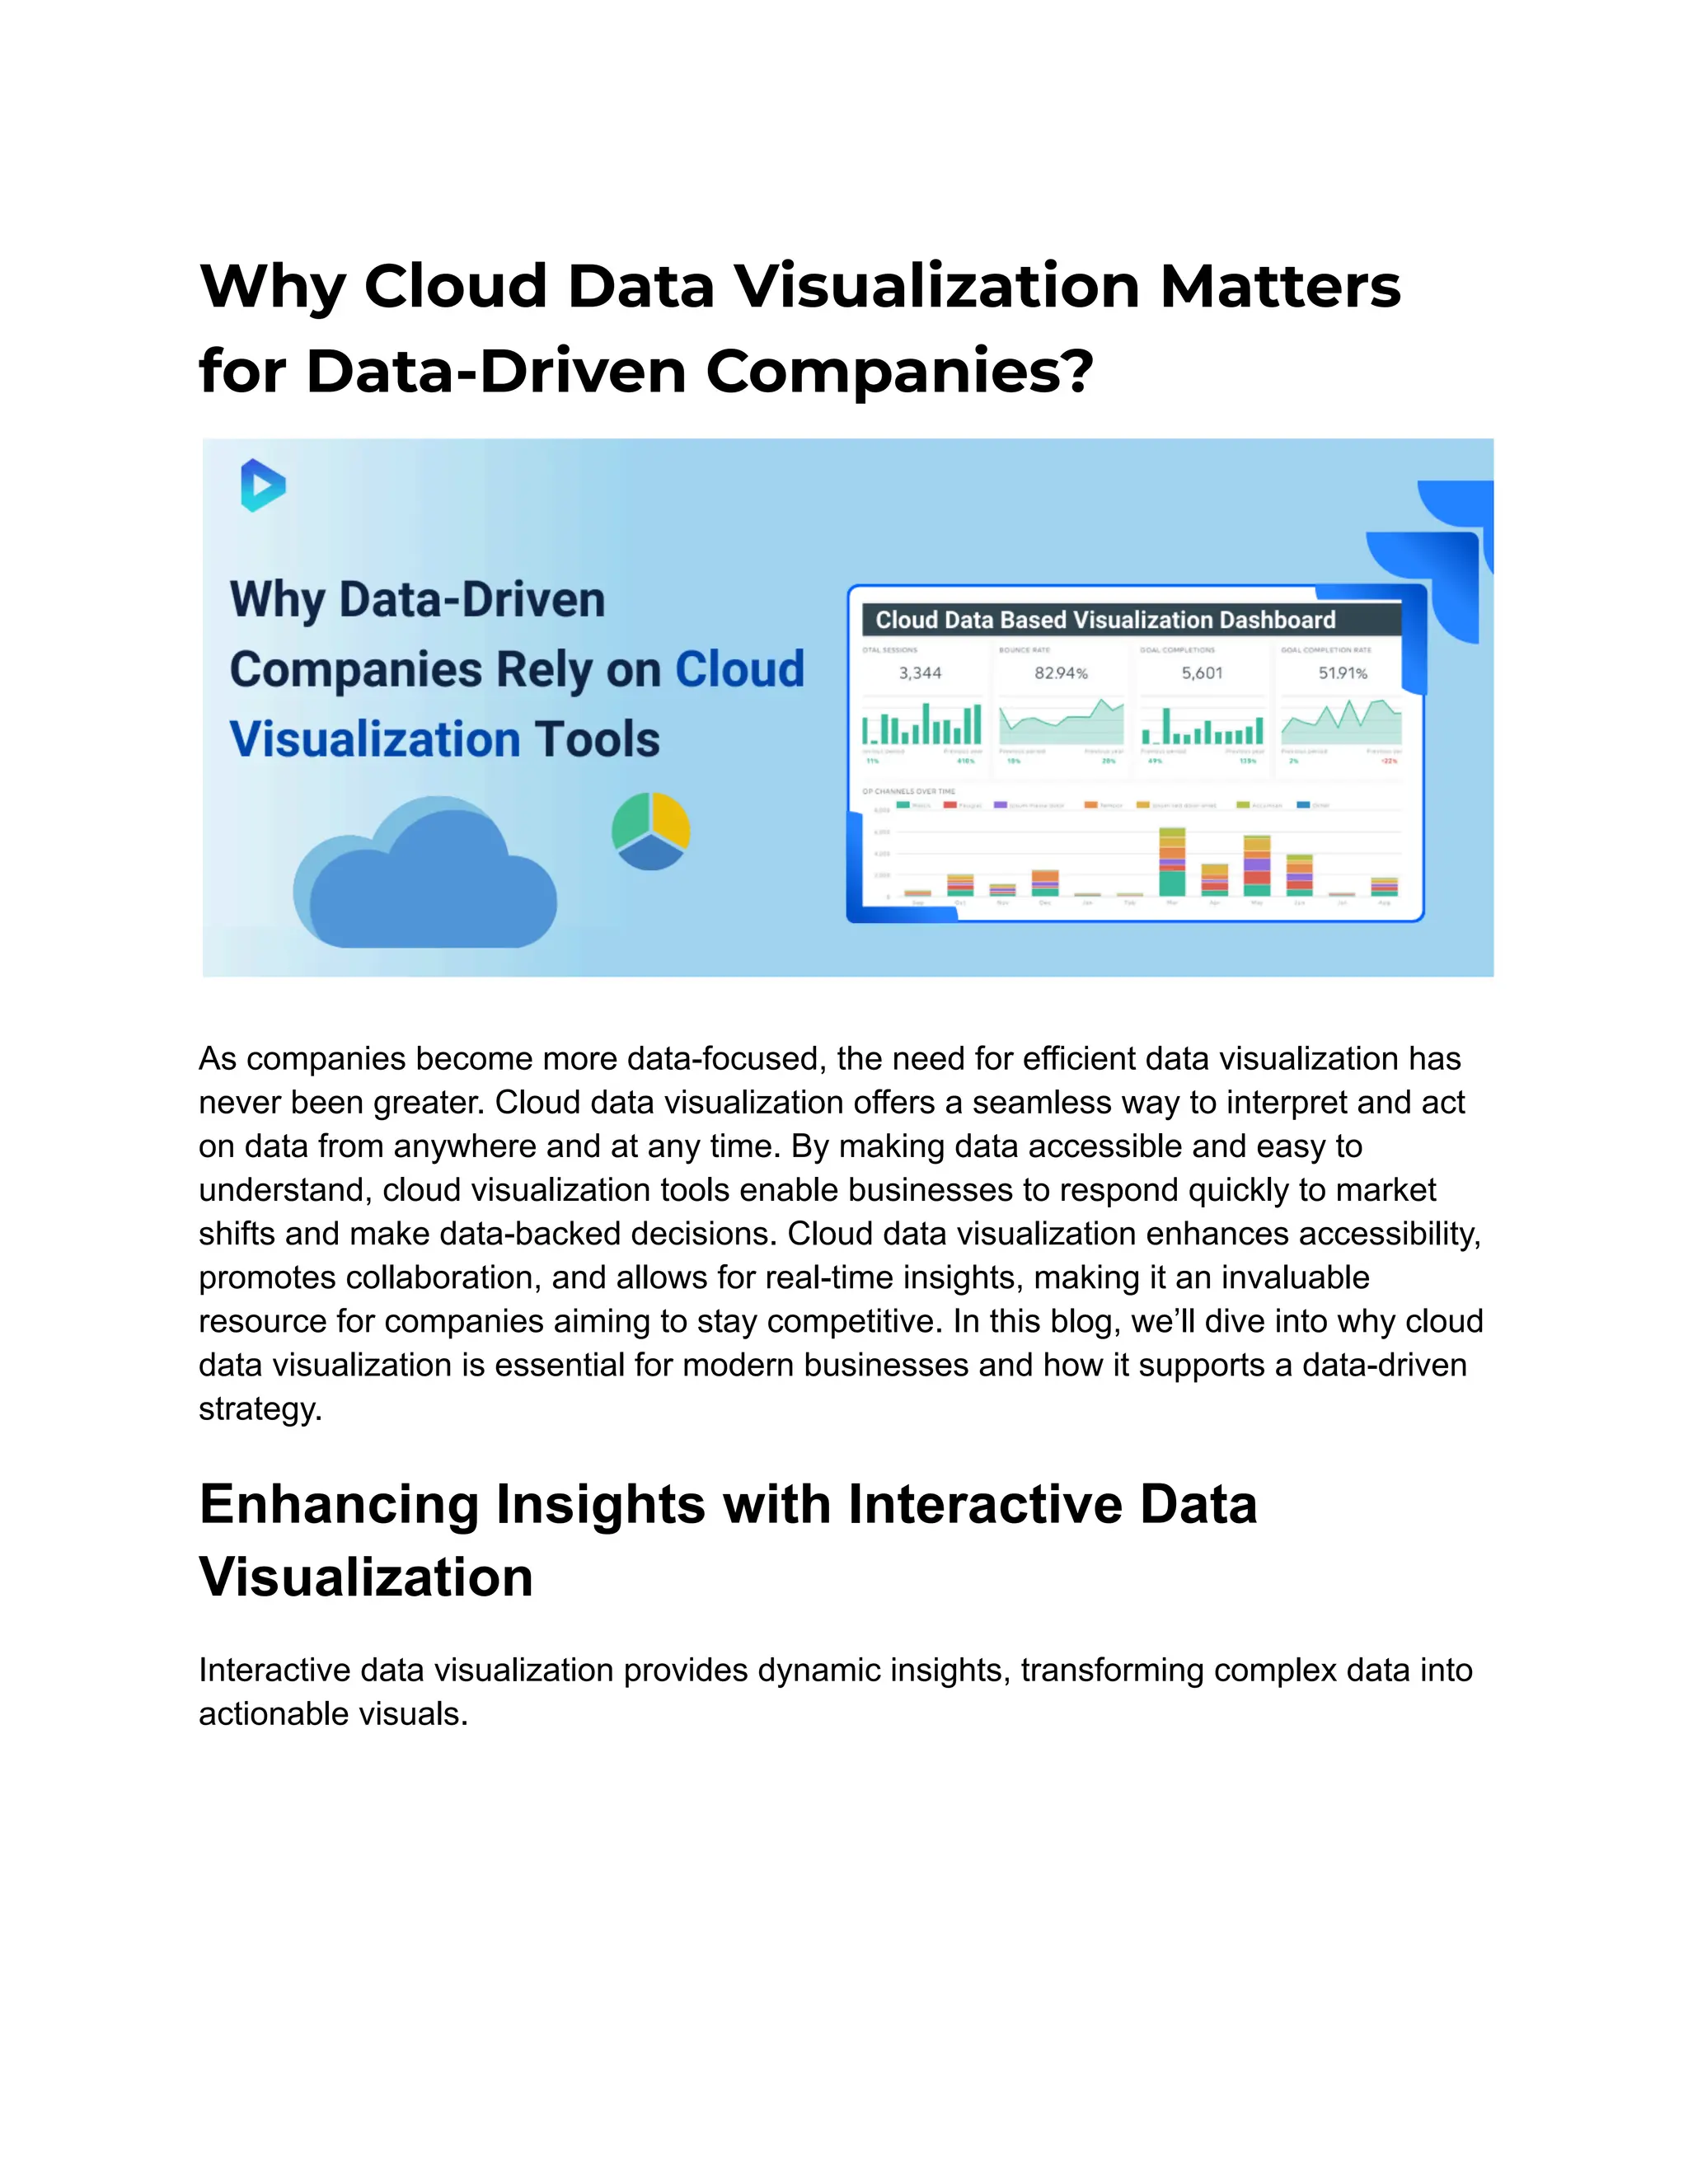


The document emphasizes the importance of cloud data visualization for data-driven companies, enabling quick data interpretation and decision-making from anywhere. It discusses the benefits of interactive data visualization, including enhanced engagement, real-time insights, and improved stakeholder collaboration. Additionally, it highlights AI-driven tools and business intelligence dashboards that facilitate effective data management, compliance, and strategic decision-making.