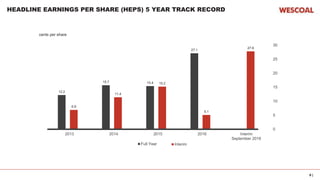
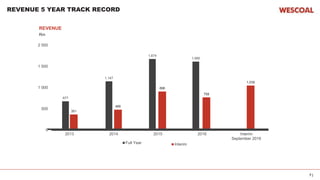
INTERIM RESULTS PRESENTATION
FOR 6 MONTHS ENDED 30 SEPTEMBER 2016
1 NOVEMBER 2016
2 |
IMPORTANT NOTICE
This document has been prepared by Wescoal Holdings Limited (the “Company”). For the purposes of this notice, the presentation that follows (the “Presentation”) shall mean and include the slides that follow,
the oral presentation of the slides by the Company, any question-and-answer session that follows that oral presentation, hard copies of this document and any materials distributed at, or in connection with, that
presentation. By attending the meeting at which the Presentation is made, or by reading the Presentation slides, you will be deemed to have (i) agreed to all of the following restrictions and made the following
undertakings and (ii) acknowledged that you understand the legal and regulatory sanctions attached to the misuse, disclosure or improper circulation of the Presentation.
The Presentation is has been furnished to you solely for your information and may not be reproduced, redistributed or disclosed in any way, in whole or in part, directly or indirectly, to any other person without
the prior written consent of the Company. Your obligations as set out in this notice will continue in respect of the information contained in the Presentation until such time as, and then only to the extent that, any
such information is made available to the public. The Company may not be making the information contained herein public, except to the extent required by law or regulation. If this is not acceptable to you, you
should not receive the information contained in the Presentation.
The information contained in the Presentation, including market information from third parties, has not been independently verified and no representation or warranty, express or implied, is made as to, and no
reliance should be placed, on the fairness, accuracy, completeness or correctness of the information or opinions expressed herein. The information and opinions contained in this Presentation do not purport to
be comprehensive, are provided as at the date of the document and are subject to change without notice. The Company is not under any obligation to update or keep current the information contained in the
Presentation. The Company, its subsidiaries, or any of their respective affiliates, directors, officers, employees, agents, JSE Sponsors, Singular Systems or any other person shall have no liability whatsoever
(in negligence or otherwise) for any loss howsoever arising from any use of the Presentation or its contents or otherwise arising in connection with the Presentation. Singular Systems is acting for the Company
in connection with the Presentation and will not be responsible to anyone other than the Company for providing the protections afforded to clients.
Statements in the Presentation, including those regarding the possible or assumed future or other performance of the Company or its industry or other trend projections, constitute forward-looking statements.
By their nature, forward-looking statements involve known and un-known risks, uncertainties, assumptions and other factors because they relate to events and depend on circumstances that will occur in the
future whether or not outside the control of the Company. Such factors may cause actual results, performance or developments to differ materially from those expressed or implied by such forward-looking
statements. Accordingly, no assurance is given that such forward-looking statements will prove to have been correct. They speak only as at the date of the Presentation and the Company undertakes no
obligation to update these forward-looking statements.
3 |
CONTENTS
1
2
3
4
Relative Performance Indicators
Management & Business Overview, Risks & Mitigation
The Road Ahead: Strategic Priorities & Timetable;
Investment Case
3
5
Financial Highlights & Performance
Operational Review & Segmental Disclosure
4 |
FINANCIAL HIGHLIGHTS AND OTHER SALIENT FEATURES
FINANCIAL HIGHLIGHTS AND PERFORMANCE
• Wescoal delivered a solid performance on the back of strong sales and operational efficiencies
from its flagship Elandspruit colliery*
• Revenue increased by 37.1% or R281.3 million to R1 039.4 million (2015: R758.1 million)
• EBITDA is up 254% to R139.3 million (2015: R39.4 million)
• HEPS increased 445% to 27.8 cents (2015: 5.1 cents)
• Special dividend of R10 million was declared during September 2016
* Elandspruit was not fully operational in the comparative 2015 period as reflected in comparison metrics.
5 |
STATEMENT OF COMPREHENSIVE INCOME
Unaudited
September 2016
R000
Unaudited
September 2015
R000 % Change
Unaudited
Six months ended
March 2016
R’000
Revenue 1 039 442 758 138 37.1▲ 831 732
Gross profit 188 004 97 300 93.2▲ 154 420
Gross profit margin 18.1% 12.8% 41.4▲ 18.6%
EBITDA 139 321 39 361 254.0▲ 112 591
Operating profit 100 973 18 551 444.3▲ 100 923
Operating profit margin 9.7% 2.4% 304.2▲ 12.1%
Interest expense (13 083) (7 287) 79.5▲ (13 632)
Taxation (25 907) (1 478) 1 652.8▲ (26 761)
Net Profit After Tax 61 983 9 786 533.4▲ 41 979
6 |
6.9
11.4
15.2
5.1
27.8
0
5
10
15
20
25
30
2013 2014 2015 2016 Interim
September 2016
Interim
12.2
15.7 15.4
27.1
0
5
10
15
20
25
30
Full Year
HEADLINE EARNINGS PER SHARE (HEPS) 5 YEAR TRACK RECORD
cents per share
7 |
351
466
898
758
1,039
2013 2014 2015 2016 Interim
September 2016
Interim
677
1,147
1,674
1,590
0
500
1 000
1 500
2 000
Full Year
REVENUE 5 YEAR TRACK RECORD
REVENUE
Rm
8 |
17
22
48
19
101
0
20
40
60
80
100
2013 2014 2015 2016 Interim
September 2016
Interim
27
45 46
101
0
20
40
60
80
100
Full Year
OPERATING PROFIT 5 YEAR TRACK RECORD
OPERATING PROFIT
Rm
9 |
STATEMENT OF FINANCIAL POSITION
NOTES:
• Increase in cash and cash
equivalents
• Invested R47.8m during the half
year on capital and development
Unaudited
September 2016
R000
Unaudited
September 2015
R000
Non-current assets 625 893 615 189
Property, plant and equipment 504 108 458 531
Investment property 709 709
Investments 14 266 17 602
Goodwill and intangible assets 92 387 100 435
Other receivables 10 238 12 837
Deferred taxation 4 185 25 075
Current assets 440 687 336 855
Inventories and work in progress 72 159 73 007
Trade and other receivables 260 553 211 126
Cash and cash equivalents 104 652 52 722
Non current assets held for sale 3 323 -
Total assets 1 066 580 952 044
10 |
STATEMENT OF FINANCIAL POSITION (CONTINUED)
• The improved profitability
translated into cash generation
which improved the balance sheet
strength.
• Group debt funding capacity
increased significantly due to
conclusion of long term Eskom and
export contracts.
Unaudited
September 2016
R000
Unaudited
September 2015
R000
Total capital and reserves (428 459) (290 419)
Non-current liabilities (166 037) (90 685)
Interest bearing debt (77 039) (36 846)
Rehabilitation provision (48 325) (46 685)
Deferred tax (40 673) (7 154)
Current liabilities (472 084) (570 940)
Trade and other payables (296 776) (271 126)
Rehabilitation provision (5 299) -
Bank overdraft (16 664) (16 391)
Taxation payable (23 762) (43 731)
Interest bearing debt (129 583) (239 692)
Total equities and liabilities (1 066 580) (952 044)
Net asset value per share (cents 190.4 158.2
Gearing % 21.7 45.3
11 |
CASH FLOW GENERATION
PERFORMANCE
• The improved profitability translated into
strong cash generation, with R98.3
million in cash generated from
operations.
• Cash was deployed to fund on-going
capital expenditure (R48.9 million),
reduce interest bearing debt (R33.0
million) and to reward shareholders with
dividend payments.
Unaudited
September 2016
R000
Unaudited
September 2015
R000
Cash generated from operations 98 330 129 092
Cash flows from investing activities (34 051) (144 969)
Cash flows from finance activities (42 227) 52 454
Net increase in cash and cash
equivalents
2 590 26 181
OPERATIONAL REVIEW AND
SEGMENTAL DISCLOSURE
13 |
46%
54%
Mining
& Other
Trading
77%
23%
SEGMENTAL CONTRIBUTIONS
(FOR THE 6 MONTHS ENDED 30 SEPTEMBER 2016)
REVENUE EBITDA
14 |
MINING DIVISION UPDATE
ELANDSPRUIT COLLIERY
• Contains 5 mineable coal seams, which extend to a maximum depth of 70m below surface,
are near horizontal in formation and devoid of geological complexities
• Seams are mined selectively to ensure optimal product recovery during beneficiation process
• Mineable reserves of ~33 million tons and a LOM 12 to 15 years
• Provides feed for the Wescoal processing plant 20 km away
• Successfully launched during 2015
PERFORMANCE
• Elandspruit colliery produced 1.3 million ROM tons during this period, compared with 0.3 million tons during the
start-up phase in 2015.
• Increased efficiencies and optimisation projects at the nearby processing plant have been completed.
• Additional plant capacity was brought on stream to increase total crushing capacity to 220 000 tons and
beneficiation capacity to 180 000 tons per month.
• The recently signed long term Eskom contract will ensure continuous sales volumes from the plant.
15 |
MINING DIVISION UPDATE | COST MANAGEMENT REMAINS A FOCUS
THE INTIBANE COLLIERY
• The Intibane Colliery was issued a water use license in December 2015
• Ramp up in site activity, increasing production to its steady state target of +75kt per month ROM
• Increased production from Intibane will help drive volume based cost dilution
KHANYISA COLLIERY
• The Khanyisa Colliery was issued a water use license during May 2016
• Agreement reached with counterparties to acquire additional contiguous resources
• Commencement of mining is subject to standard regulatory approvals from the DMR
16 |
TRADING DIVISION UPDATE
CREATES OPERATIONAL FLEXIBILITY WITH THE MINING DIVISION
• Exceeded expectations with strong performance in a difficult business
environment
• EBITDA increased 11.2% to R32.2m (2015: R28.9m)
• Divisional sales increased 8.6% to 598 000 tons (2015: 550 000)
• Gross profit margin maintained at around 11.5% with Gross Profit of
R64.2m (2015: R62.0m)
• Close working relationship with
mining division creates operational
flexibility/optionality
• We have started a process to
review the structure of the Trading
division in order to create a more
robust and streamlined business
MANAGEMENT &
BUSINESS
OVERVIEW
RISKS & MITIGATION
18 |
OPERATING STRUCTURE
WESCOAL MINING (PTY) LTD WESCOAL TRADING (PTY) LTD
HOLDINGS LIMITED
First mining activity started in 2009 First trading activity started in 2005
Mining operations:
Khanyisa Colliery, Intibane Colliery,
Elandspruit Colliery
Trading operations:
inland region, coastal region
Processing plant:
20km from Elandspruit
National presence with
logistics and depot infrastructure
Annualised production:
~3m tons of coal growing to +8m tons
per annum
Annual sales:
1 million tons
Mining division is base for future
growth and positioned to become a
significant local producer
Trading division diversifies Group
revenue stream, generates cash flow,
source of market intelligence
Waheed
Sulaiman
CEO
Bothwell
Mazarura
CFO
Vikesh
Dhanooklal
Head Legal
Bongani
Hlope
Head HR
Thivha Tshithavhane
Business Development &
Projects
Dutch Botes
CEO Mining
(+35 years experience)
Bonani Siko
Mine Manager
(+15 years experience)
Izak van der Walt
Financial Manager Ops
(+16 years experience)
Jaap Kruger
Plant Manager
(+30 years experience)
Mike Berry
CEO Trading
(+25 years experience)
19 |
MANAGEMENT & STRATEGIC PRIORITIES
• Continue to deliver solid, predictable operational and financial performance
• Complete re-alignment of trading business in line with Wescoal’s objectives
• Continue with improvement projects in order to maximise value from existing assets
• Operationalise Khanyisa
• Continue to diversify revenue streams
• Take advantage of opportunities in the export market
• Progress BEE transaction to ensure BEE shareholding surpasses 50% by end December 2016
• Grow Wescoal’ resource base
• Continue regular dividend payments
20 |
RISKS AND MITIGATIONS
Risk Response Update
1 HDSA ownership
of Wescoal
• BEE transaction to achieve HSDA control by
December 2016 advanced
• HDSA ownership currently over 40%
2 Wescoal funding • BEE transaction will inject R178m equity into the
Group
• Elandspruit operationalised
• Cost savings initiatives rolled out across the Group
• Gearing reduced to 0.26 [2015: 0.48]
• Cash flow position continues to strengthen
• Group debt funding capacity increased significantly due
to conclusion of long term Eskom and export contracts
3 Narrow revenue
base
• Secure long term Eskom coal supply contracts
• Broaden customer base and revenue generation
activities
• Long term coal supply contract signed with Eskom
• Significant progress in reaching target of 1Mtpa exports
in medium term
• Progress in developing initiatives to grow revenues
linked to non-Eskom domestic coal customers, coal
distribution networks, treatment of coal discard material
4 Declining
resource
• Grow the Wescoal resource base beyond the current
~15 year horizon
• Potential resources targets have been identified and
work has commenced on securing prioritised targets
21 |
THE ROAD AHEAD
STRATEGIC PRIORITIES & TIMETABLE
INVESTMENT CASE
22 |
LOOKING AHEAD
• Wescoal is transforming into a majority-black-owned business supplying Eskom and others cost effectively
• The challenging environment presents opportunities for corporate activity
› Consolidation in the coal sector is likely and Wescoal sees itself as an active participant therein
› Trading division is being right-sized to further reduce costs and maximise shareholder value
• Wescoal’s resource base will be expanded significantly to support objective of 8Mtpa ROM production
• Wescoal resource mix will be adjusted to support objective of 1Mtpa exports
• Wescoal is steadfast in its strategic development plan with Elandspruit Colliery at the forefront
23 |
TIMETABLE
GOING FORWARD
• Annual General Meeting: AGM 9 November 2016
• Proposed BEE transaction: EGM 23 November 2016
24 |
WESCOAL EMPOWERMENT TRANSACTION
SALIENT DATES AND TIMES
• Record Date Friday,14 October 2016
• Circular distribution Tuesday, 25 October 2016
• Last day to trade Tuesday,15 November 2016
• Record date for voting at GM Friday, 18 November 2016
• Last day to lodge forms of proxy Tuesday,22 November 2016
• General Meeting Wednesday,23 November 2016
• Results of the GM SENS Wednesday,23 November 2016
• Results of the GM press Thursday,24 November 2016
• Announcement of TRP ruling Tuesday,29 November 2016
• Final date for requesting TSC review of TRP ruling Tuesday,6 December 2016
• Expected closure date of suspensive conditions Tuesday,6 December 2016
• Expected date for listing of subscription shares Friday,9 December 2016
25 |
INVESTMENT CASE
• Long term revenues secured through Eskom contracts coupled with significant future upside
• Targeted revenue diversification generation initiatives such as non-Eskom domestic sales, coal exports, re-
treatment of coal fines discard material, presence in the domestic and export coal distribution networks
• HDSA ownership initiatives well advanced and on track to reach objectives in 2016
• Strong focus on cost and cash management
• Actively pursuing organic and inorganic growth opportunities: Wescoal a consolidating agent in junior coal sector
• Leadership team focused on sustainable operational delivery as an enabler for expansion
• Conduct responsible business impacting positively on all stakeholders and increases long term shareholder value
• Seasoned knowledge in the coal sector in South Africa
RELATIVE PERFORMANCE
27 |
WSL VS MINING INDEX | RELATIVE PERFORMANCE
28 |
WSL VS DOMESTIC JUNIOR COAL PEERS
* Peers have been normalised
29 |
COAL, SOUTH AFRICAN EXPORT PRICE | ZAR & USD

WESCOAL INTERIM RESULTS PRESENTATION

  • 1.
    INTERIM RESULTS PRESENTATION FOR6 MONTHS ENDED 30 SEPTEMBER 2016 1 NOVEMBER 2016
  • 2.
    2 | IMPORTANT NOTICE Thisdocument has been prepared by Wescoal Holdings Limited (the “Company”). For the purposes of this notice, the presentation that follows (the “Presentation”) shall mean and include the slides that follow, the oral presentation of the slides by the Company, any question-and-answer session that follows that oral presentation, hard copies of this document and any materials distributed at, or in connection with, that presentation. By attending the meeting at which the Presentation is made, or by reading the Presentation slides, you will be deemed to have (i) agreed to all of the following restrictions and made the following undertakings and (ii) acknowledged that you understand the legal and regulatory sanctions attached to the misuse, disclosure or improper circulation of the Presentation. The Presentation is has been furnished to you solely for your information and may not be reproduced, redistributed or disclosed in any way, in whole or in part, directly or indirectly, to any other person without the prior written consent of the Company. Your obligations as set out in this notice will continue in respect of the information contained in the Presentation until such time as, and then only to the extent that, any such information is made available to the public. The Company may not be making the information contained herein public, except to the extent required by law or regulation. If this is not acceptable to you, you should not receive the information contained in the Presentation. The information contained in the Presentation, including market information from third parties, has not been independently verified and no representation or warranty, express or implied, is made as to, and no reliance should be placed, on the fairness, accuracy, completeness or correctness of the information or opinions expressed herein. The information and opinions contained in this Presentation do not purport to be comprehensive, are provided as at the date of the document and are subject to change without notice. The Company is not under any obligation to update or keep current the information contained in the Presentation. The Company, its subsidiaries, or any of their respective affiliates, directors, officers, employees, agents, JSE Sponsors, Singular Systems or any other person shall have no liability whatsoever (in negligence or otherwise) for any loss howsoever arising from any use of the Presentation or its contents or otherwise arising in connection with the Presentation. Singular Systems is acting for the Company in connection with the Presentation and will not be responsible to anyone other than the Company for providing the protections afforded to clients. Statements in the Presentation, including those regarding the possible or assumed future or other performance of the Company or its industry or other trend projections, constitute forward-looking statements. By their nature, forward-looking statements involve known and un-known risks, uncertainties, assumptions and other factors because they relate to events and depend on circumstances that will occur in the future whether or not outside the control of the Company. Such factors may cause actual results, performance or developments to differ materially from those expressed or implied by such forward-looking statements. Accordingly, no assurance is given that such forward-looking statements will prove to have been correct. They speak only as at the date of the Presentation and the Company undertakes no obligation to update these forward-looking statements.
  • 3.
    3 | CONTENTS 1 2 3 4 Relative PerformanceIndicators Management & Business Overview, Risks & Mitigation The Road Ahead: Strategic Priorities & Timetable; Investment Case 3 5 Financial Highlights & Performance Operational Review & Segmental Disclosure
  • 4.
    4 | FINANCIAL HIGHLIGHTSAND OTHER SALIENT FEATURES FINANCIAL HIGHLIGHTS AND PERFORMANCE • Wescoal delivered a solid performance on the back of strong sales and operational efficiencies from its flagship Elandspruit colliery* • Revenue increased by 37.1% or R281.3 million to R1 039.4 million (2015: R758.1 million) • EBITDA is up 254% to R139.3 million (2015: R39.4 million) • HEPS increased 445% to 27.8 cents (2015: 5.1 cents) • Special dividend of R10 million was declared during September 2016 * Elandspruit was not fully operational in the comparative 2015 period as reflected in comparison metrics.
  • 5.
    5 | STATEMENT OFCOMPREHENSIVE INCOME Unaudited September 2016 R000 Unaudited September 2015 R000 % Change Unaudited Six months ended March 2016 R’000 Revenue 1 039 442 758 138 37.1▲ 831 732 Gross profit 188 004 97 300 93.2▲ 154 420 Gross profit margin 18.1% 12.8% 41.4▲ 18.6% EBITDA 139 321 39 361 254.0▲ 112 591 Operating profit 100 973 18 551 444.3▲ 100 923 Operating profit margin 9.7% 2.4% 304.2▲ 12.1% Interest expense (13 083) (7 287) 79.5▲ (13 632) Taxation (25 907) (1 478) 1 652.8▲ (26 761) Net Profit After Tax 61 983 9 786 533.4▲ 41 979
  • 6.
    6 | 6.9 11.4 15.2 5.1 27.8 0 5 10 15 20 25 30 2013 20142015 2016 Interim September 2016 Interim 12.2 15.7 15.4 27.1 0 5 10 15 20 25 30 Full Year HEADLINE EARNINGS PER SHARE (HEPS) 5 YEAR TRACK RECORD cents per share
  • 7.
    7 | 351 466 898 758 1,039 2013 20142015 2016 Interim September 2016 Interim 677 1,147 1,674 1,590 0 500 1 000 1 500 2 000 Full Year REVENUE 5 YEAR TRACK RECORD REVENUE Rm
  • 8.
    8 | 17 22 48 19 101 0 20 40 60 80 100 2013 20142015 2016 Interim September 2016 Interim 27 45 46 101 0 20 40 60 80 100 Full Year OPERATING PROFIT 5 YEAR TRACK RECORD OPERATING PROFIT Rm
  • 9.
    9 | STATEMENT OFFINANCIAL POSITION NOTES: • Increase in cash and cash equivalents • Invested R47.8m during the half year on capital and development Unaudited September 2016 R000 Unaudited September 2015 R000 Non-current assets 625 893 615 189 Property, plant and equipment 504 108 458 531 Investment property 709 709 Investments 14 266 17 602 Goodwill and intangible assets 92 387 100 435 Other receivables 10 238 12 837 Deferred taxation 4 185 25 075 Current assets 440 687 336 855 Inventories and work in progress 72 159 73 007 Trade and other receivables 260 553 211 126 Cash and cash equivalents 104 652 52 722 Non current assets held for sale 3 323 - Total assets 1 066 580 952 044
  • 10.
    10 | STATEMENT OFFINANCIAL POSITION (CONTINUED) • The improved profitability translated into cash generation which improved the balance sheet strength. • Group debt funding capacity increased significantly due to conclusion of long term Eskom and export contracts. Unaudited September 2016 R000 Unaudited September 2015 R000 Total capital and reserves (428 459) (290 419) Non-current liabilities (166 037) (90 685) Interest bearing debt (77 039) (36 846) Rehabilitation provision (48 325) (46 685) Deferred tax (40 673) (7 154) Current liabilities (472 084) (570 940) Trade and other payables (296 776) (271 126) Rehabilitation provision (5 299) - Bank overdraft (16 664) (16 391) Taxation payable (23 762) (43 731) Interest bearing debt (129 583) (239 692) Total equities and liabilities (1 066 580) (952 044) Net asset value per share (cents 190.4 158.2 Gearing % 21.7 45.3
  • 11.
    11 | CASH FLOWGENERATION PERFORMANCE • The improved profitability translated into strong cash generation, with R98.3 million in cash generated from operations. • Cash was deployed to fund on-going capital expenditure (R48.9 million), reduce interest bearing debt (R33.0 million) and to reward shareholders with dividend payments. Unaudited September 2016 R000 Unaudited September 2015 R000 Cash generated from operations 98 330 129 092 Cash flows from investing activities (34 051) (144 969) Cash flows from finance activities (42 227) 52 454 Net increase in cash and cash equivalents 2 590 26 181
  • 12.
  • 13.
    13 | 46% 54% Mining & Other Trading 77% 23% SEGMENTALCONTRIBUTIONS (FOR THE 6 MONTHS ENDED 30 SEPTEMBER 2016) REVENUE EBITDA
  • 14.
    14 | MINING DIVISIONUPDATE ELANDSPRUIT COLLIERY • Contains 5 mineable coal seams, which extend to a maximum depth of 70m below surface, are near horizontal in formation and devoid of geological complexities • Seams are mined selectively to ensure optimal product recovery during beneficiation process • Mineable reserves of ~33 million tons and a LOM 12 to 15 years • Provides feed for the Wescoal processing plant 20 km away • Successfully launched during 2015 PERFORMANCE • Elandspruit colliery produced 1.3 million ROM tons during this period, compared with 0.3 million tons during the start-up phase in 2015. • Increased efficiencies and optimisation projects at the nearby processing plant have been completed. • Additional plant capacity was brought on stream to increase total crushing capacity to 220 000 tons and beneficiation capacity to 180 000 tons per month. • The recently signed long term Eskom contract will ensure continuous sales volumes from the plant.
  • 15.
    15 | MINING DIVISIONUPDATE | COST MANAGEMENT REMAINS A FOCUS THE INTIBANE COLLIERY • The Intibane Colliery was issued a water use license in December 2015 • Ramp up in site activity, increasing production to its steady state target of +75kt per month ROM • Increased production from Intibane will help drive volume based cost dilution KHANYISA COLLIERY • The Khanyisa Colliery was issued a water use license during May 2016 • Agreement reached with counterparties to acquire additional contiguous resources • Commencement of mining is subject to standard regulatory approvals from the DMR
  • 16.
    16 | TRADING DIVISIONUPDATE CREATES OPERATIONAL FLEXIBILITY WITH THE MINING DIVISION • Exceeded expectations with strong performance in a difficult business environment • EBITDA increased 11.2% to R32.2m (2015: R28.9m) • Divisional sales increased 8.6% to 598 000 tons (2015: 550 000) • Gross profit margin maintained at around 11.5% with Gross Profit of R64.2m (2015: R62.0m) • Close working relationship with mining division creates operational flexibility/optionality • We have started a process to review the structure of the Trading division in order to create a more robust and streamlined business
  • 17.
  • 18.
    18 | OPERATING STRUCTURE WESCOALMINING (PTY) LTD WESCOAL TRADING (PTY) LTD HOLDINGS LIMITED First mining activity started in 2009 First trading activity started in 2005 Mining operations: Khanyisa Colliery, Intibane Colliery, Elandspruit Colliery Trading operations: inland region, coastal region Processing plant: 20km from Elandspruit National presence with logistics and depot infrastructure Annualised production: ~3m tons of coal growing to +8m tons per annum Annual sales: 1 million tons Mining division is base for future growth and positioned to become a significant local producer Trading division diversifies Group revenue stream, generates cash flow, source of market intelligence Waheed Sulaiman CEO Bothwell Mazarura CFO Vikesh Dhanooklal Head Legal Bongani Hlope Head HR Thivha Tshithavhane Business Development & Projects Dutch Botes CEO Mining (+35 years experience) Bonani Siko Mine Manager (+15 years experience) Izak van der Walt Financial Manager Ops (+16 years experience) Jaap Kruger Plant Manager (+30 years experience) Mike Berry CEO Trading (+25 years experience)
  • 19.
    19 | MANAGEMENT &STRATEGIC PRIORITIES • Continue to deliver solid, predictable operational and financial performance • Complete re-alignment of trading business in line with Wescoal’s objectives • Continue with improvement projects in order to maximise value from existing assets • Operationalise Khanyisa • Continue to diversify revenue streams • Take advantage of opportunities in the export market • Progress BEE transaction to ensure BEE shareholding surpasses 50% by end December 2016 • Grow Wescoal’ resource base • Continue regular dividend payments
  • 20.
    20 | RISKS ANDMITIGATIONS Risk Response Update 1 HDSA ownership of Wescoal • BEE transaction to achieve HSDA control by December 2016 advanced • HDSA ownership currently over 40% 2 Wescoal funding • BEE transaction will inject R178m equity into the Group • Elandspruit operationalised • Cost savings initiatives rolled out across the Group • Gearing reduced to 0.26 [2015: 0.48] • Cash flow position continues to strengthen • Group debt funding capacity increased significantly due to conclusion of long term Eskom and export contracts 3 Narrow revenue base • Secure long term Eskom coal supply contracts • Broaden customer base and revenue generation activities • Long term coal supply contract signed with Eskom • Significant progress in reaching target of 1Mtpa exports in medium term • Progress in developing initiatives to grow revenues linked to non-Eskom domestic coal customers, coal distribution networks, treatment of coal discard material 4 Declining resource • Grow the Wescoal resource base beyond the current ~15 year horizon • Potential resources targets have been identified and work has commenced on securing prioritised targets
  • 21.
    21 | THE ROADAHEAD STRATEGIC PRIORITIES & TIMETABLE INVESTMENT CASE
  • 22.
    22 | LOOKING AHEAD •Wescoal is transforming into a majority-black-owned business supplying Eskom and others cost effectively • The challenging environment presents opportunities for corporate activity › Consolidation in the coal sector is likely and Wescoal sees itself as an active participant therein › Trading division is being right-sized to further reduce costs and maximise shareholder value • Wescoal’s resource base will be expanded significantly to support objective of 8Mtpa ROM production • Wescoal resource mix will be adjusted to support objective of 1Mtpa exports • Wescoal is steadfast in its strategic development plan with Elandspruit Colliery at the forefront
  • 23.
    23 | TIMETABLE GOING FORWARD •Annual General Meeting: AGM 9 November 2016 • Proposed BEE transaction: EGM 23 November 2016
  • 24.
    24 | WESCOAL EMPOWERMENTTRANSACTION SALIENT DATES AND TIMES • Record Date Friday,14 October 2016 • Circular distribution Tuesday, 25 October 2016 • Last day to trade Tuesday,15 November 2016 • Record date for voting at GM Friday, 18 November 2016 • Last day to lodge forms of proxy Tuesday,22 November 2016 • General Meeting Wednesday,23 November 2016 • Results of the GM SENS Wednesday,23 November 2016 • Results of the GM press Thursday,24 November 2016 • Announcement of TRP ruling Tuesday,29 November 2016 • Final date for requesting TSC review of TRP ruling Tuesday,6 December 2016 • Expected closure date of suspensive conditions Tuesday,6 December 2016 • Expected date for listing of subscription shares Friday,9 December 2016
  • 25.
    25 | INVESTMENT CASE •Long term revenues secured through Eskom contracts coupled with significant future upside • Targeted revenue diversification generation initiatives such as non-Eskom domestic sales, coal exports, re- treatment of coal fines discard material, presence in the domestic and export coal distribution networks • HDSA ownership initiatives well advanced and on track to reach objectives in 2016 • Strong focus on cost and cash management • Actively pursuing organic and inorganic growth opportunities: Wescoal a consolidating agent in junior coal sector • Leadership team focused on sustainable operational delivery as an enabler for expansion • Conduct responsible business impacting positively on all stakeholders and increases long term shareholder value • Seasoned knowledge in the coal sector in South Africa
  • 26.
  • 27.
    27 | WSL VSMINING INDEX | RELATIVE PERFORMANCE
  • 28.
    28 | WSL VSDOMESTIC JUNIOR COAL PEERS * Peers have been normalised
  • 29.
    29 | COAL, SOUTHAFRICAN EXPORT PRICE | ZAR & USD

Editor's Notes

  • #7 Operating profit increased by 112% to R96.392 million [FY15 R45.54m] Improved margin of Mining business by 5.5% [to 32.8%] Reduced operating cost by 12% (R22m) Bad debt (R5m) Motor vehicles (R7m) Staff cost (R9m + R8m saving on retrenchment cost of FY15) Reductions partly offset by increases in cost of: Security (R3m) Professional fees (R2m)
  • #8 Operating profit increased by 112% to R96.392 million [FY15 R45.54m] Improved margin of Mining business by 5.5% [to 32.8%] Reduced operating cost by 12% (R22m) Bad debt (R5m) Motor vehicles (R7m) Staff cost (R9m + R8m saving on retrenchment cost of FY15) Reductions partly offset by increases in cost of: Security (R3m) Professional fees (R2m)
  • #9 Operating profit increased by 112% to R96.392 million [FY15 R45.54m] Improved margin of Mining business by 5.5% [to 32.8%] Reduced operating cost by 12% (R22m) Bad debt (R5m) Motor vehicles (R7m) Staff cost (R9m + R8m saving on retrenchment cost of FY15) Reductions partly offset by increases in cost of: Security (R3m) Professional fees (R2m)