Download free for 30 days
Sign in
Upload
Language (EN)
Support
Business
Mobile
Social Media
Marketing
Technology
Art & Photos
Career
Design
Education
Presentations & Public Speaking
Government & Nonprofit
Healthcare
Internet
Law
Leadership & Management
Automotive
Engineering
Software
Recruiting & HR
Retail
Sales
Services
Science
Small Business & Entrepreneurship
Food
Environment
Economy & Finance
Data & Analytics
Investor Relations
Sports
Spiritual
News & Politics
Travel
Self Improvement
Real Estate
Entertainment & Humor
Health & Medicine
Devices & Hardware
Lifestyle
Change Language
Language
English
Español
Português
Français
Deutsche
Cancel
Save
EN
Uploaded by
neuroassociates
913 views
[Week14] D3.js_Scale and Axis (보충자료)
꿈꾸는데이터디자이너 'D3.js' 강의 자료 입니다 www.attrs.co.kr www.facebook.com/datadesigner2015
Data & Analytics
◦
Related topics:
Data Visualization Techniques
•
Read more
4
Save
Share
Embed
Embed presentation
1
/ 12
2
/ 12
3
/ 12
4
/ 12
5
/ 12
6
/ 12
7
/ 12
8
/ 12
9
/ 12
10
/ 12
11
/ 12
12
/ 12
More Related Content
PDF
[week6]R_Wrangling
by
neuroassociates
PDF
[Week14] D3.js_Scale and Axis
by
neuroassociates
PDF
[Week8]R_ggplot2
by
neuroassociates
PDF
[Week15] D3.js_Scatter_Chart
by
neuroassociates
PDF
[시즌2, week3] R Basic
by
neuroassociates
PDF
[Week12] D3.js_Basic2
by
neuroassociates
PDF
[week16] D3.js (Scale & axis)
by
neuroassociates
PDF
[week17] D3.js_Tooltip
by
neuroassociates
[week6]R_Wrangling
by
neuroassociates
[Week14] D3.js_Scale and Axis
by
neuroassociates
[Week8]R_ggplot2
by
neuroassociates
[Week15] D3.js_Scatter_Chart
by
neuroassociates
[시즌2, week3] R Basic
by
neuroassociates
[Week12] D3.js_Basic2
by
neuroassociates
[week16] D3.js (Scale & axis)
by
neuroassociates
[week17] D3.js_Tooltip
by
neuroassociates
What's hot
PDF
[week11] R_ggmap, leaflet
by
neuroassociates
PDF
[Week13] D3.js_Bar Chart
by
neuroassociates
PDF
[week16] D3.js_Transition
by
neuroassociates
PDF
[week12] D3.js_Basic
by
neuroassociates
PPTX
R intro
by
주영 송
PDF
꿈데디 D3.js강의 2주차
by
Songyi Lim
PDF
R_datamining
by
주영 송
PDF
꿈데디 D3.js강의 6주차
by
Songyi Lim
PDF
R 스터디 네번째
by
Jaeseok Park
PPTX
문디 14주차 발제 scatter plot
by
Min Jeong Cho
PDF
R 스터디 두번째
by
Jaeseok Park
PPT
practice2
by
yosm
PDF
[week14] Getting started with D3.js
by
neuroassociates
PDF
R 스터디 세번째
by
Jaeseok Park
PDF
이산수학 C1 프로젝트 4
by
pkok15
PDF
이산수학04
by
JeongJunYong
PDF
Python
by
SKKU Library
PDF
Power bi
by
SKKU Library
PDF
Drawing with data
by
Min Jeong Cho
PDF
R 기초 : R Basics
by
Yoonwhan Lee
[week11] R_ggmap, leaflet
by
neuroassociates
[Week13] D3.js_Bar Chart
by
neuroassociates
[week16] D3.js_Transition
by
neuroassociates
[week12] D3.js_Basic
by
neuroassociates
R intro
by
주영 송
꿈데디 D3.js강의 2주차
by
Songyi Lim
R_datamining
by
주영 송
꿈데디 D3.js강의 6주차
by
Songyi Lim
R 스터디 네번째
by
Jaeseok Park
문디 14주차 발제 scatter plot
by
Min Jeong Cho
R 스터디 두번째
by
Jaeseok Park
practice2
by
yosm
[week14] Getting started with D3.js
by
neuroassociates
R 스터디 세번째
by
Jaeseok Park
이산수학 C1 프로젝트 4
by
pkok15
이산수학04
by
JeongJunYong
Python
by
SKKU Library
Power bi
by
SKKU Library
Drawing with data
by
Min Jeong Cho
R 기초 : R Basics
by
Yoonwhan Lee
Viewers also liked
PDF
[Week20] D3.js_Mapping
by
neuroassociates
PDF
D3.js workshop
by
Anton Katunin
PDF
디포커스 전홍구
by
Newsjelly
PPTX
[ 하코사세미나] 의외로 쉬운 D3 그래프 퍼블리싱
by
정석 양
PDF
빅데이터 분석 시각화 분석 : 3장 시각화 방법
by
Ji Lee
PDF
[문디 10주차] d3.js 상호작용
by
YooDuck Hwang
PPTX
블로터아카데미_타블로퍼블릭이란(뉴스젤리)
by
Bloter&Media
PDF
꿈꾸는 데이터 디자이너 시즌2 교육설명회
by
neuroassociates
PDF
Social Innovation Spark
by
Spark
PPTX
Bootstrap docs pack 설치설명서
by
Gitaek kwon
PPTX
Bootstrap starter pack on kimsQ 설치설명서
by
Gitaek kwon
PDF
엔터프라이즈 웹애플리케이션 솔루션 Sencha ExtJS 5
by
Manyoung Cho
PDF
SK플래닛 M&C부문 D-spark #1 Intro & New Digital
by
D:rink
PDF
5. spc control charts
by
Hakeem-Ur- Rehman
PDF
[북리뷰] 데이터포인트 4장
by
Newsjelly
PDF
Raphael.js로 SVG 차트 만들기
by
Ohgyun Ahn
PDF
데이터분석과 저널리즘 5장(뒷부분)
by
Yerim An
PDF
[HeXathon] 발표자료 - 세모알
by
NAVER D2
PDF
Spark_Overview_qna
by
현철 박
[Week20] D3.js_Mapping
by
neuroassociates
D3.js workshop
by
Anton Katunin
디포커스 전홍구
by
Newsjelly
[ 하코사세미나] 의외로 쉬운 D3 그래프 퍼블리싱
by
정석 양
빅데이터 분석 시각화 분석 : 3장 시각화 방법
by
Ji Lee
[문디 10주차] d3.js 상호작용
by
YooDuck Hwang
블로터아카데미_타블로퍼블릭이란(뉴스젤리)
by
Bloter&Media
꿈꾸는 데이터 디자이너 시즌2 교육설명회
by
neuroassociates
Social Innovation Spark
by
Spark
Bootstrap docs pack 설치설명서
by
Gitaek kwon
Bootstrap starter pack on kimsQ 설치설명서
by
Gitaek kwon
엔터프라이즈 웹애플리케이션 솔루션 Sencha ExtJS 5
by
Manyoung Cho
SK플래닛 M&C부문 D-spark #1 Intro & New Digital
by
D:rink
5. spc control charts
by
Hakeem-Ur- Rehman
[북리뷰] 데이터포인트 4장
by
Newsjelly
Raphael.js로 SVG 차트 만들기
by
Ohgyun Ahn
데이터분석과 저널리즘 5장(뒷부분)
by
Yerim An
[HeXathon] 발표자료 - 세모알
by
NAVER D2
Spark_Overview_qna
by
현철 박
More from neuroassociates
PDF
Bloter 넥스트 저널리즘 스쿨 강의자료
by
neuroassociates
PDF
[week8] 데이터읽어주는남자
by
neuroassociates
PDF
[week7] 데이터읽어주는남자
by
neuroassociates
PDF
[week6] 데이터읽어주는남자
by
neuroassociates
PDF
[week9]R_statics
by
neuroassociates
PDF
[week7]R_Wrangling(2)
by
neuroassociates
PDF
[Week5]데이터읽어주는남자
by
neuroassociates
PDF
[Week5]R_scraping
by
neuroassociates
PDF
[Week4]데이터읽어주는남자
by
neuroassociates
PDF
[Week4] Google refine
by
neuroassociates
PDF
[Week3]데이터읽어주는남자
by
neuroassociates
PDF
[Week2]데이터읽어주는남자
by
neuroassociates
PDF
꿈꾸는 데이터 디자이너 시즌2 교육 설명회 2부
by
neuroassociates
PDF
꿈꾸는 데이터 디자이너 1기를 끝내며
by
neuroassociates
PDF
[Week10] R graphics
by
neuroassociates
Bloter 넥스트 저널리즘 스쿨 강의자료
by
neuroassociates
[week8] 데이터읽어주는남자
by
neuroassociates
[week7] 데이터읽어주는남자
by
neuroassociates
[week6] 데이터읽어주는남자
by
neuroassociates
[week9]R_statics
by
neuroassociates
[week7]R_Wrangling(2)
by
neuroassociates
[Week5]데이터읽어주는남자
by
neuroassociates
[Week5]R_scraping
by
neuroassociates
[Week4]데이터읽어주는남자
by
neuroassociates
[Week4] Google refine
by
neuroassociates
[Week3]데이터읽어주는남자
by
neuroassociates
[Week2]데이터읽어주는남자
by
neuroassociates
꿈꾸는 데이터 디자이너 시즌2 교육 설명회 2부
by
neuroassociates
꿈꾸는 데이터 디자이너 1기를 끝내며
by
neuroassociates
[Week10] R graphics
by
neuroassociates
[Week14] D3.js_Scale and Axis (보충자료)
1.
Data Designer D3.js 04: D3.js
척도와 축 (Scale & Axis)_보충자료
2.
꿈꾸는데이터디자이너 시즌2d3.js 척도
(d3.scale) d3.scale.linear( ) .domain[시작점, 끝점] .range[시작점, 끝점] d3.scale.ordinal( ) .domain[시작점, 끝점] .rangeBands[시작점, 끝점] 선형척도(scale.linear)와서열척도(scale.ordinal)비교하기
3.
꿈꾸는데이터디자이너 시즌2d3.js 척도
(d3.scale) d.area xScale d.area xScale var xScale = d3.scale.ordinal() .domain(data.map(function(d) { return d.area; })) .rangeBands([0, width], .3); .attr("x", function(d) { return xScale(d.area); }) 1. 코드앞에서변수‘xScale’에척도함수를저장했습니다. 2. x좌표에는칼럼명‘area’데이터가들어갑니다. 3. x좌표에척도를적용해데이터가크기에비례해배치되도록설정합니다. 4. x좌표에척도를적용하기위해xScale이라는변수명을쓰고,데이터값인d.area를써줍니다. 5. 이렇게하면데이터값에척도함수가적용됩니다. = 2.척도가적용된데이터값이 막대그래프의x좌표에삽입됩니다 1.척도가적용되지않은데이터값(d.area)에 척도가적용됩니다. (x,y)
4.
꿈꾸는데이터디자이너 시즌2d3.js 척도
(d3.scale) d.value xScale d.value yScale var yScale = d3.scale.linear() .domain([0, d3.max(data, function(d) { return d.value; })]) .range([height, 0]); .attr("y", function(d) { return yScale(d.value); }) 1. 코드앞에서변수‘yScale’에척도함수를저장했습니다. 2. y좌표에는칼럼명‘value’데이터가들어갑니다. 3. y좌표에척도를적용해데이터가크기에비례해배치되도록설정합니다. 4. y좌표에척도를적용하기위해yScale이라는변수명을쓰고,데이터값인d.value를써줍니다. 5. 이렇게하면데이터값에척도함수가적용됩니다. = (x,y) 2.척도가적용된데이터값이 막대그래프의y좌표에삽입됩니다 1.척도가적용되지않은데이터값(d.value)에 척도가적용됩니다.
5.
꿈꾸는데이터디자이너 시즌2d3.js 척도
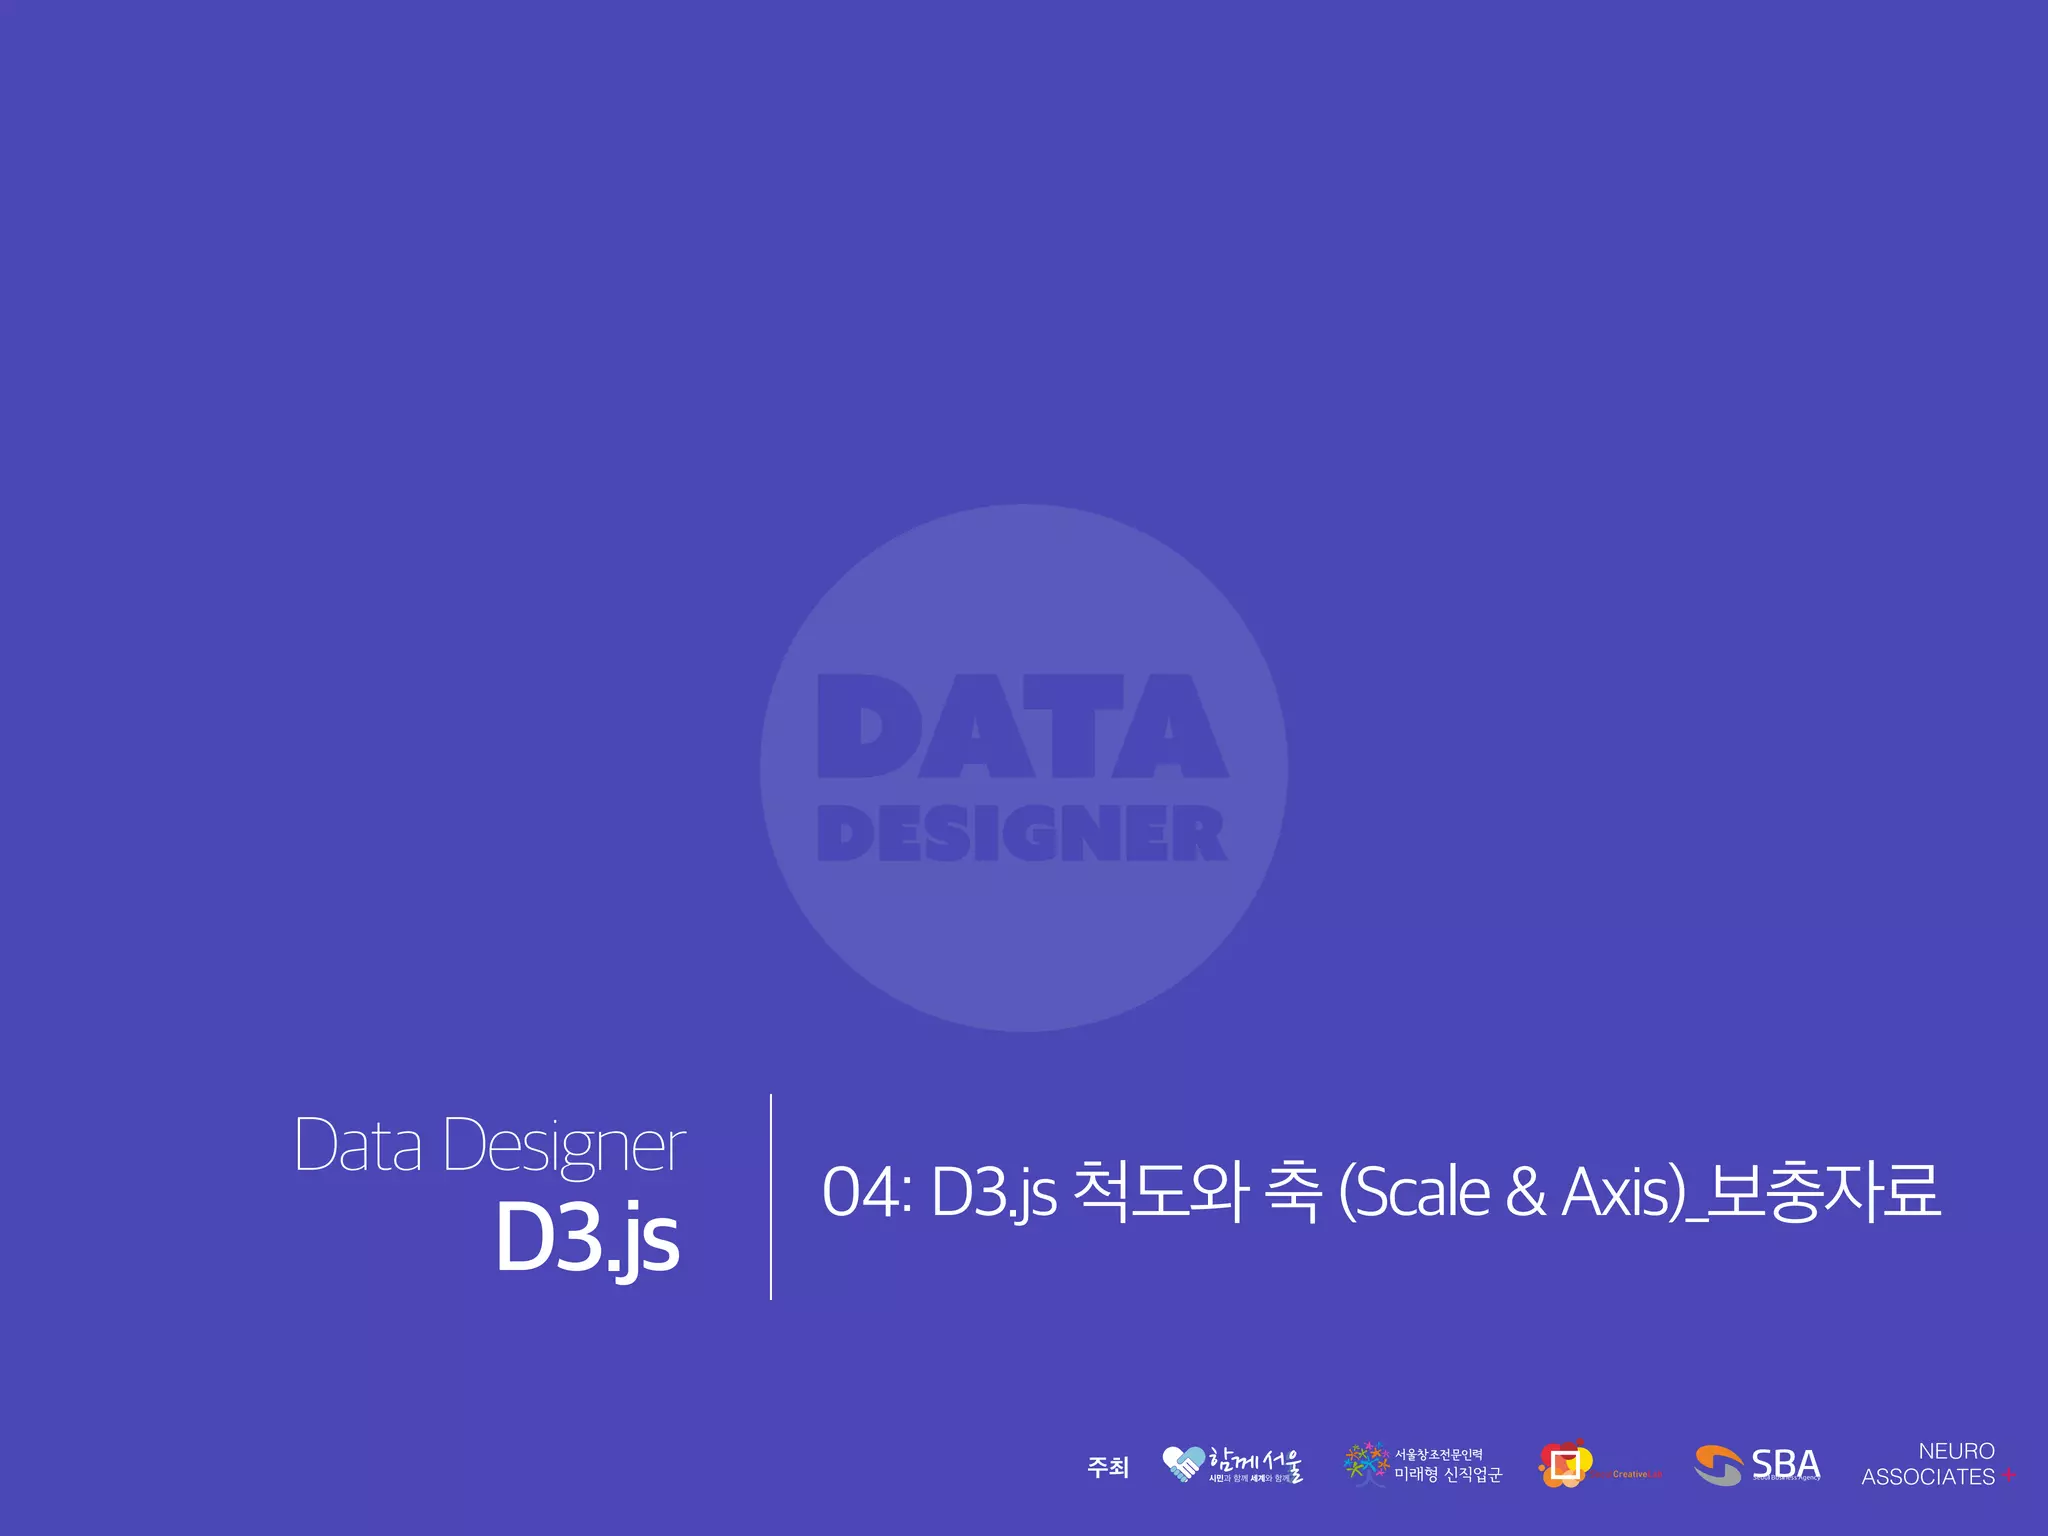
(d3.scale) 여백을포함한영역이svg영역이가장상위에생성됐습니다.
6.
꿈꾸는데이터디자이너 시즌2d3.js 척도
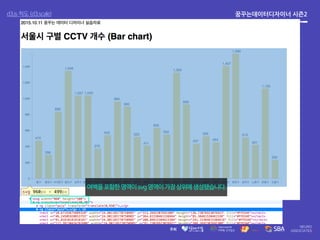
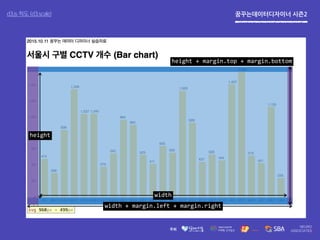
(d3.scale) margin.bottom : 30px margin.top : 20px margin.right : 20pxmargin.left: 40px 그래프에서여백영역은다음과같습니다.
7.
꿈꾸는데이터디자이너 시즌2d3.js 척도
(d3.scale) height width width + margin.left + margin.right height + margin.top + margin.bottom
8.
꿈꾸는데이터디자이너 시즌2d3.js 척도
(d3.scale) height width var xScale = d3.scale.ordinal() .domain(data.map(function(d) { return d.area; })) .rangeBands([0, width], .3); var yScale = d3.scale.linear() .domain([0, d3.max(data, function(d) { return d.value; })]) .range([height, 0]); xScale yScale x x 그래프의출력범위를(rangeBands혹은range)여백을제외한값(width,height)로설정했기때문에 막대그래프가여백을제외한영역에생성됩니다.
9.
꿈꾸는데이터디자이너 시즌2d3.js 척도
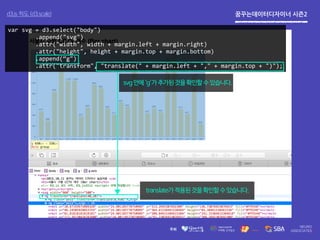
(d3.scale) var svg = d3.select("body") .append("svg") .attr("width", width + margin.left + margin.right) .attr("height", height + margin.top + margin.bottom) .append(“g") .attr("transform", "translate(" + margin.left + "," + margin.top + ")"); svg안에‘g’가추가된것을확인할수있습니다. translate가적용된것을확인할수있습니다.
10.
꿈꾸는데이터디자이너 시즌2d3.js 척도
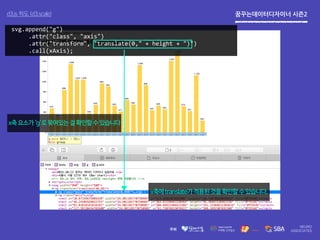
(d3.scale) x축요소가‘g’로묶여있는걸확인할수있습니다 x축에translate가적용된것을확인할수있습니다. svg.append("g") .attr("class", "axis") .attr("transform", "translate(0," + height + ")") .call(xAxis);
11.
꿈꾸는데이터디자이너 시즌2d3.js 척도
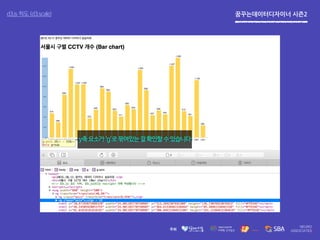
(d3.scale) y축요소가‘g’로묶여있는걸확인할수있습니다
12.
Neuro Associates ・ Portfolio
: neuroassociates.co.kr/portfolio ・ Address : 서울특별시 마포구 상수동 145-1 6F ・ Site : neuroassociates.co.kr ・ Mail : neuro.associates.consulting@gmail.com or info@neuroassociates.co.kr ・ SNS : www.facebook.com/neuroassociatessns ・ Phone : 02-334-2013
![꿈꾸는데이터디자이너 시즌2d3.js 척도 (d3.scale)
d3.scale.linear( )
.domain[시작점, 끝점]
.range[시작점, 끝점]
d3.scale.ordinal( )
.domain[시작점, 끝점]
.rangeBands[시작점, 끝점]
선형척도(scale.linear)와서열척도(scale.ordinal)비교하기](https://image.slidesharecdn.com/2d3js42-151011111651-lva1-app6891/85/Week14-D3-js_Scale-and-Axis-2-320.jpg)
![꿈꾸는데이터디자이너 시즌2d3.js 척도 (d3.scale)
d.area
xScale
d.area
xScale
var xScale = d3.scale.ordinal()
.domain(data.map(function(d) { return d.area; }))
.rangeBands([0, width], .3);
.attr("x",
function(d) { return xScale(d.area); })
1. 코드앞에서변수‘xScale’에척도함수를저장했습니다.
2. x좌표에는칼럼명‘area’데이터가들어갑니다.
3. x좌표에척도를적용해데이터가크기에비례해배치되도록설정합니다.
4. x좌표에척도를적용하기위해xScale이라는변수명을쓰고,데이터값인d.area를써줍니다.
5. 이렇게하면데이터값에척도함수가적용됩니다.
=
2.척도가적용된데이터값이
막대그래프의x좌표에삽입됩니다
1.척도가적용되지않은데이터값(d.area)에
척도가적용됩니다.
(x,y)](https://image.slidesharecdn.com/2d3js42-151011111651-lva1-app6891/85/Week14-D3-js_Scale-and-Axis-3-320.jpg)
![꿈꾸는데이터디자이너 시즌2d3.js 척도 (d3.scale)
d.value
xScale
d.value
yScale
var yScale = d3.scale.linear()
.domain([0, d3.max(data, function(d) { return d.value; })])
.range([height, 0]);
.attr("y",
function(d) { return yScale(d.value); })
1. 코드앞에서변수‘yScale’에척도함수를저장했습니다.
2. y좌표에는칼럼명‘value’데이터가들어갑니다.
3. y좌표에척도를적용해데이터가크기에비례해배치되도록설정합니다.
4. y좌표에척도를적용하기위해yScale이라는변수명을쓰고,데이터값인d.value를써줍니다.
5. 이렇게하면데이터값에척도함수가적용됩니다.
=
(x,y)
2.척도가적용된데이터값이
막대그래프의y좌표에삽입됩니다
1.척도가적용되지않은데이터값(d.value)에
척도가적용됩니다.](https://image.slidesharecdn.com/2d3js42-151011111651-lva1-app6891/85/Week14-D3-js_Scale-and-Axis-4-320.jpg)
![꿈꾸는데이터디자이너 시즌2d3.js 척도 (d3.scale)
height
width
var xScale = d3.scale.ordinal()
.domain(data.map(function(d) { return d.area; }))
.rangeBands([0, width], .3);
var yScale = d3.scale.linear()
.domain([0, d3.max(data, function(d) { return d.value; })])
.range([height, 0]);
xScale
yScale
x
x
그래프의출력범위를(rangeBands혹은range)여백을제외한값(width,height)로설정했기때문에
막대그래프가여백을제외한영역에생성됩니다.](https://image.slidesharecdn.com/2d3js42-151011111651-lva1-app6891/85/Week14-D3-js_Scale-and-Axis-8-320.jpg)


![[week6]R_Wrangling](https://cdn.slidesharecdn.com/ss_thumbnails/datadesigner-r-04-150906032721-lva1-app6892-thumbnail.jpg?width=640&height=640&fit=bounds)
![[Week14] D3.js_Scale and Axis](https://cdn.slidesharecdn.com/ss_thumbnails/week4d3-151011033640-lva1-app6892-thumbnail.jpg?width=640&height=640&fit=bounds)
![[Week8]R_ggplot2](https://cdn.slidesharecdn.com/ss_thumbnails/week8rggplot2-150913001335-lva1-app6891-thumbnail.jpg?width=640&height=640&fit=bounds)
![[Week15] D3.js_Scatter_Chart](https://cdn.slidesharecdn.com/ss_thumbnails/2d3js5-151014035535-lva1-app6892-thumbnail.jpg?width=640&height=640&fit=bounds)
![[시즌2, week3] R Basic](https://cdn.slidesharecdn.com/ss_thumbnails/datadesigner-r-02-150825143753-lva1-app6891-thumbnail.jpg?width=640&height=640&fit=bounds)
![[Week12] D3.js_Basic2](https://cdn.slidesharecdn.com/ss_thumbnails/week2d3-151004003519-lva1-app6891-thumbnail.jpg?width=640&height=640&fit=bounds)
![[week16] D3.js (Scale & axis)](https://cdn.slidesharecdn.com/ss_thumbnails/d3-150410223256-conversion-gate01-thumbnail.jpg?width=640&height=640&fit=bounds)
![[week17] D3.js_Tooltip](https://cdn.slidesharecdn.com/ss_thumbnails/2d3js7-151021033054-lva1-app6892-thumbnail.jpg?width=640&height=640&fit=bounds)
![[week11] R_ggmap, leaflet](https://cdn.slidesharecdn.com/ss_thumbnails/datadesigner-r-07-150923032312-lva1-app6891-thumbnail.jpg?width=640&height=640&fit=bounds)
![[Week13] D3.js_Bar Chart](https://cdn.slidesharecdn.com/ss_thumbnails/week3d3-151007011322-lva1-app6892-thumbnail.jpg?width=640&height=640&fit=bounds)
![[week16] D3.js_Transition](https://cdn.slidesharecdn.com/ss_thumbnails/2d3js6-151018032608-lva1-app6891-thumbnail.jpg?width=640&height=640&fit=bounds)
![[week12] D3.js_Basic](https://cdn.slidesharecdn.com/ss_thumbnails/2d3js1-150930011102-lva1-app6892-thumbnail.jpg?width=640&height=640&fit=bounds)


![[week14] Getting started with D3.js](https://cdn.slidesharecdn.com/ss_thumbnails/d3-150331194754-conversion-gate01-thumbnail.jpg?width=640&height=640&fit=bounds)


![[Week20] D3.js_Mapping](https://cdn.slidesharecdn.com/ss_thumbnails/week19mapping-151028033253-lva1-app6892-thumbnail.jpg?width=640&height=640&fit=bounds)


![[ 하코사세미나] 의외로 쉬운 D3 그래프 퍼블리싱](https://cdn.slidesharecdn.com/ss_thumbnails/2015-12-05-d3-151208015226-lva1-app6891-thumbnail.jpg?width=640&height=640&fit=bounds)

![[문디 10주차] d3.js 상호작용](https://cdn.slidesharecdn.com/ss_thumbnails/10-150521023910-lva1-app6892-thumbnail.jpg?width=640&height=640&fit=bounds)


![[북리뷰] 데이터포인트 4장](https://cdn.slidesharecdn.com/ss_thumbnails/4-140526223237-phpapp01-thumbnail.jpg?width=640&height=640&fit=bounds)


![[HeXathon] 발표자료 - 세모알](https://cdn.slidesharecdn.com/ss_thumbnails/1-160927095902-thumbnail.jpg?width=640&height=640&fit=bounds)


![[week8] 데이터읽어주는남자](https://cdn.slidesharecdn.com/ss_thumbnails/8final-151016015556-lva1-app6891-thumbnail.jpg?width=640&height=640&fit=bounds)
![[week7] 데이터읽어주는남자](https://cdn.slidesharecdn.com/ss_thumbnails/7-151001021639-lva1-app6892-thumbnail.jpg?width=640&height=640&fit=bounds)
![[week6] 데이터읽어주는남자](https://cdn.slidesharecdn.com/ss_thumbnails/6-2-151001021527-lva1-app6891-thumbnail.jpg?width=640&height=640&fit=bounds)
![[week9]R_statics](https://cdn.slidesharecdn.com/ss_thumbnails/r150916-150916024827-lva1-app6892-thumbnail.jpg?width=640&height=640&fit=bounds)
![[week7]R_Wrangling(2)](https://cdn.slidesharecdn.com/ss_thumbnails/datadesigner-r-05-150908144745-lva1-app6891-thumbnail.jpg?width=640&height=640&fit=bounds)
![[Week5]데이터읽어주는남자](https://cdn.slidesharecdn.com/ss_thumbnails/week5-150902003018-lva1-app6892-thumbnail.jpg?width=640&height=640&fit=bounds)
![[Week5]R_scraping](https://cdn.slidesharecdn.com/ss_thumbnails/week5rscraping-150902002731-lva1-app6891-thumbnail.jpg?width=640&height=640&fit=bounds)
![[Week4]데이터읽어주는남자](https://cdn.slidesharecdn.com/ss_thumbnails/week4-150831083756-lva1-app6892-thumbnail.jpg?width=640&height=640&fit=bounds)
![[Week4] Google refine](https://cdn.slidesharecdn.com/ss_thumbnails/week4googlerefinelecture-150830004221-lva1-app6892-thumbnail.jpg?width=640&height=640&fit=bounds)
![[Week3]데이터읽어주는남자](https://cdn.slidesharecdn.com/ss_thumbnails/week3-150826083652-lva1-app6891-thumbnail.jpg?width=640&height=640&fit=bounds)
![[Week2]데이터읽어주는남자](https://cdn.slidesharecdn.com/ss_thumbnails/week2-150826002440-lva1-app6891-thumbnail.jpg?width=640&height=640&fit=bounds)


![[Week10] R graphics](https://cdn.slidesharecdn.com/ss_thumbnails/week10rgraphics-150224230109-conversion-gate02-thumbnail.jpg?width=640&height=640&fit=bounds)