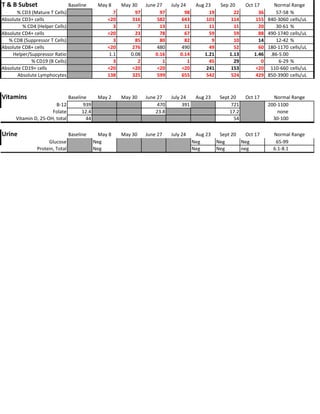
T & B Subset Baseline May 8 May 30 June 27 July 24 Aug 23 Sep 20 Oct 17 
Normal Range 
% CD3 (Mature T Cells) 7 97 97 98 19 22 36 57‐58 % 
Absolute CD3+ cells <20 316 582 643 103 114 155 840‐3060 cells/uL 
% CD4 (Helper Cells) 3 7 13 11 11 11 20 30‐61 % 
Absolute CD4+ cells <20 23 78 67 59 59 88 490‐1740 cells/uL 
% CD8 (Suppressor T Cells) 3 85 80 82 9 10 14 12‐42 % 
Absolute CD8+ cells <20 276 480 490 49 52 60 180‐1170 cells/uL 
Helper/Suppressor Ratio 1.1 0.08 0.16 0.14 1.21 1.13 1.46 .86‐5.00 
% CD19 (B Cells) 3 2 1 1 45 29 0 6‐29 % 
Absolute CD19+ cells <20 <20 <20 <20 241 153 <20 110‐660 cells/uL 
Absolute Lymphocytes 138 325 599 655 542 524 429 850‐3900 cells/uL 
Vitamins Baseline May 2 May 30 June 27 July 24 Aug 23 Sept 20 Oct 17 
Normal Range 
B‐12 939 470 391 721 200‐1100 
Folate 12.4 23.8 17.2 none 
Vitamin D, 25‐OH, total 44 54 30‐100 
Urine Baseline May 8 May 30 June 27 July 24 Aug 23 Sept 20 Oct 17 
Normal Range 
Glucose Neg Neg Neg Neg 65‐99 
Protein, Total Neg Neg Neg neg 6.1‐8.1

Lemtrada Week 24 t&b only

  • 1.
    T & BSubset Baseline May 8 May 30 June 27 July 24 Aug 23 Sep 20 Oct 17 Normal Range % CD3 (Mature T Cells) 7 97 97 98 19 22 36 57‐58 % Absolute CD3+ cells <20 316 582 643 103 114 155 840‐3060 cells/uL % CD4 (Helper Cells) 3 7 13 11 11 11 20 30‐61 % Absolute CD4+ cells <20 23 78 67 59 59 88 490‐1740 cells/uL % CD8 (Suppressor T Cells) 3 85 80 82 9 10 14 12‐42 % Absolute CD8+ cells <20 276 480 490 49 52 60 180‐1170 cells/uL Helper/Suppressor Ratio 1.1 0.08 0.16 0.14 1.21 1.13 1.46 .86‐5.00 % CD19 (B Cells) 3 2 1 1 45 29 0 6‐29 % Absolute CD19+ cells <20 <20 <20 <20 241 153 <20 110‐660 cells/uL Absolute Lymphocytes 138 325 599 655 542 524 429 850‐3900 cells/uL Vitamins Baseline May 2 May 30 June 27 July 24 Aug 23 Sept 20 Oct 17 Normal Range B‐12 939 470 391 721 200‐1100 Folate 12.4 23.8 17.2 none Vitamin D, 25‐OH, total 44 54 30‐100 Urine Baseline May 8 May 30 June 27 July 24 Aug 23 Sept 20 Oct 17 Normal Range Glucose Neg Neg Neg Neg 65‐99 Protein, Total Neg Neg Neg neg 6.1‐8.1