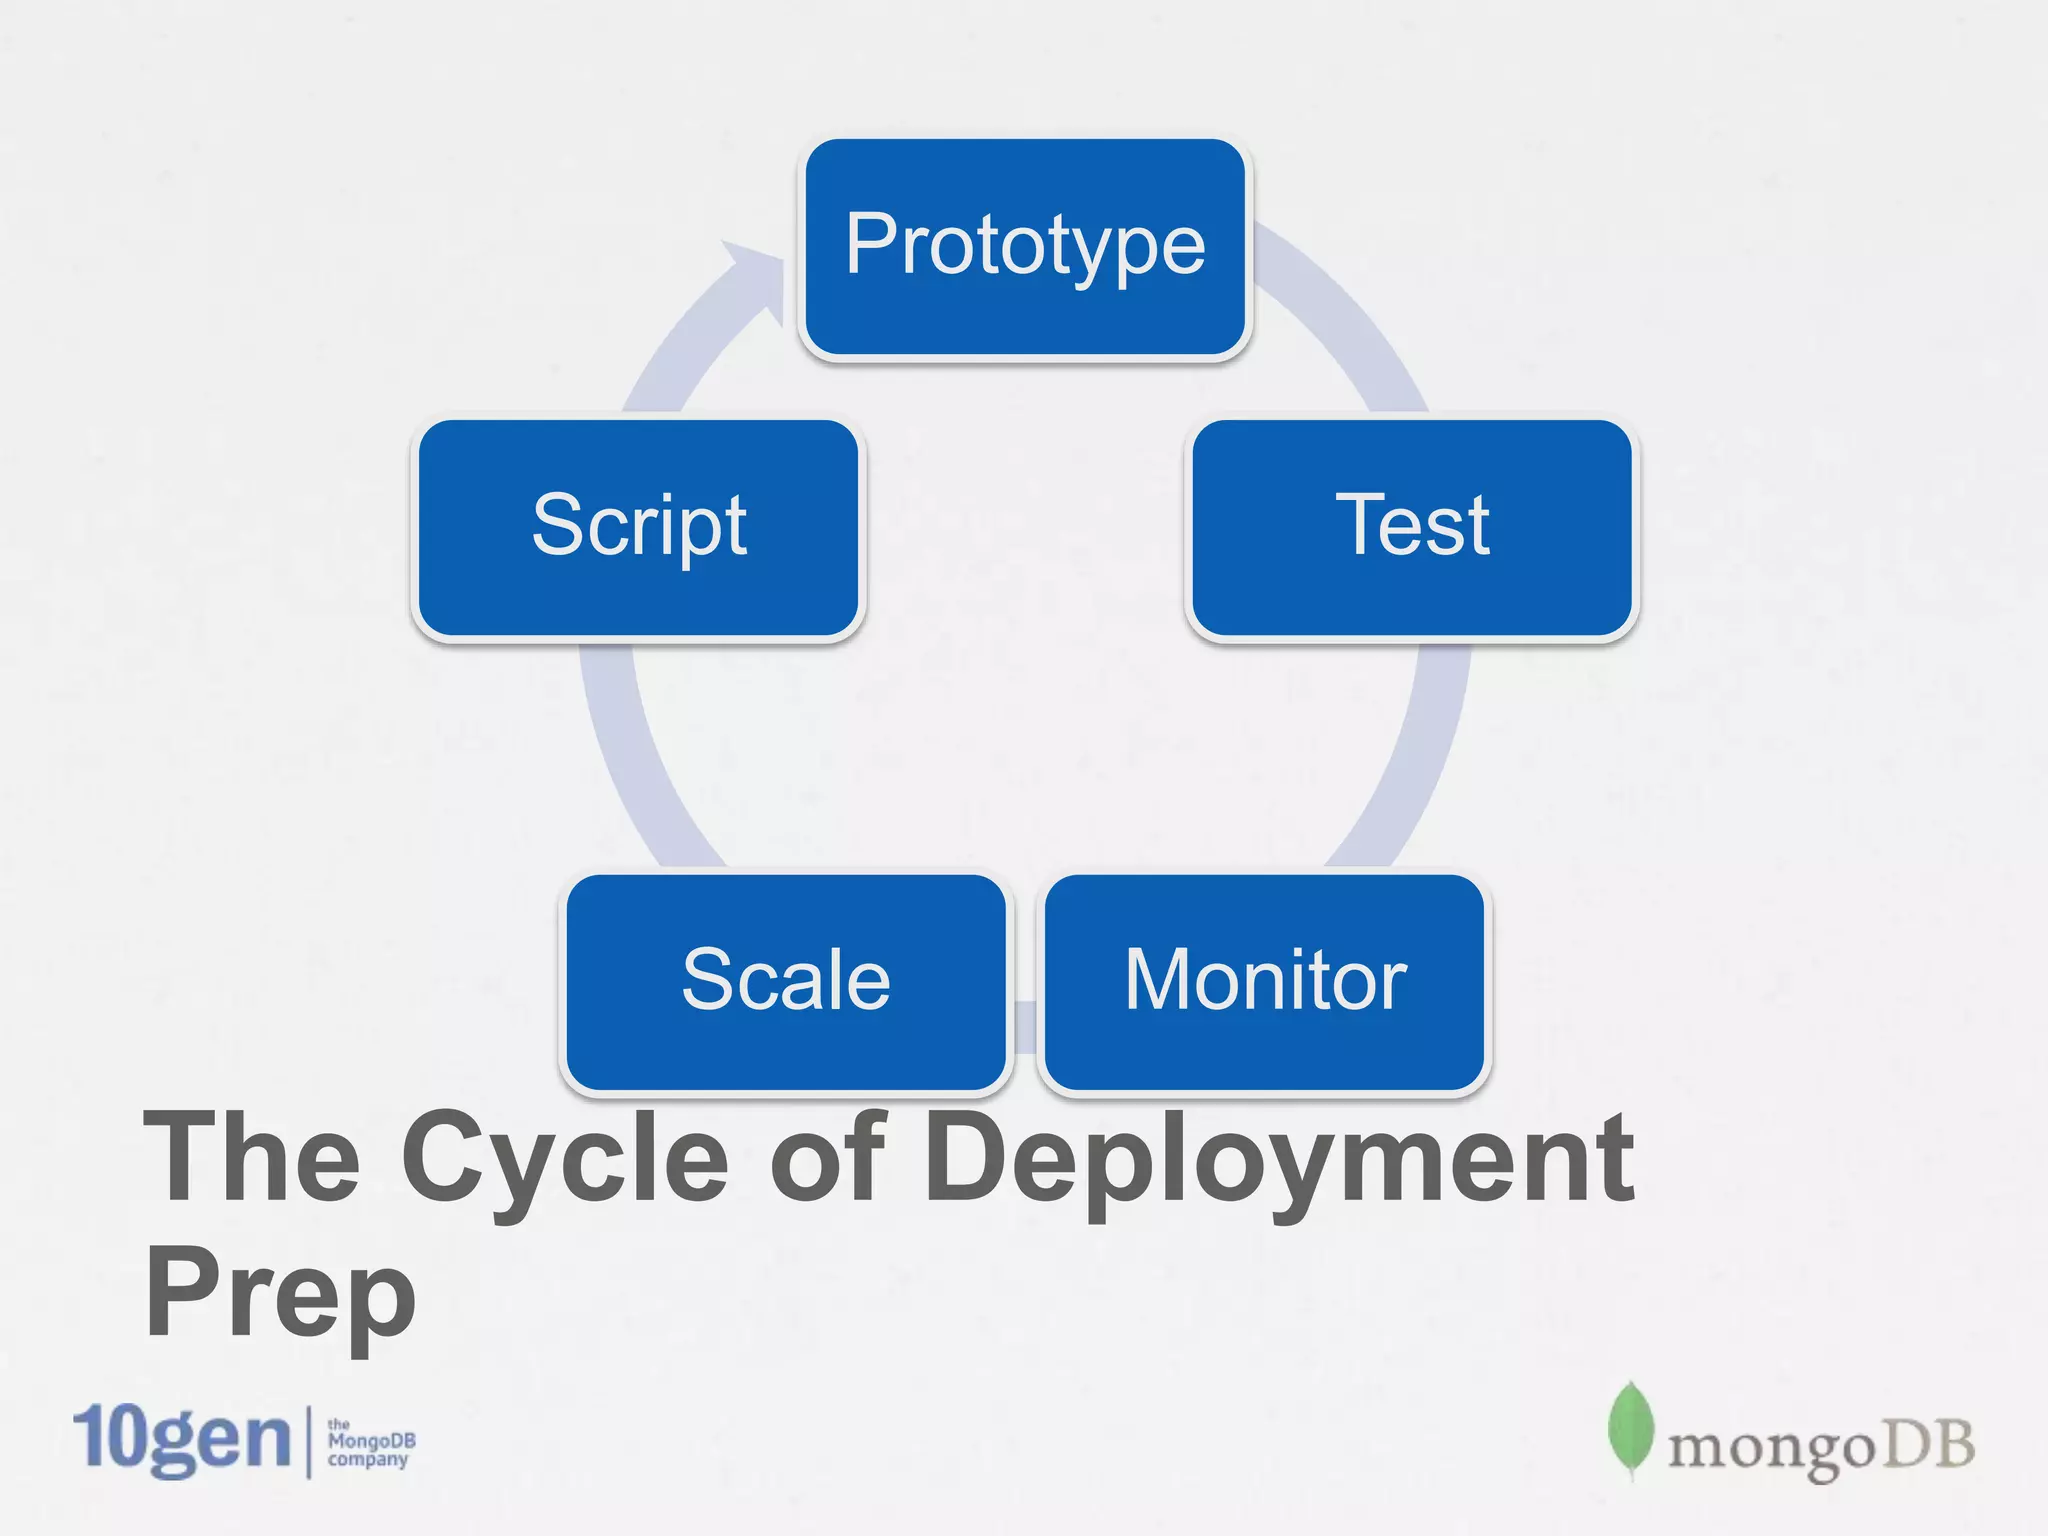
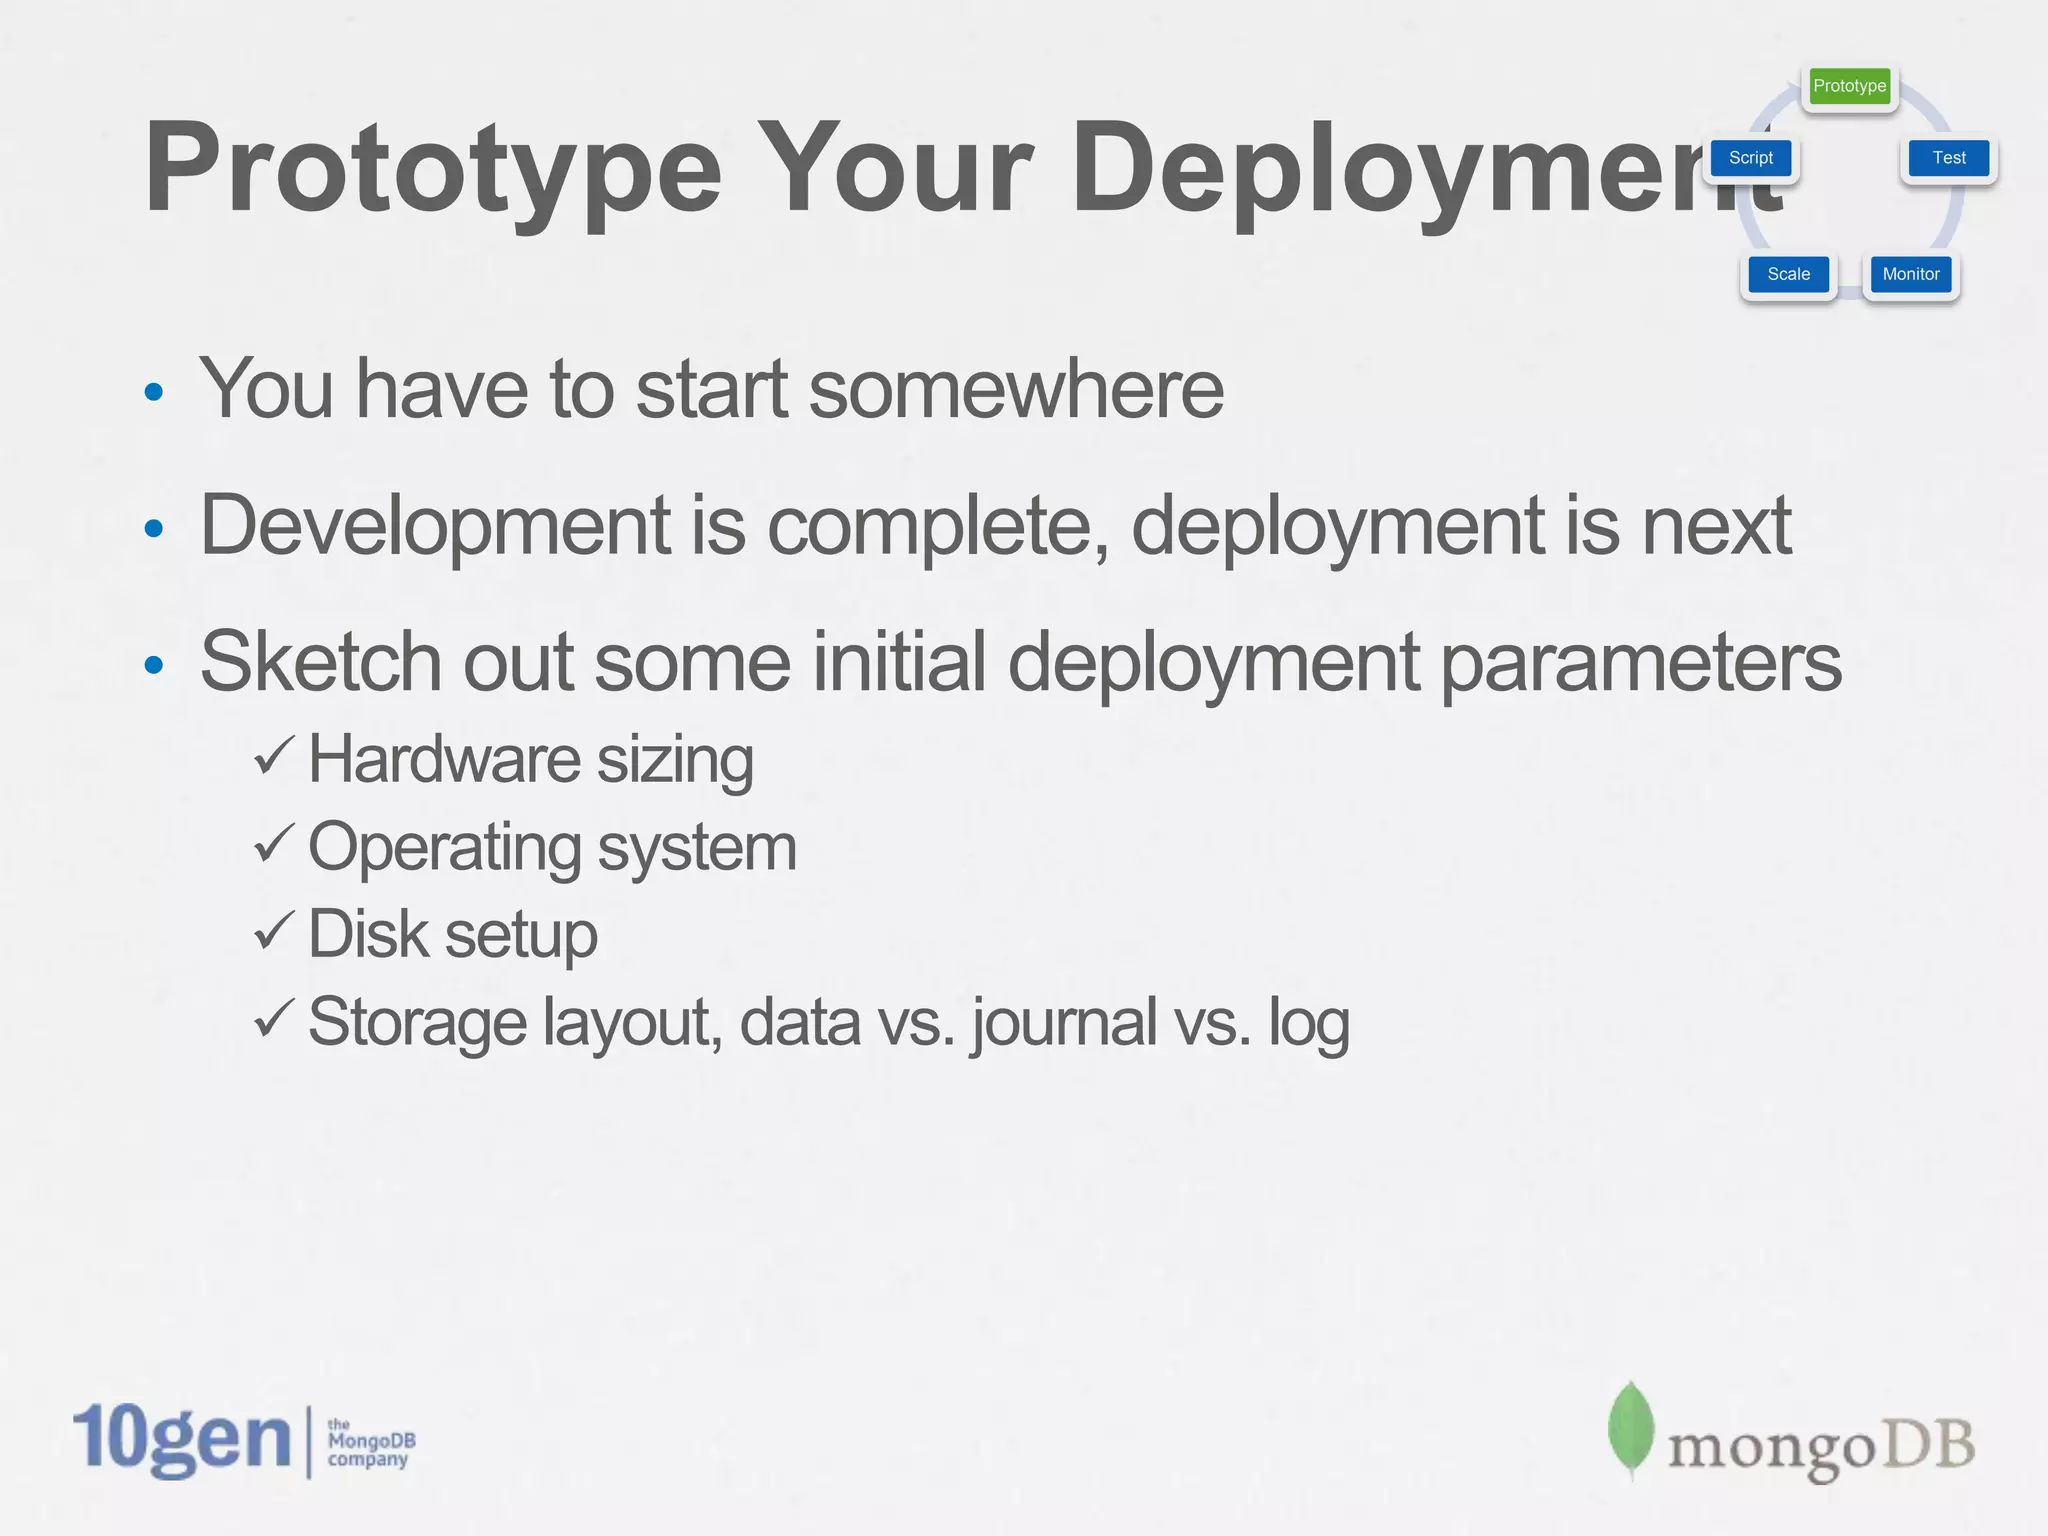
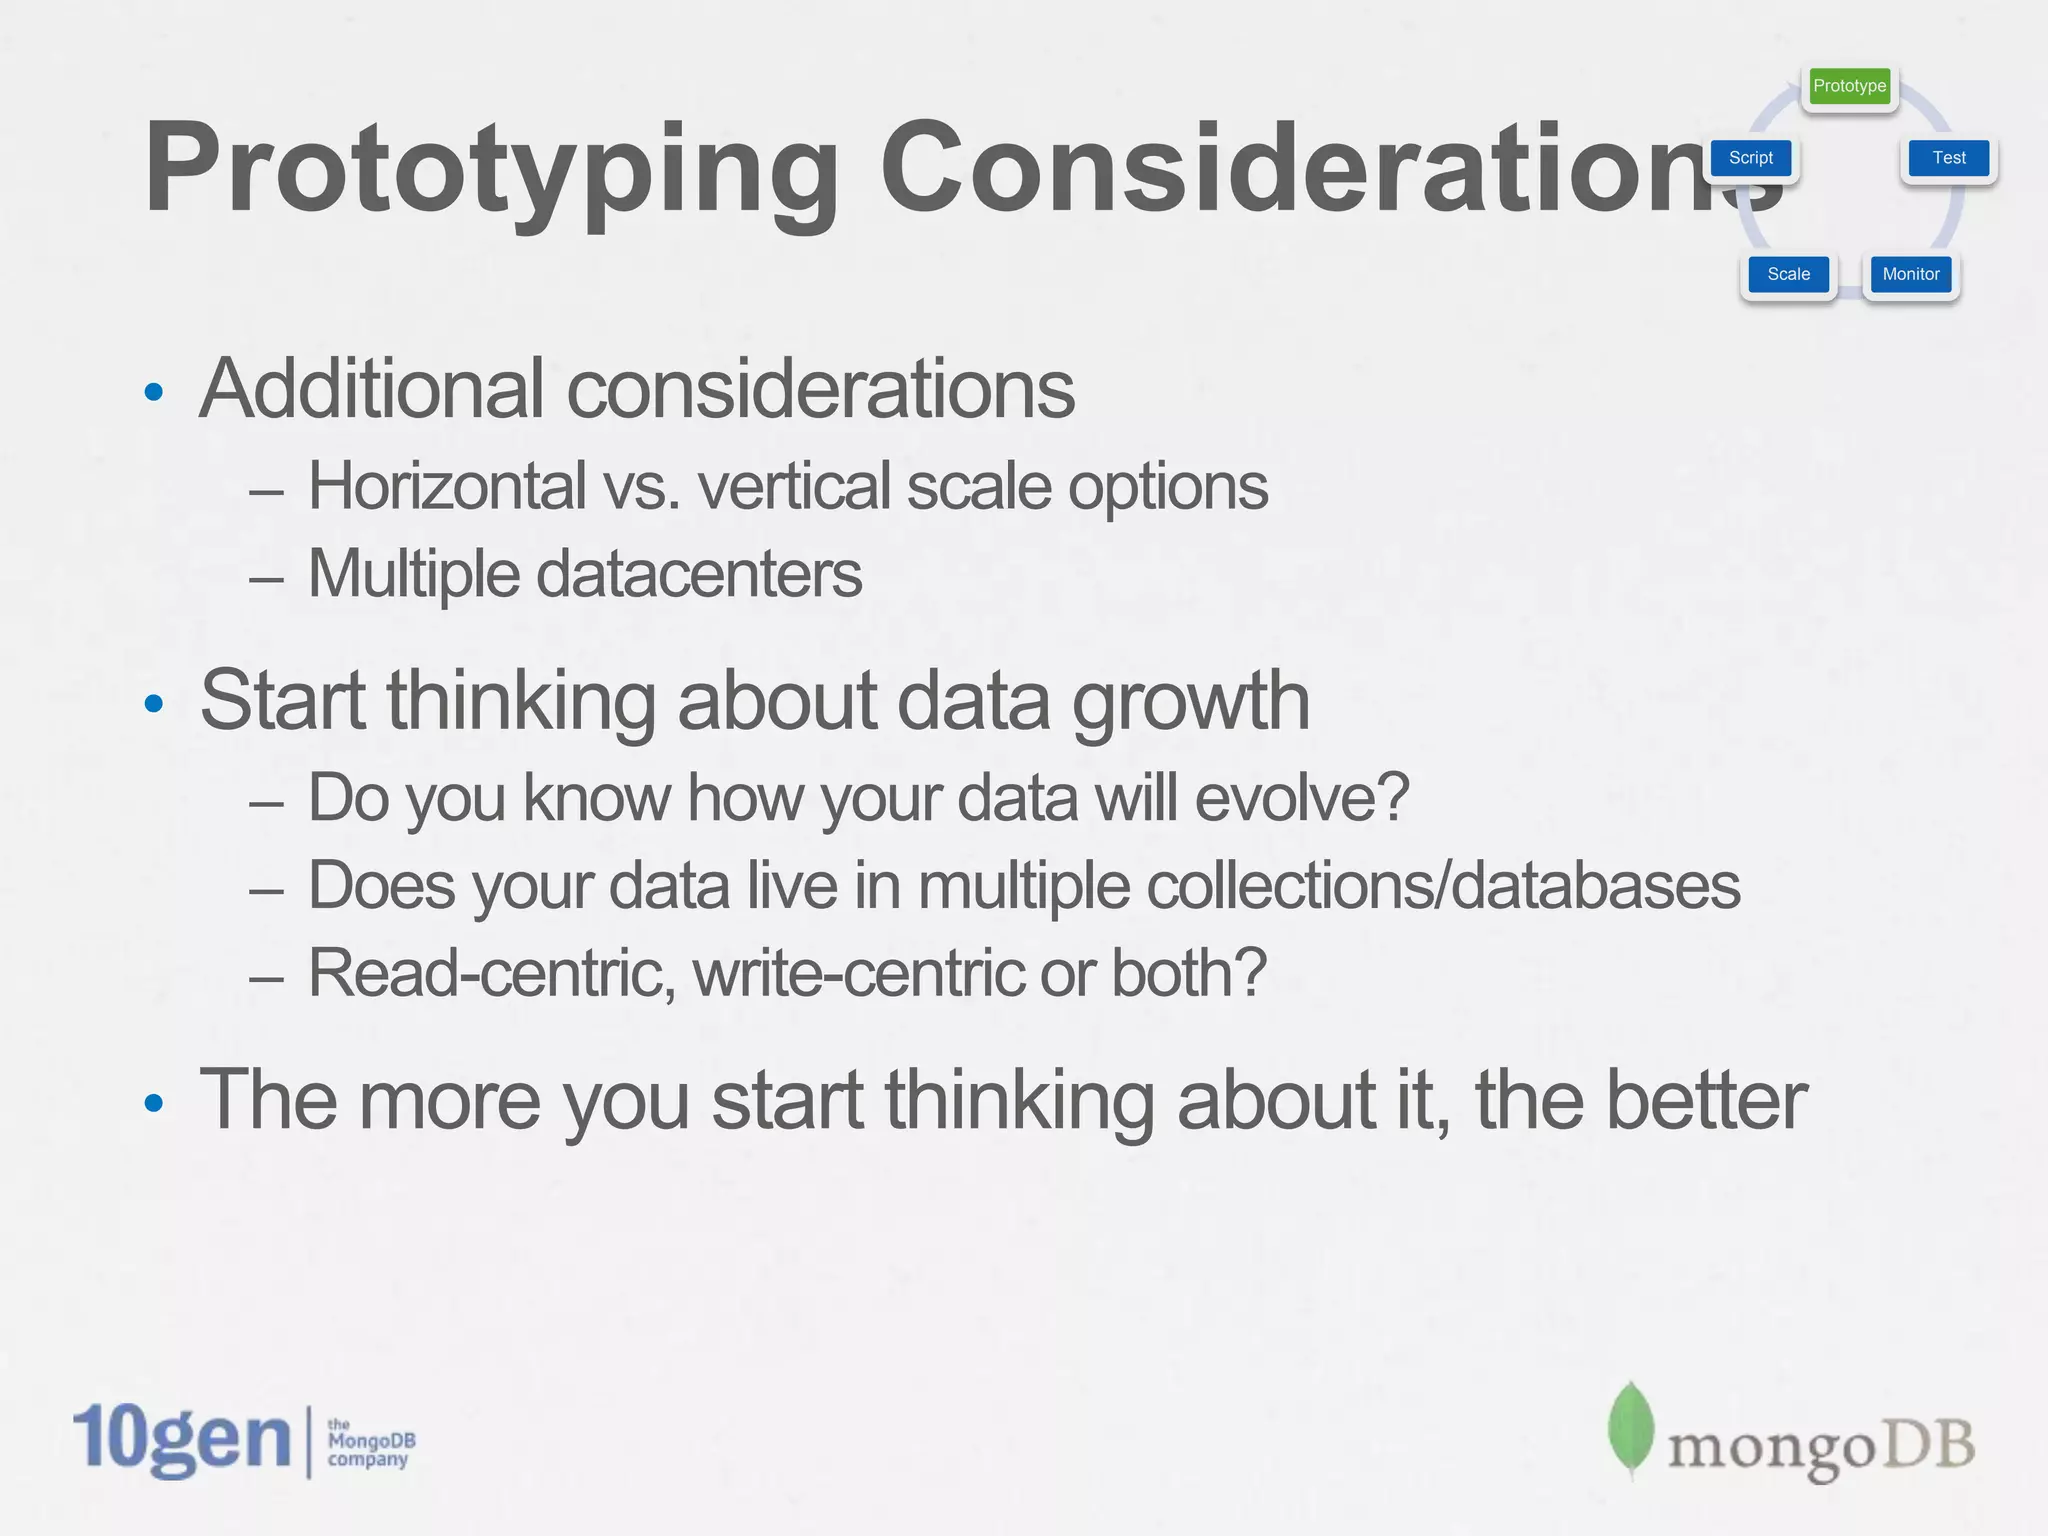
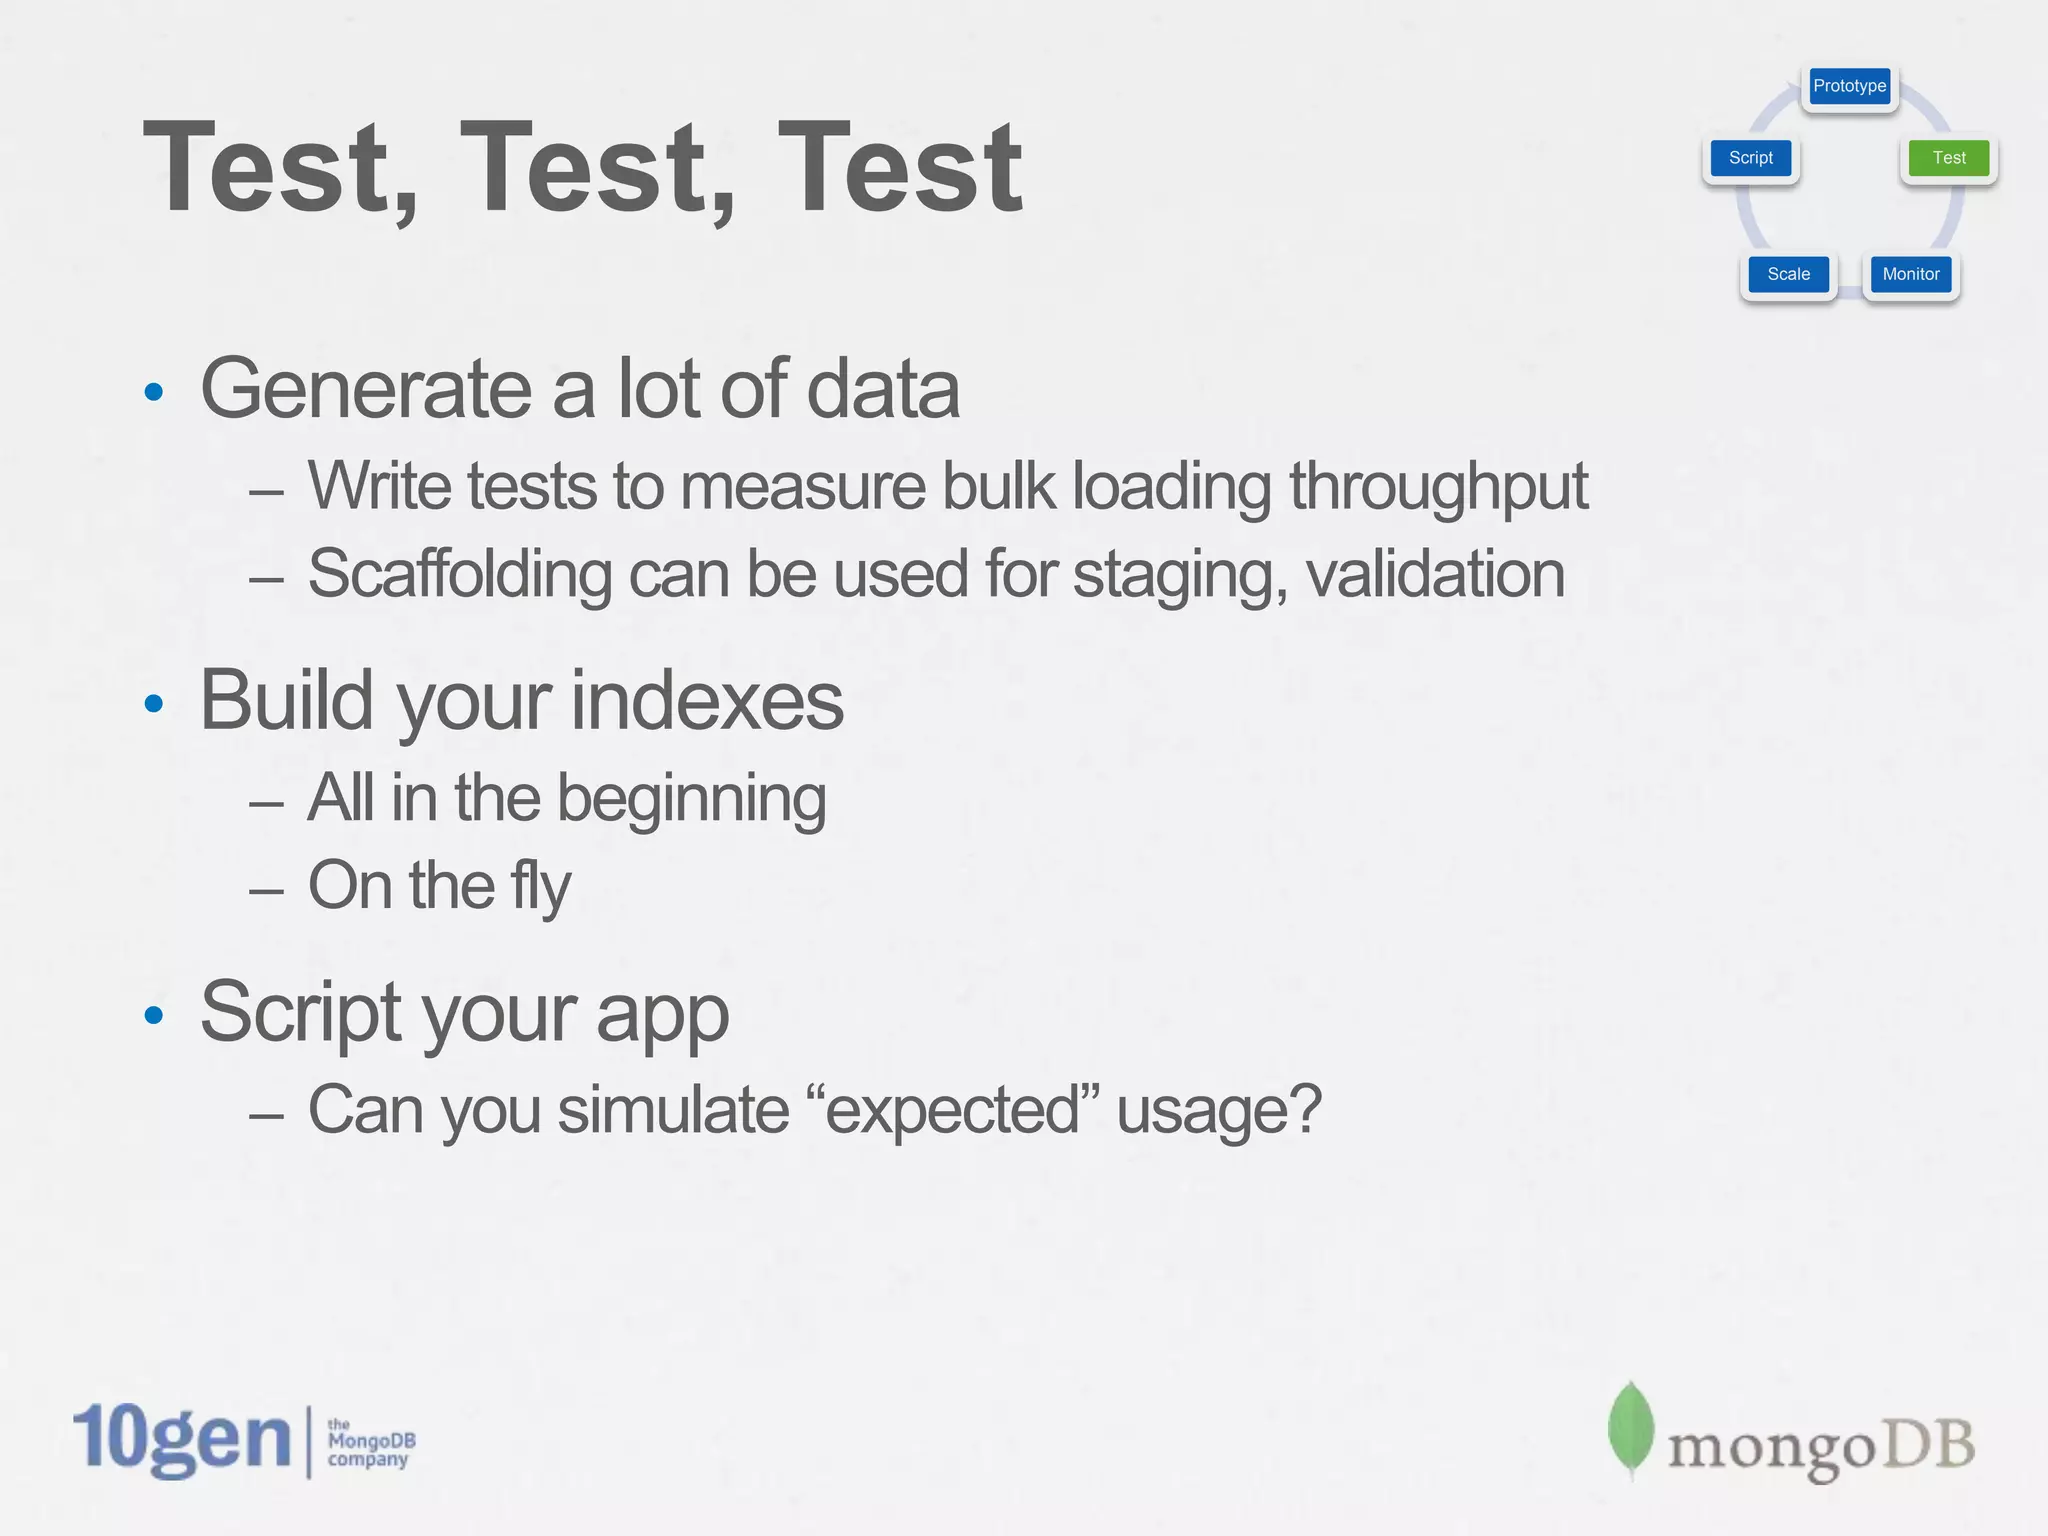
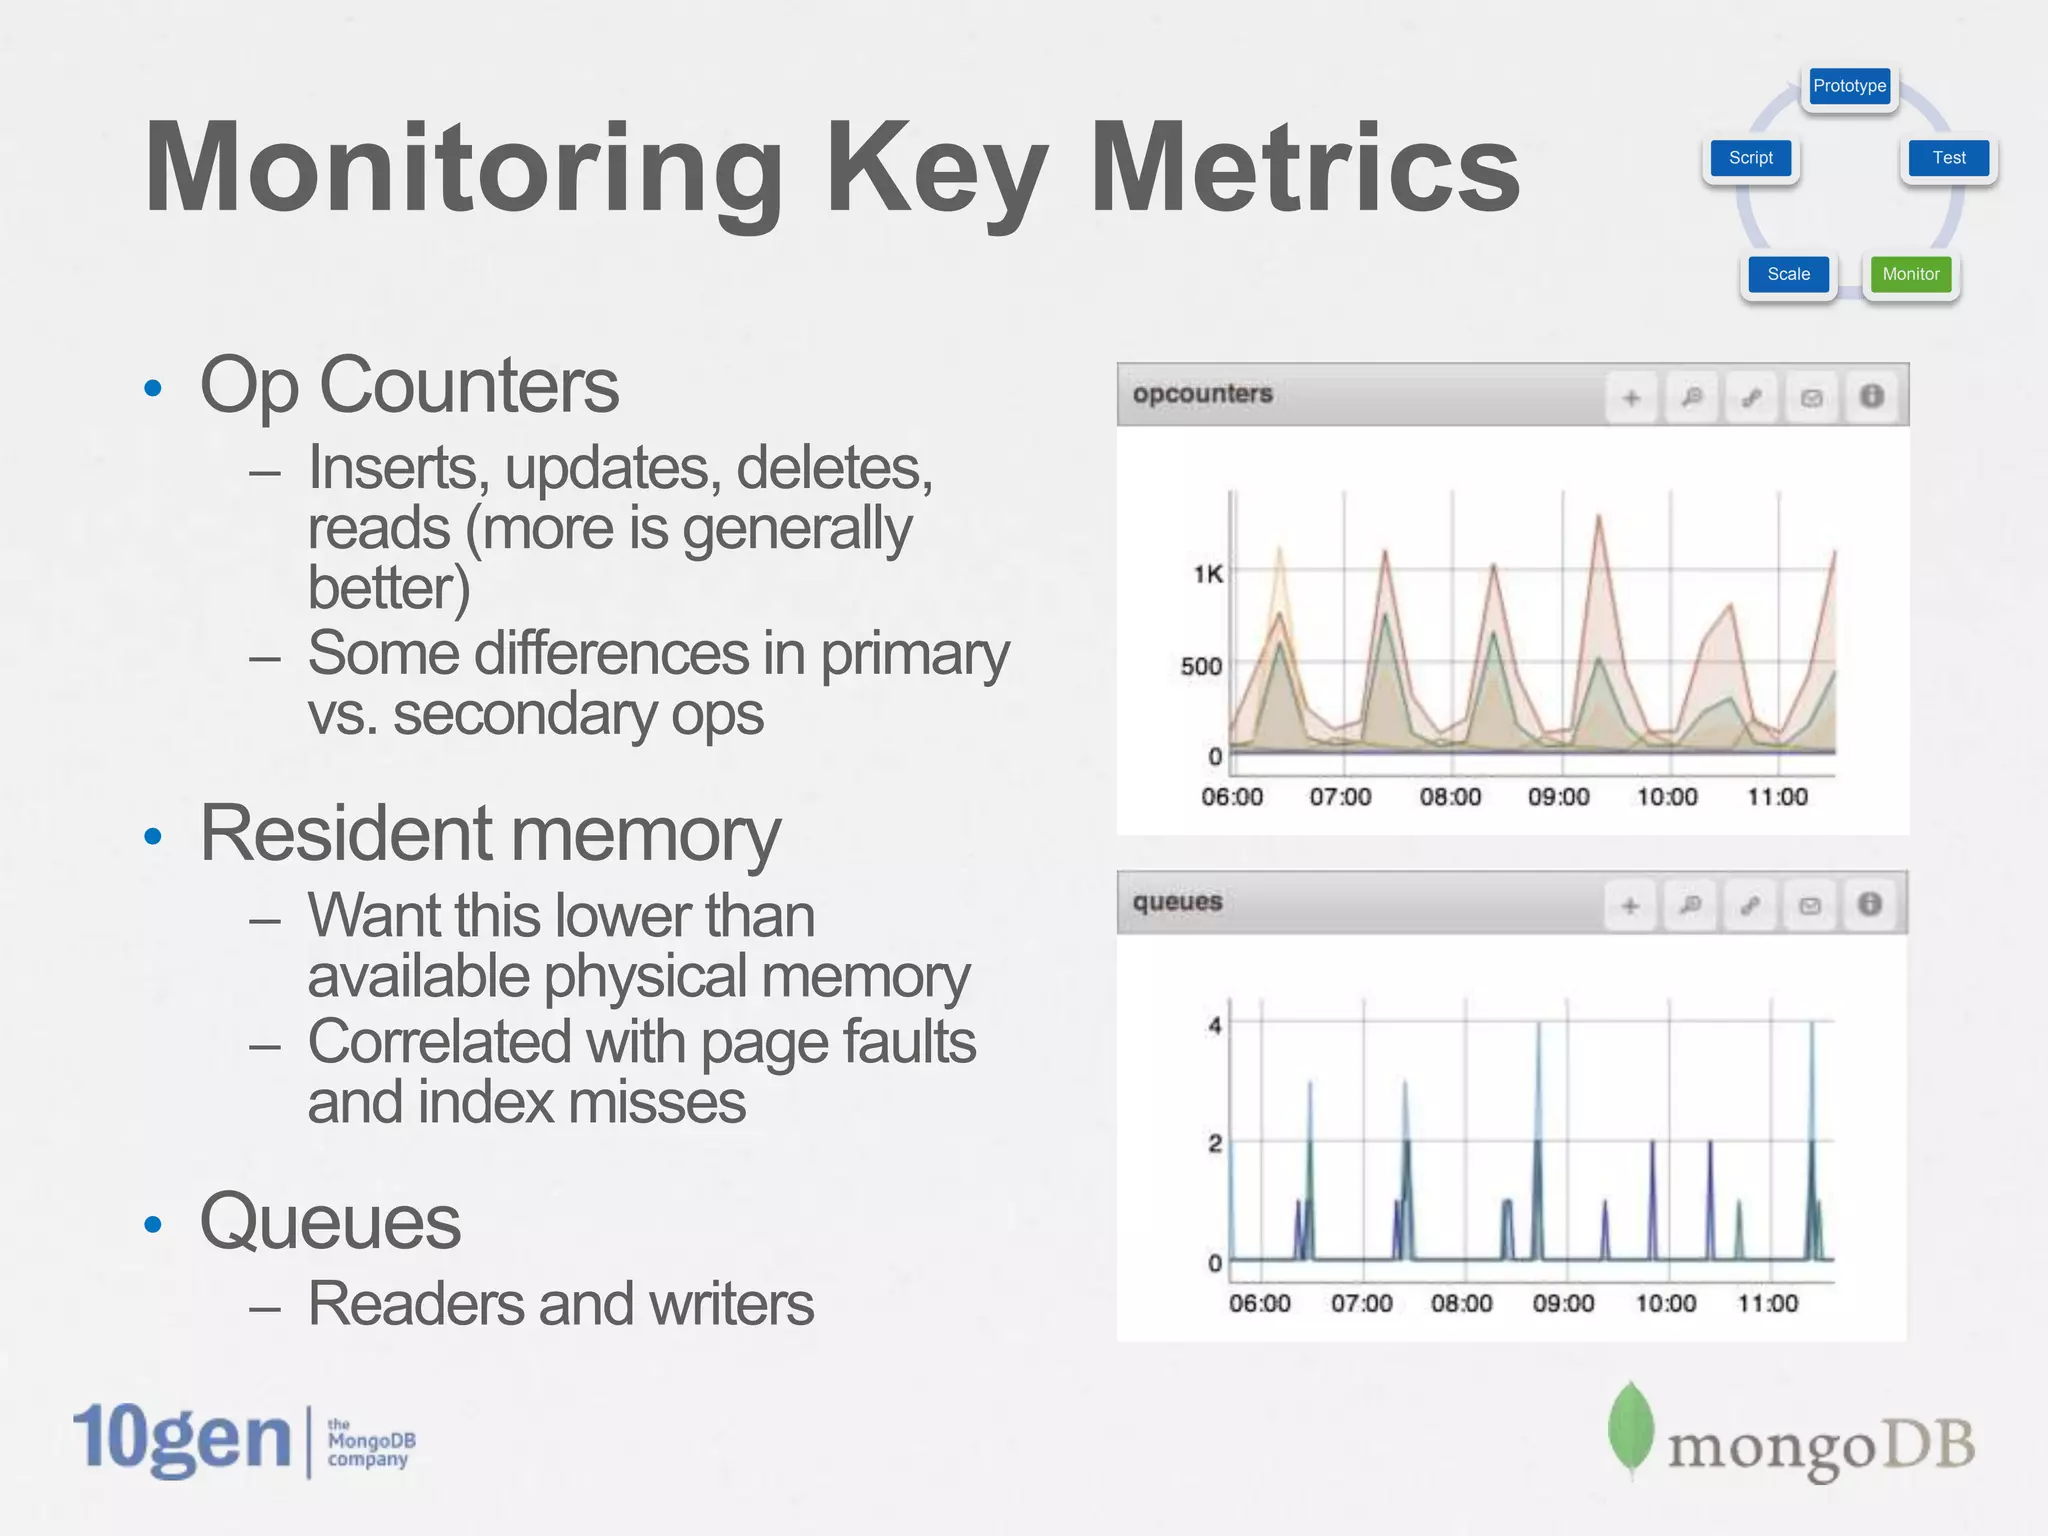
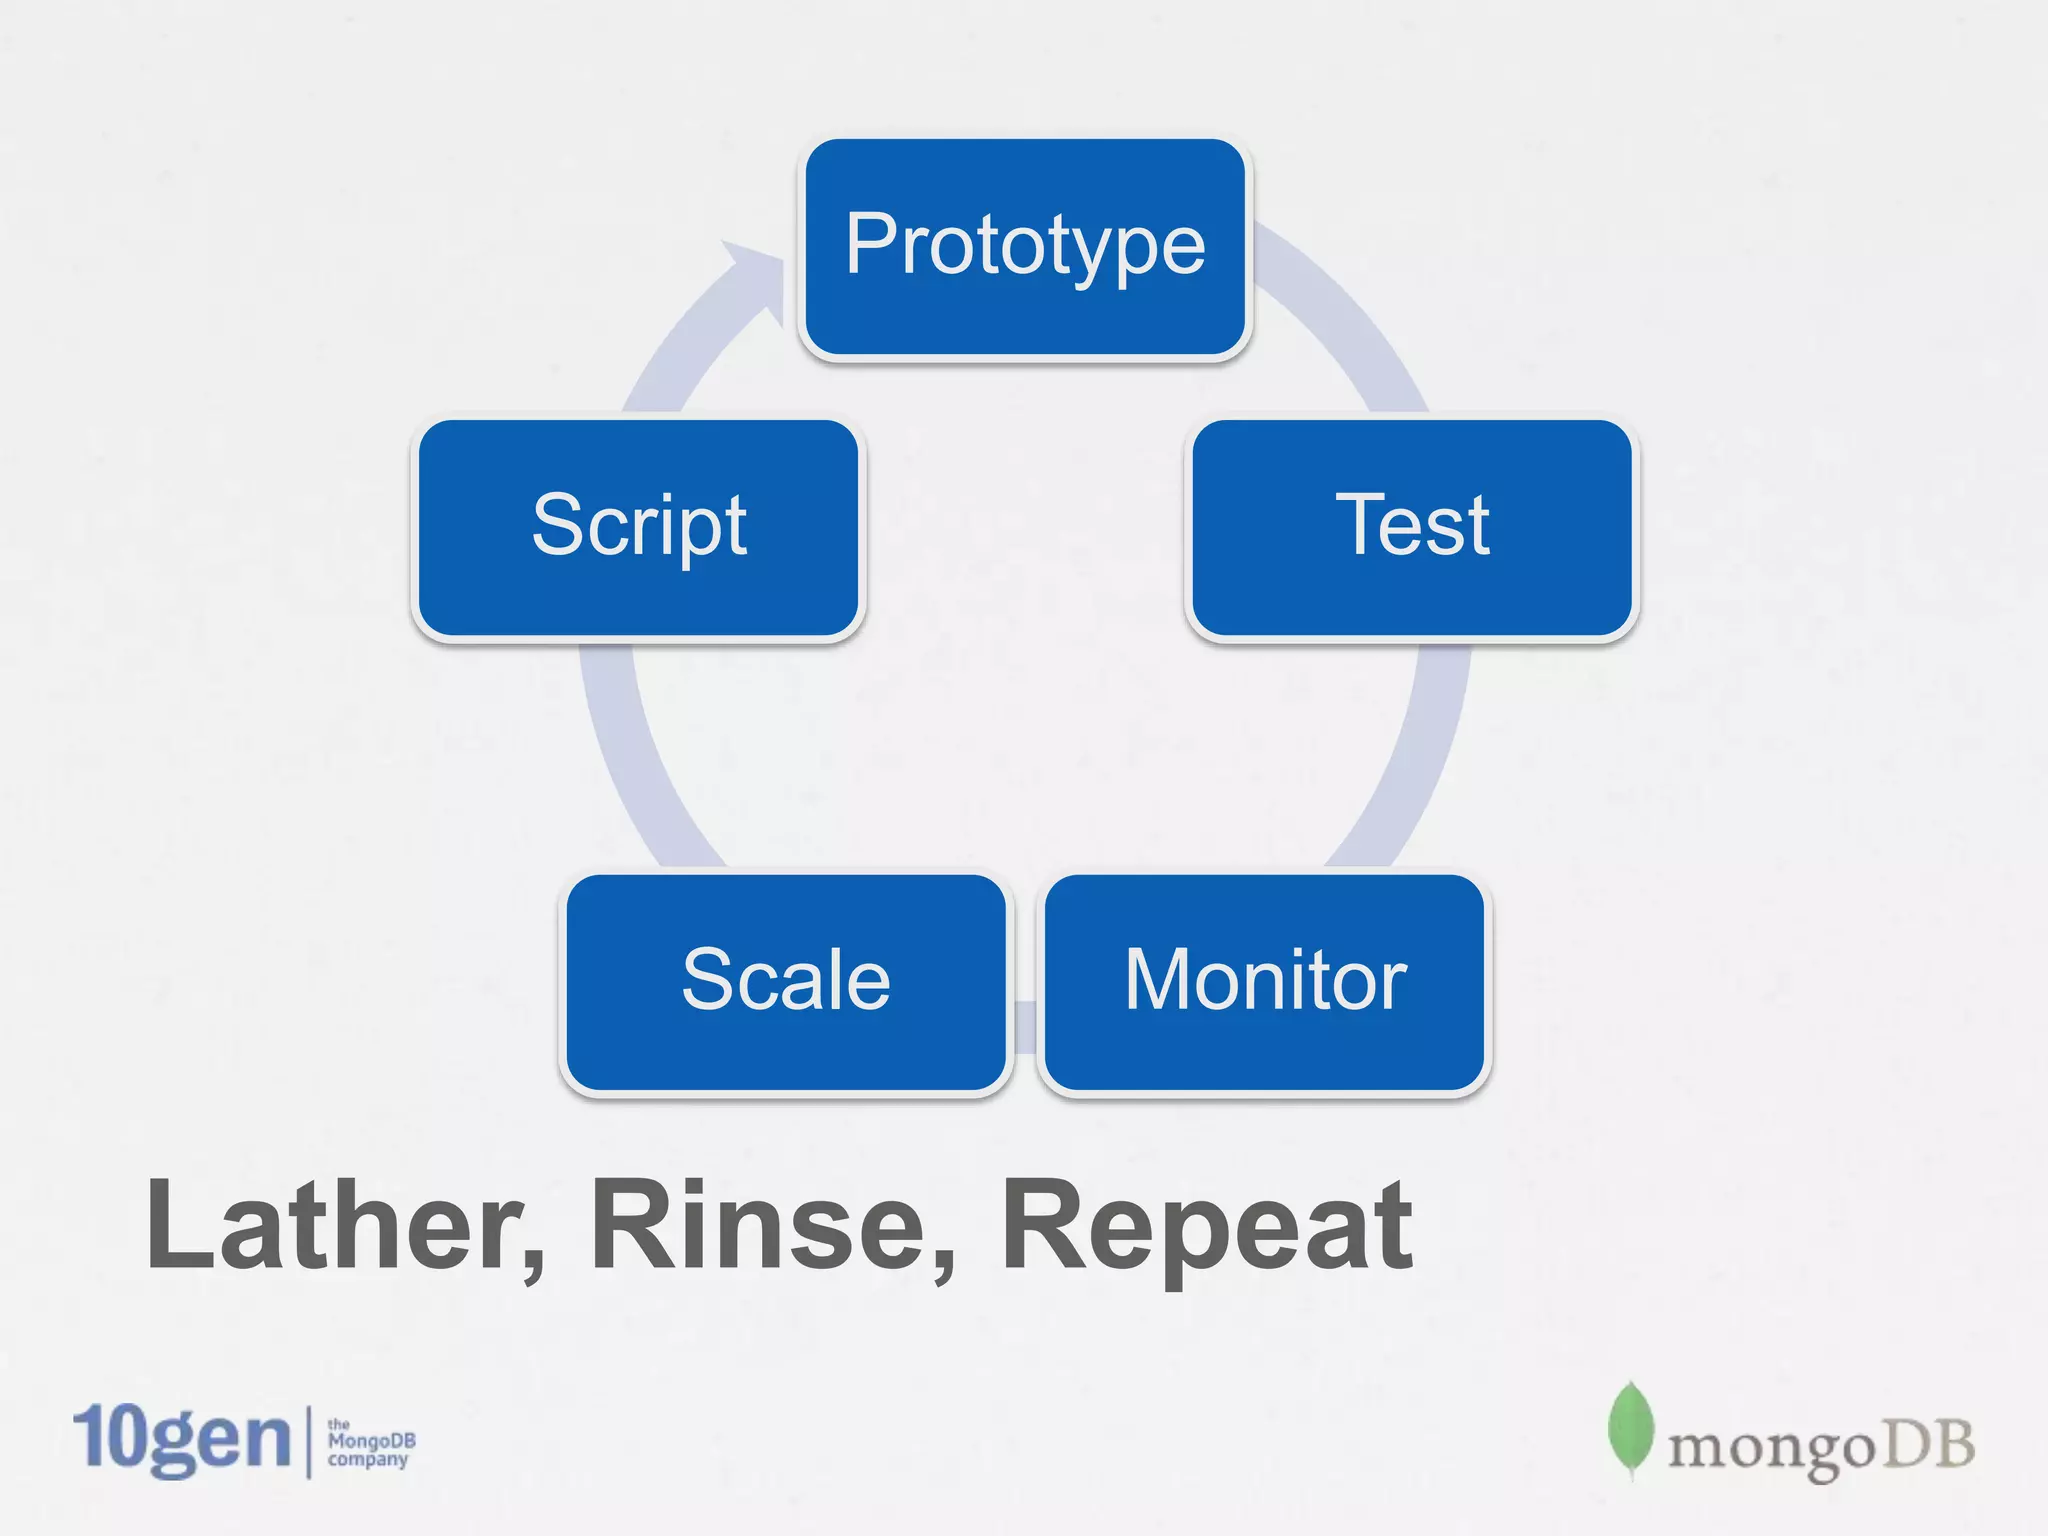
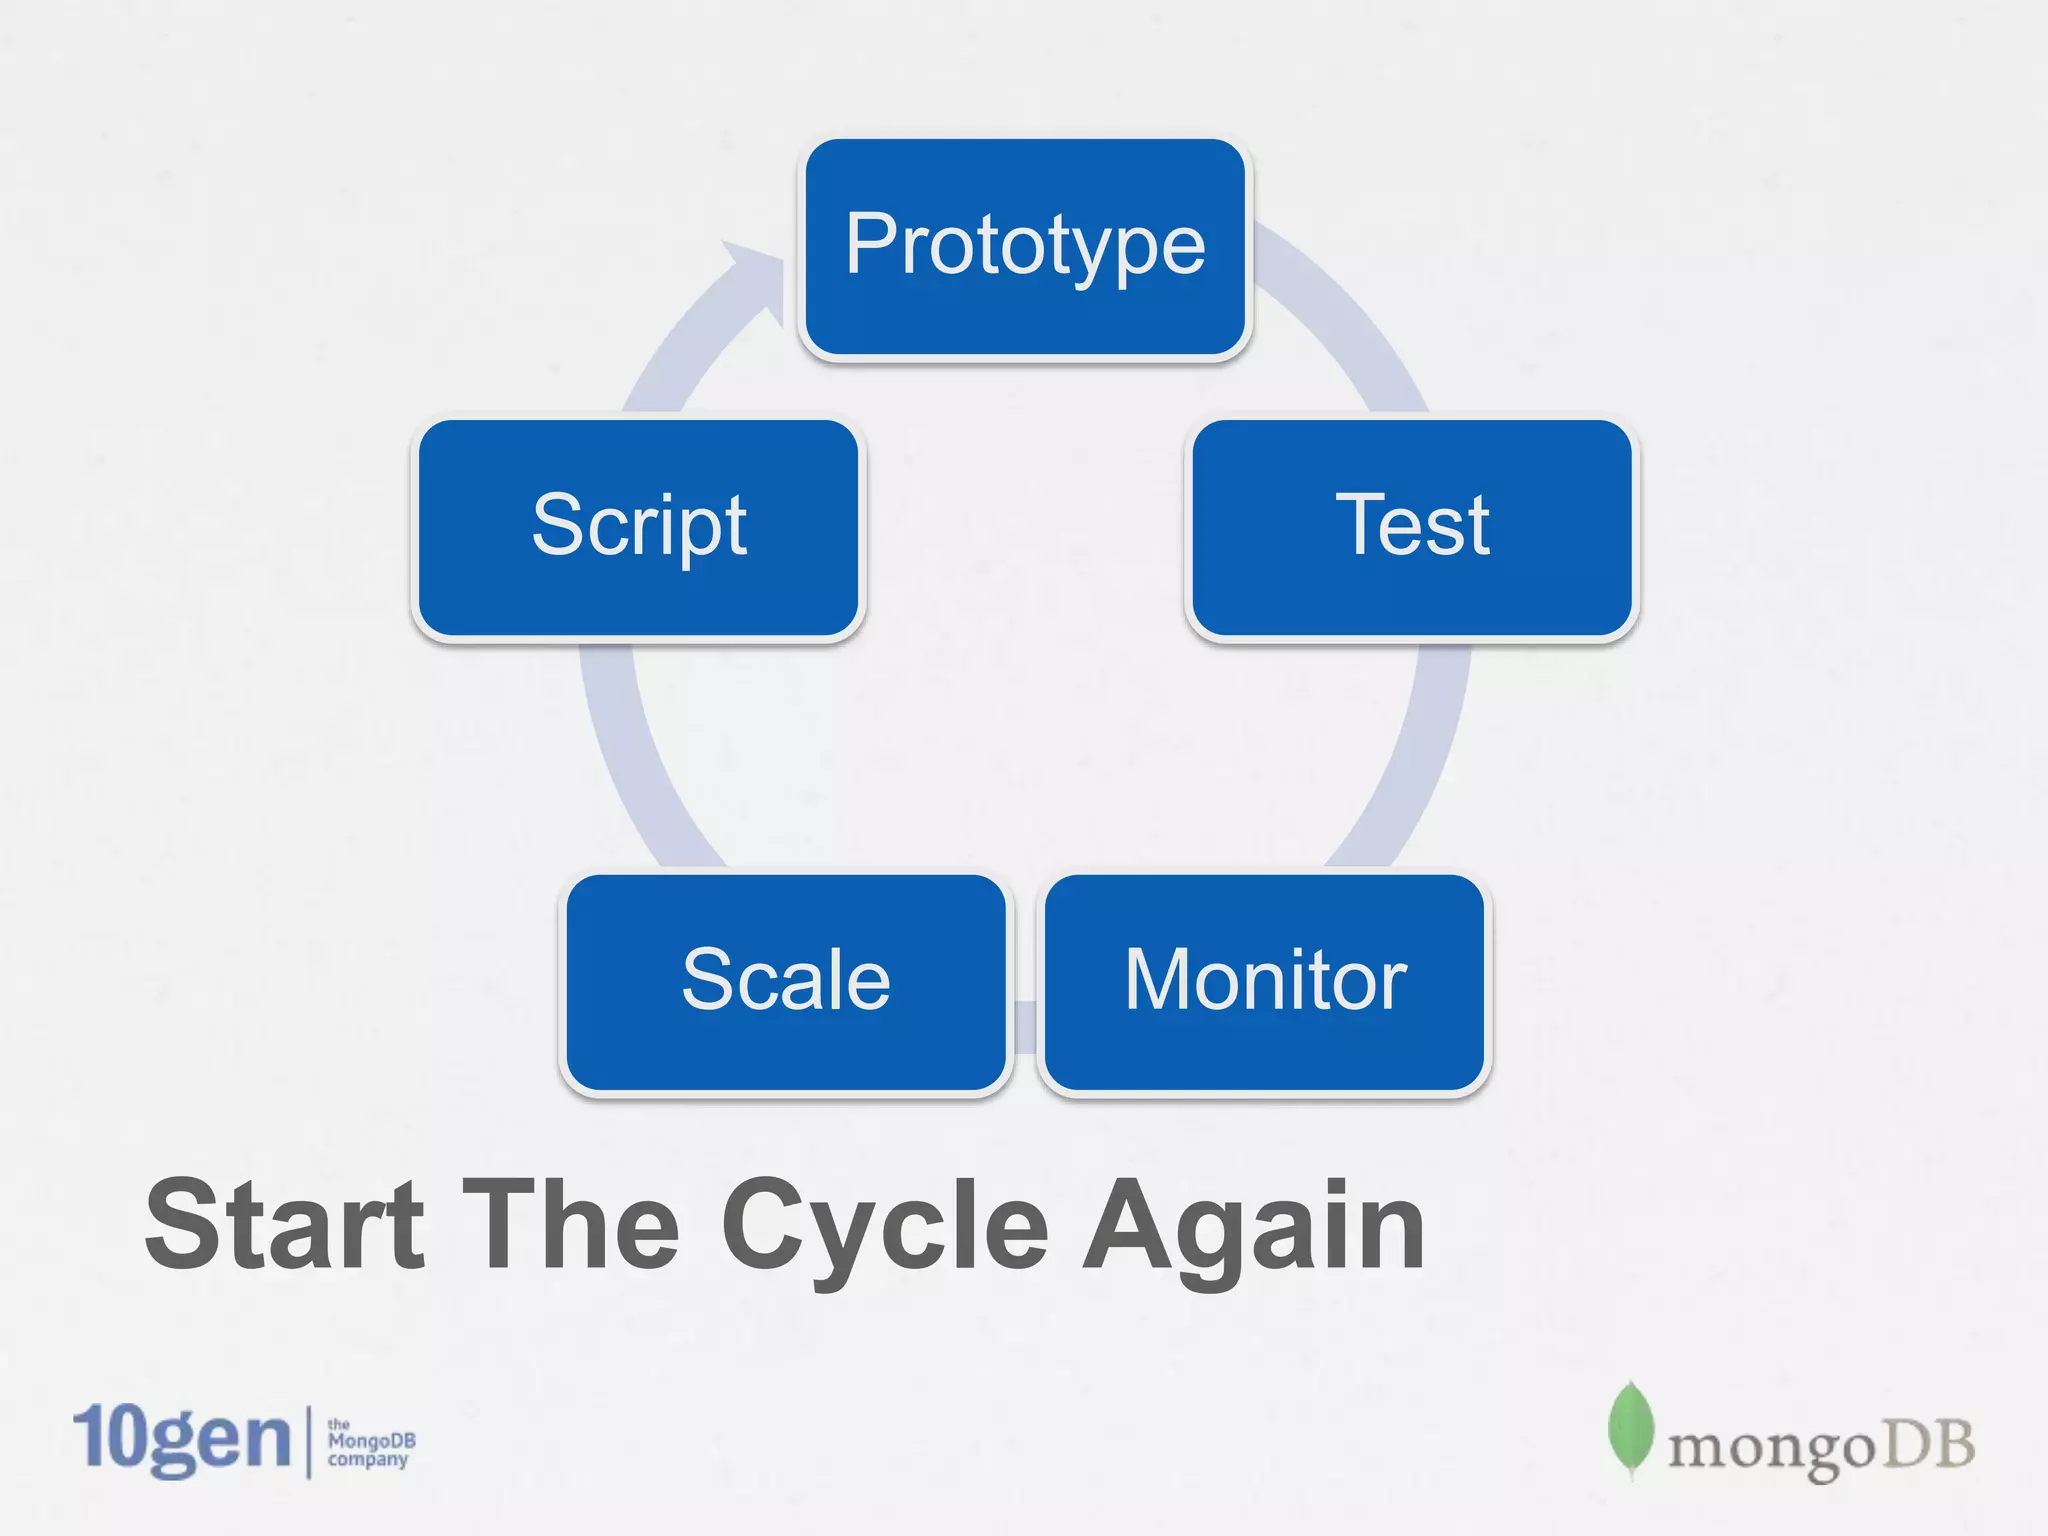
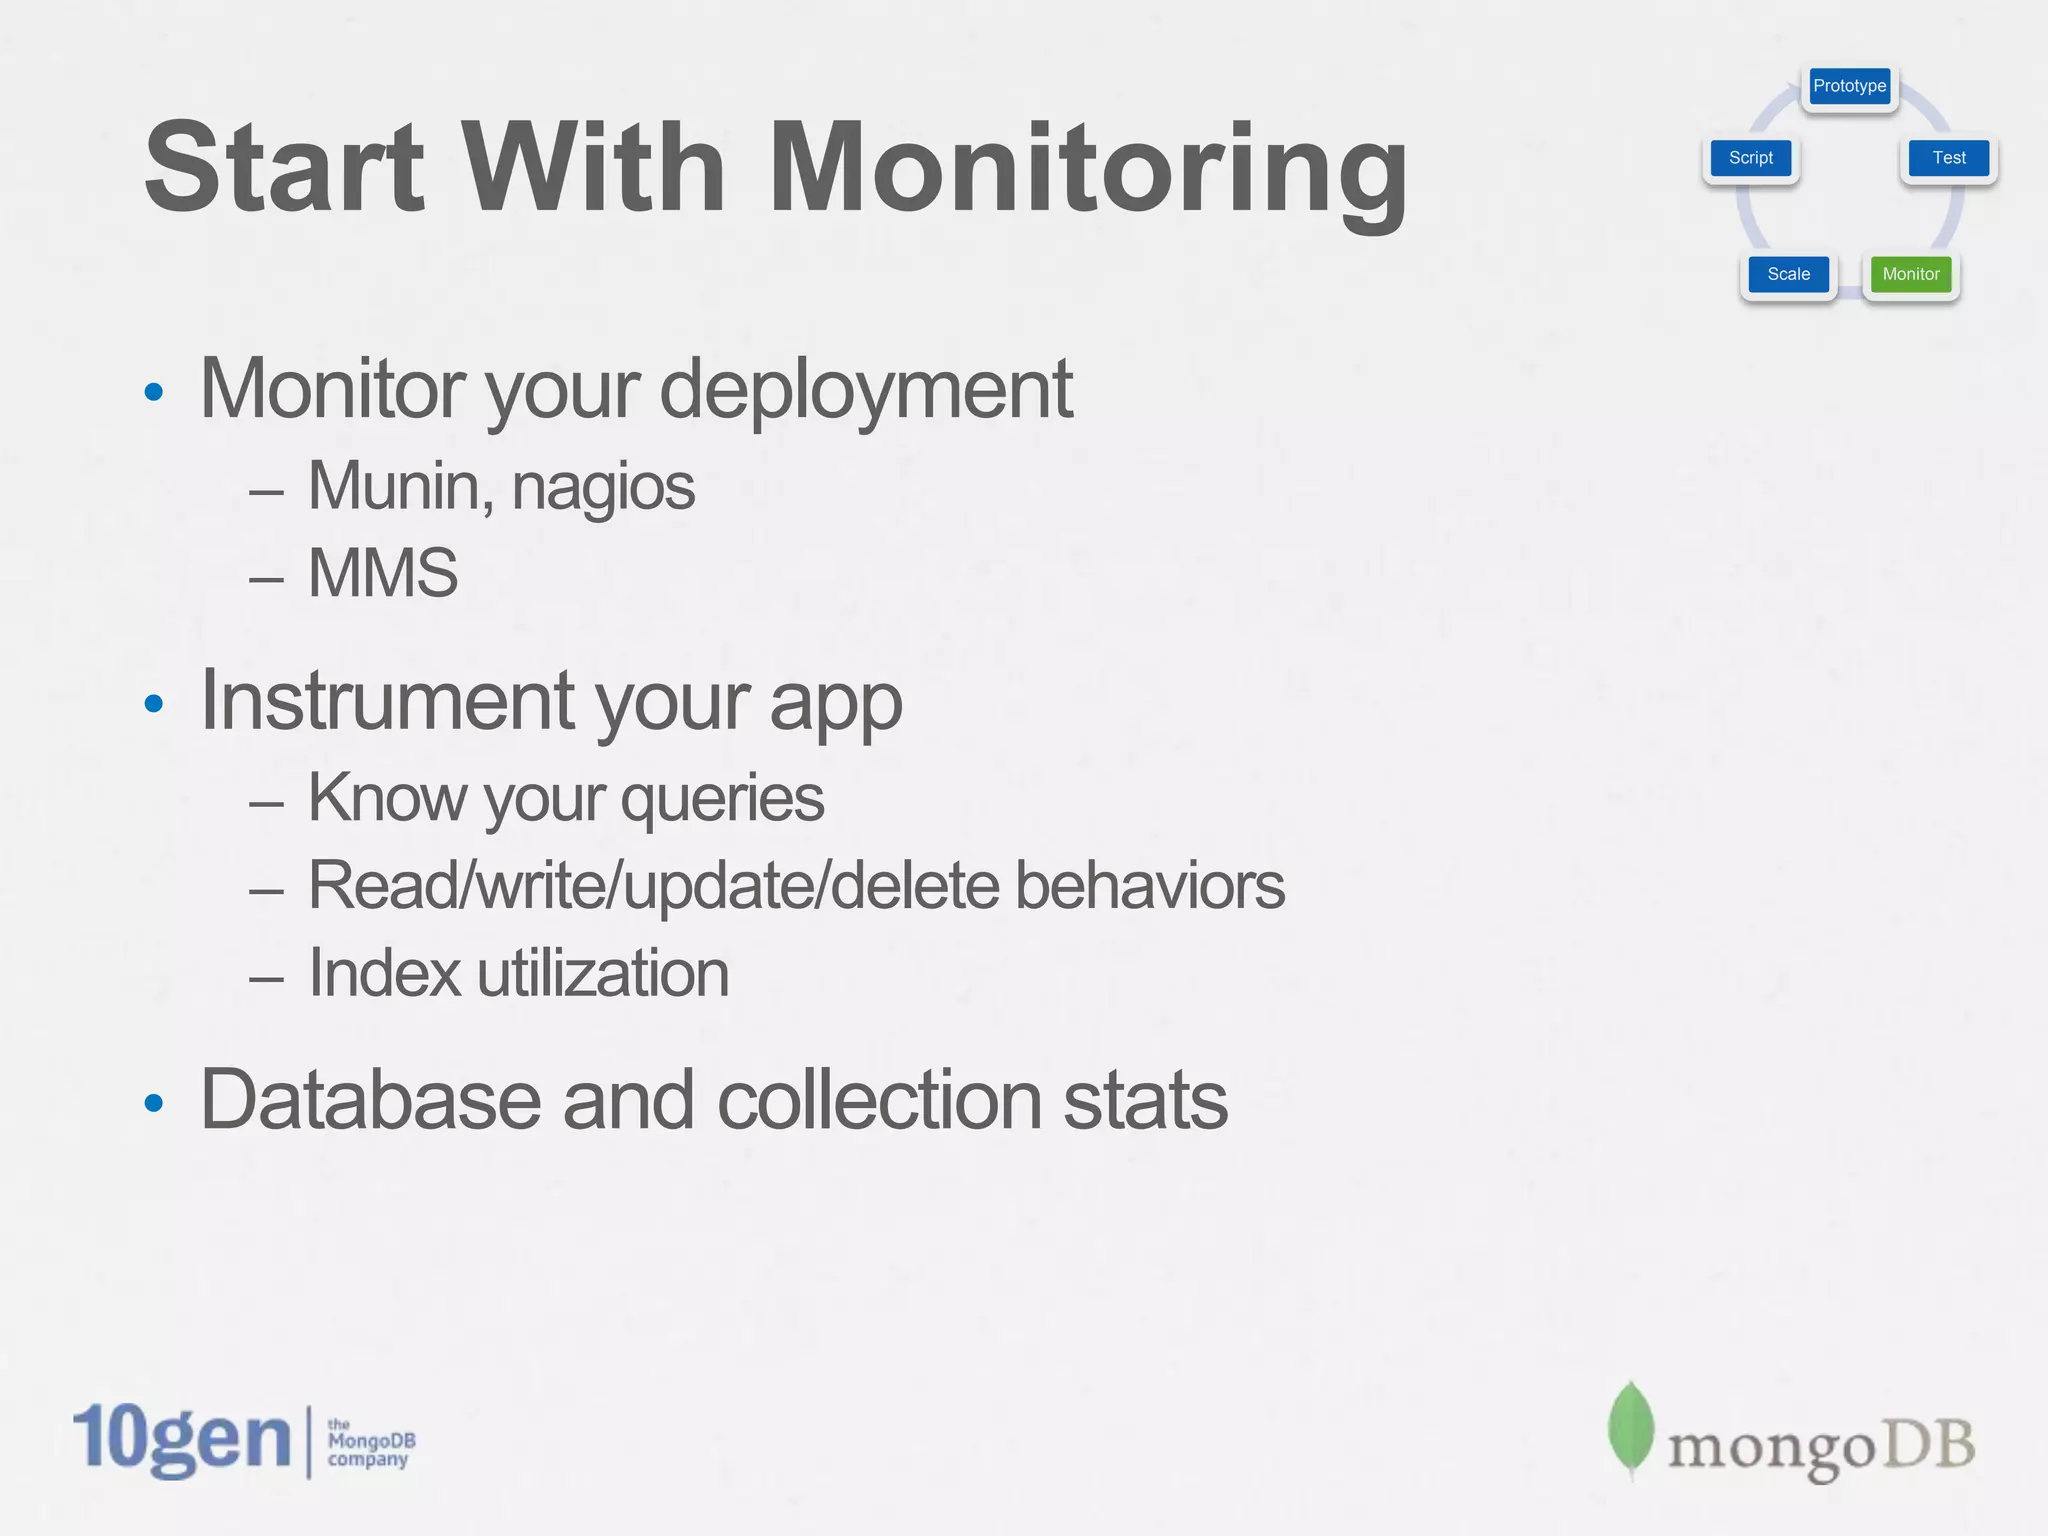
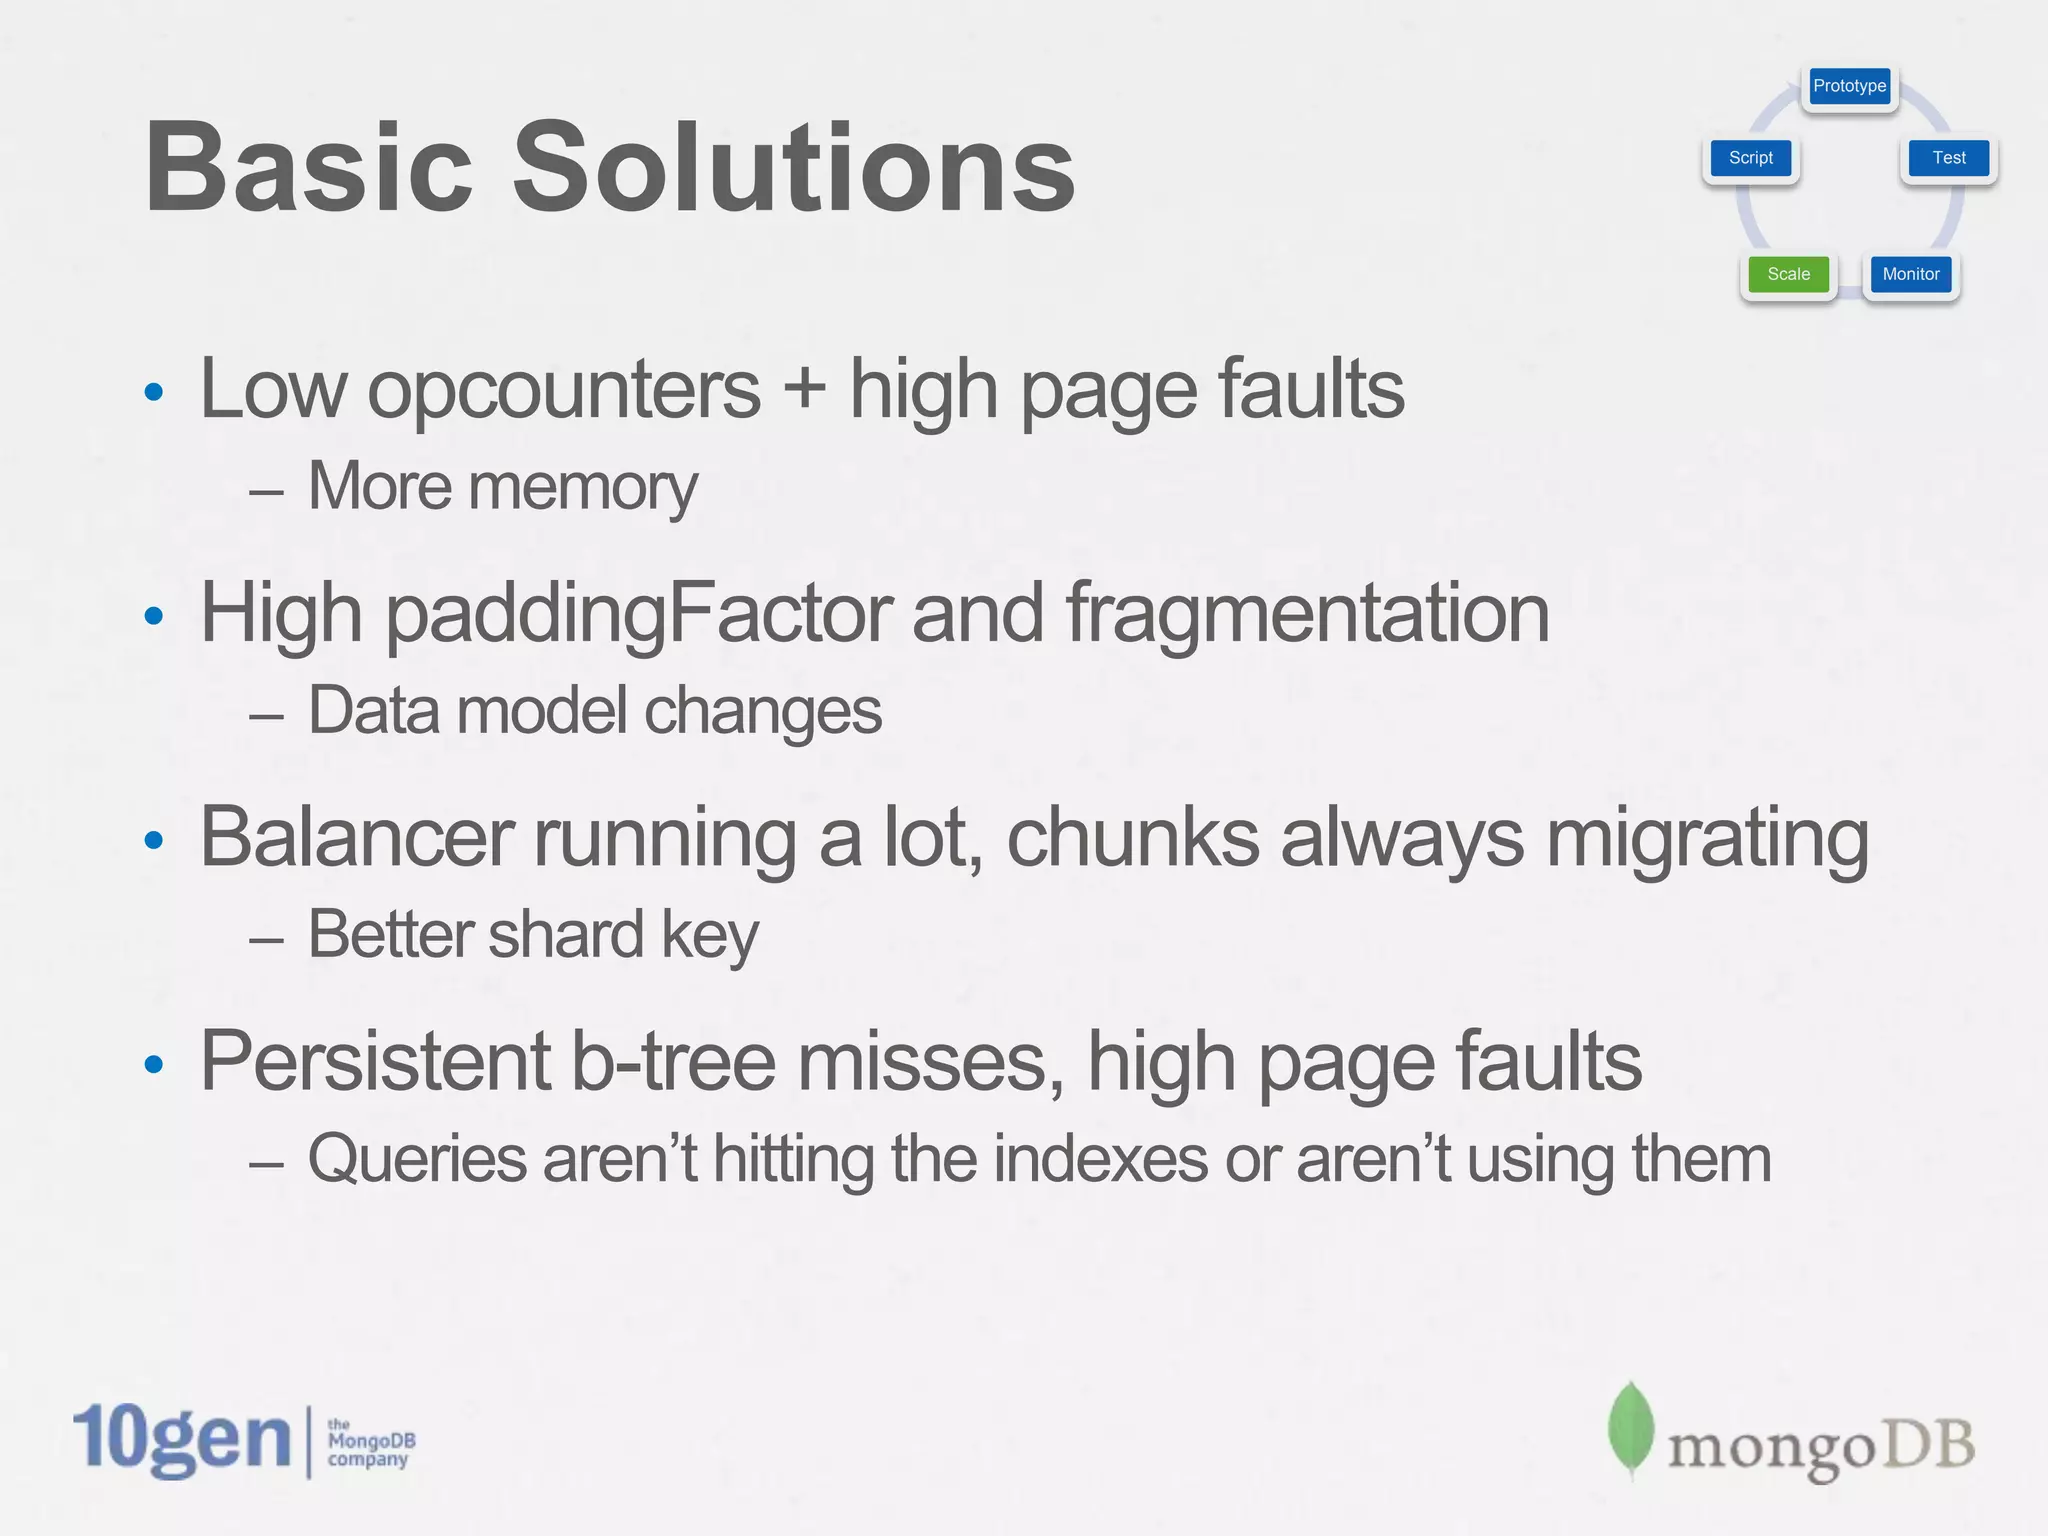
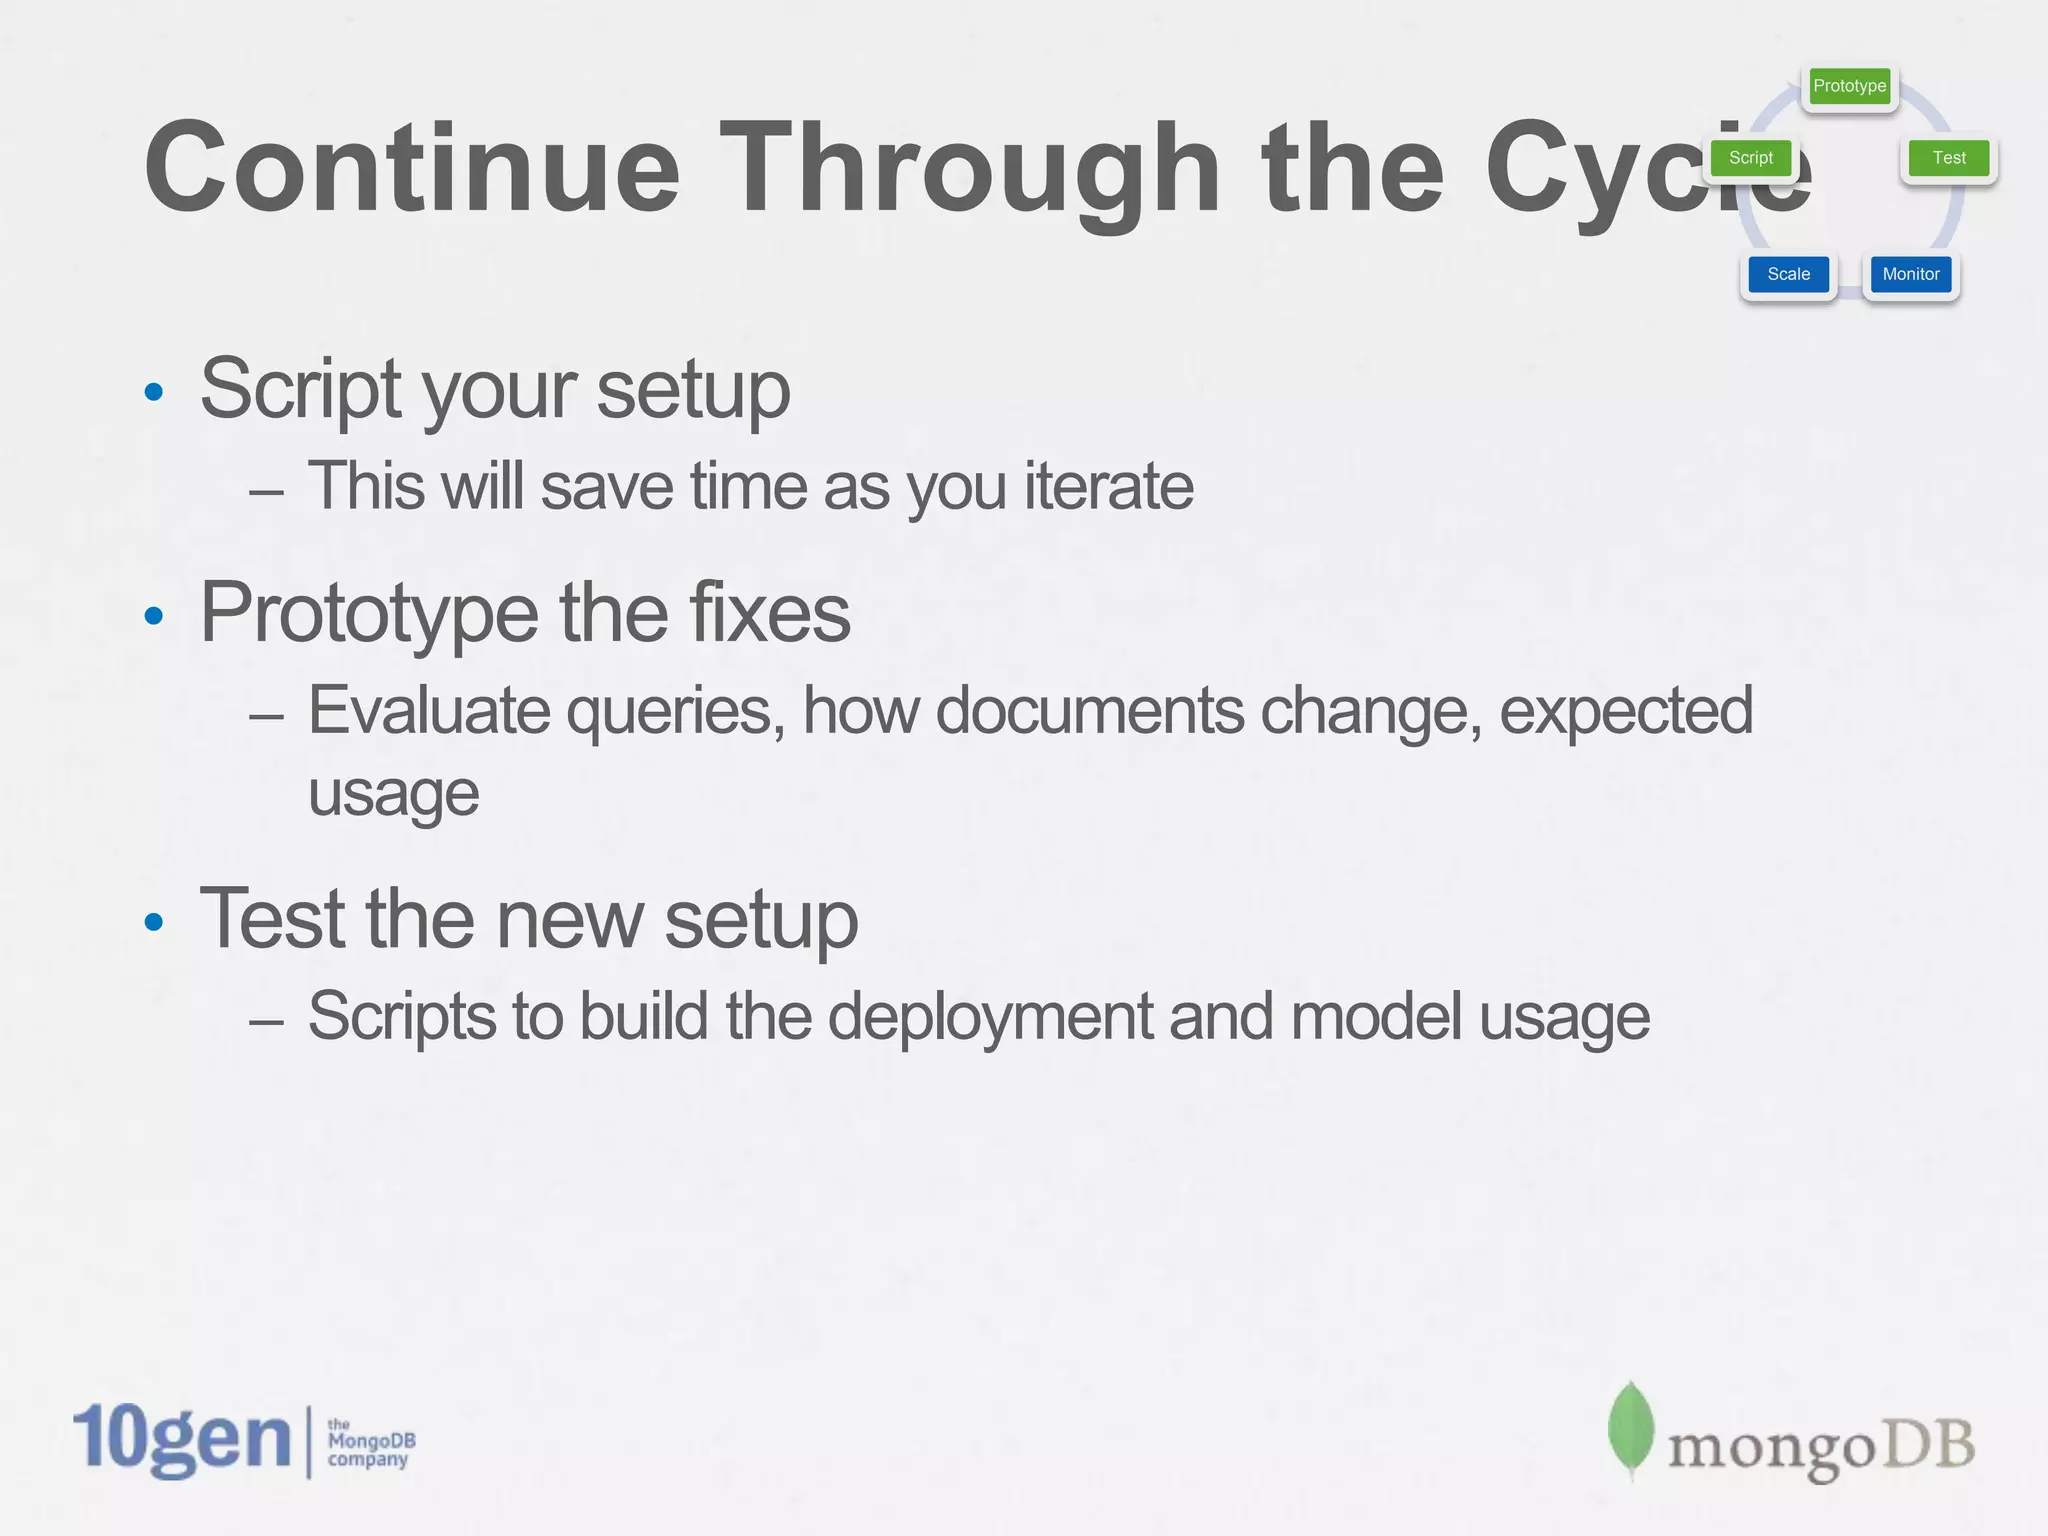
Deployment Best Practices
Sandeep Parikh
Solutions Architect, 10gen
Prototype


      Script               Test


          Scale      Monitor

The Cycle of Deployment Prep
Prototype


Prototype Your Deployment                        Script                     Test


                                                      Scale           Monitor


•  You have to start somewhere
•  Development is complete, deployment is next
•  Sketch out some initial deployment parameters
   ü Hardware sizing
   ü Operating system
   ü Disk setup
   ü Storage layout, data vs. journal vs. log
Prototype


Prototyping Considerations                                    Script                     Test


                                                                   Scale           Monitor


•  Additional considerations
   –  Horizontal vs. vertical scale options
   –  Multiple datacenters

•  Start thinking about data growth
   –  Do you know how your data will evolve?
   –  Does your data live in multiple collections/databases
   –  Read-centric, write-centric or both?

•  The more you start thinking about it, the better
Prototype


Test, Test, Test                                        Script                     Test


                                                             Scale           Monitor


•  Generate a lot of data
   –  Write tests to measure bulk loading throughput
   –  Scaffolding can be used for staging, validation

•  Build your indexes
   –  All in the beginning
   –  On the fly

•  Script your app
   –  Can you simulate “expected” usage?
Prototype


Monitor Your Resources                        Script                     Test


                                                   Scale           Monitor


•  Watch everything
•  The goal is to understand the numbers before
 deploying
•  Monitor using
   –  SNMP, munin, nagios
   –  mongostat, mongotop, iostat, cpustat
   –  MongoDB Monitoring Service (MMS)

•  Other stats
   –  Database, Collection level
Prototype


Monitoring Key Metrics                   Script                     Test


                                              Scale           Monitor


•  Op Counters
   –  Inserts, updates, deletes, reads
      (more is generally better)
   –  Some differences in primary
      vs. secondary ops

•  Resident memory
   –  Want this lower than
      available physical memory
   –  Correlated with page faults
      and index misses

•  Queues
   –  Readers and writers
Prototype


Monitoring Key Metrics                Script                     Test


                                           Scale           Monitor


•  Page faults and B-Tree
   –  How often are you having to
      hit the disk
   –  Persistently non-zero?
      Working set might not fit.

•  Lock Percentage
   –  If high and queues are filled,
     hitting write capacity

•  IO and CPU Stats
   –  IO Sustained or fluctuating
      => IO bound
   –  CPU hitting IOWAITs
Prototype


Scale Your Setup                           Script                     Test


                                                Scale           Monitor


•  Monitor those metrics while testing
•  Should tell you where to add capacity
   –  CPU, RAM, Disks

•  Storage configuration
   –  RAID levels
   –  Filesystem selection
   –  Block sizing
   –  Readahead setting
Prototype


Script Your Plays                                       Script                     Test


                                                             Scale           Monitor


•  Backups
•  Restores (backups are not enough)
•  Maintenance and Upgrades
•  Replica Set operations
   –  Stepping primaries down, adding new secondaries

•  Sharding operations
   –  Consistent backups, balancer operations
Prototype


       Script               Test


           Scale      Monitor

Lather, Rinse, Repeat
Perfect. I know what to do.
How Do I Do It?
Product     Infrastructure
        Development   Development


          Code

           QA         Monitoring

                      Operations
        Integration


Balancing Priorities
The Scale Tips To One Side
•  Product development is the priority
   –  As it should be, but…

•  Infrastructure development can’t be overlooked
•  Know the downsides of not being prepared
   –  Downtime
   –  Data safety

•  Disaster will strike in one way or another
Integrate With The Dev Cycle
•  Why are ops typically skipped over until it’s too
 late?
   –  Planning can alleviate this issue

•  Make operations development a part of the dev
 cycle
   –  Put it into the schedule
   –  Make it a development milestone

•  Use it to your advantage
   –  Script deployment of dev and test systems
That’s all well and good but
we are already deployed
Let’s Avoid This Situation
Prototype


       Script               Test


           Scale      Monitor

Start The Cycle Again
Prototype


Start With Monitoring                      Script                     Test


                                                Scale           Monitor


•  Monitor your deployment
   –  Munin, nagios
   –  MMS

•  Instrument your app
   –  Know your queries
   –  Read/write/update/delete behaviors
   –  Index utilization

•  Database and collection stats
Prototype


Scaling Deployment                                       Script                     Test


                                                              Scale           Monitor


•  The numbers don’t lie
   –  But individual measurements don’t always tell the whole
     story
•  Are you hardware bound?
   –  Memory, Disks, CPU

•  Is your app the problem?
•  What about system settings?
   –  Low Resident Memory > Readahead > Page Faults
Prototype


Basic Solutions                                             Script                     Test


                                                                 Scale           Monitor


•  Low opcounters + high page faults
   –  More memory

•  High paddingFactor and fragmentation
   –  Data model changes

•  Balancer running a lot, chunks always migrating
   –  Better shard key

•  Persistent b-tree misses, high page faults
   –  Queries aren’t hitting the indexes or aren’t using them
Prototype


Continue Through the Cycle                              Script                     Test


                                                             Scale           Monitor


•  Script your setup
   –  This will save time as you iterate

•  Prototype the fixes
   –  Evaluate queries, how documents change, expected usage

•  Test the new setup
   –  Scripts to build the deployment and model usage
Deployment is about
Not being surprised
Problem > Diagnosis > Solution
Problem 1: Streaming Events
•  Suboptimal write throughput
•  Where is the bottleneck?
   –  Check the metrics
Diagnosis 1
•  Are opcounters reasonably accurate?
•  Check the queues
•  Examine lock percentages
•  How does resident memory look?
•  How large are your indexes?
Solution 1
•  Opcounters aren’t as high as you’d expect but
 memory is saturated
•  Correlated with high page faults
•  You might need more memory
•  MongoDB wants to fit your working set into
 memory
Problem 2: Tracking FB Friends
•  Update-heavy workload is slow
•  Document paddingFactor is increasing
Diagnosis 2
•  High paddingFactor
   –  Fragmentation!

•  More memory/disk is taken up by new documents
   –  Inefficient space usage

•  Documents are having to be relocated regularly
Solution 2
•  Check your queries
   –  Are your documents growing because of arrays or added
     fields?
•  Pre-create required document structure or…
•  Kick growing elements individual objects in a
 separate collection
   –  Data model changes, app changes
Problem 3: Status Updates
•  Write-heavy sharded deployment
   –  Is one shard getting burned
   –  Balancer locked all the time

•  Balancer is constantly migrating chunks
Diagnosis 3
•  Check the mongos logs
   –  How often is migration occurring?
   –  Are chunks constantly moving from one shard to the next?

•  Shard key distribution
   –  Sequential keys?
   –  One shard always getting new writes?
Solution 3
•  Consider using hash, byte swapping, etc. if no
 “natural” key that distributes well
   –  Avoids the “hot” shard problem

•  High writes and high balancer lock
   –  Manage balancer window
   –  Run it during low utilization
Problem 4: File Sharing
•  Storing files in GridFS
•  Uploads are taking too long
Diagnosis 4
•  Check CPU and IO stats
•  Is the CPU stuck in IOWAITS?
•  High sustained IO operations
•  Lots of queued operations
•  IO bound workload
Solution 4
•  Ensure storage is in good health
   –  RAID status
   –  SAN or NAS devices functioning properly
   –  Virtualized disks

•  Consider separating data and journal
   –  --directoryperdb
   –  Symlink journal to another location

•  Ensure other processes aren’t hitting storage
Problem 5: Reading Logs
•  Indexes are underperforming
•  Queries are using indexes but yielding quite a bit
Diagnosis 5
•  Use .explain() and .hint() with your queries
•  Check out the b-tree metrics
   –  Persistent non-zero misses?
   –  Correlated with memory, page faults, IO stats

•  B-trees best for range queries over single
 dimension
   –  Range queries on {A} if index is {A,B} could be suboptimal
Solution 5
•  Revisit your indexing strategy
•  Consider data model changes to optimize queries
 and indexes
•  Some functionality doesn’t hit the index
   –  $where javascript clauses
   –  $mod, $not, $ne
   –  Complex regular expressions
Miscellaneous Deployment Notes
•  Warm the cache
   –  Use touch via db.runCommand()

•  Dynamically change log levels
•  Synchronize all clocks to the same NTP server
Questions?
How To Get Help
•  Refer to our docs: docs.mongodb.org
   –  (hint: they’re very helpful!)

•  Other things we monitor
   –  mongodb-user Google group
   –  Stack Overflow

•  Found a bug? Submit a ticket

Webinar: Deployment Best Practices

  • 1.
    Deployment Best Practices SandeepParikh Solutions Architect, 10gen
  • 2.
    Prototype Script Test Scale Monitor The Cycle of Deployment Prep
  • 3.
    Prototype Prototype Your Deployment Script Test Scale Monitor •  You have to start somewhere •  Development is complete, deployment is next •  Sketch out some initial deployment parameters ü Hardware sizing ü Operating system ü Disk setup ü Storage layout, data vs. journal vs. log
  • 4.
    Prototype Prototyping Considerations Script Test Scale Monitor •  Additional considerations –  Horizontal vs. vertical scale options –  Multiple datacenters •  Start thinking about data growth –  Do you know how your data will evolve? –  Does your data live in multiple collections/databases –  Read-centric, write-centric or both? •  The more you start thinking about it, the better
  • 5.
    Prototype Test, Test, Test Script Test Scale Monitor •  Generate a lot of data –  Write tests to measure bulk loading throughput –  Scaffolding can be used for staging, validation •  Build your indexes –  All in the beginning –  On the fly •  Script your app –  Can you simulate “expected” usage?
  • 6.
    Prototype Monitor Your Resources Script Test Scale Monitor •  Watch everything •  The goal is to understand the numbers before deploying •  Monitor using –  SNMP, munin, nagios –  mongostat, mongotop, iostat, cpustat –  MongoDB Monitoring Service (MMS) •  Other stats –  Database, Collection level
  • 7.
    Prototype Monitoring Key Metrics Script Test Scale Monitor •  Op Counters –  Inserts, updates, deletes, reads (more is generally better) –  Some differences in primary vs. secondary ops •  Resident memory –  Want this lower than available physical memory –  Correlated with page faults and index misses •  Queues –  Readers and writers
  • 8.
    Prototype Monitoring Key Metrics Script Test Scale Monitor •  Page faults and B-Tree –  How often are you having to hit the disk –  Persistently non-zero? Working set might not fit. •  Lock Percentage –  If high and queues are filled, hitting write capacity •  IO and CPU Stats –  IO Sustained or fluctuating => IO bound –  CPU hitting IOWAITs
  • 9.
    Prototype Scale Your Setup Script Test Scale Monitor •  Monitor those metrics while testing •  Should tell you where to add capacity –  CPU, RAM, Disks •  Storage configuration –  RAID levels –  Filesystem selection –  Block sizing –  Readahead setting
  • 10.
    Prototype Script Your Plays Script Test Scale Monitor •  Backups •  Restores (backups are not enough) •  Maintenance and Upgrades •  Replica Set operations –  Stepping primaries down, adding new secondaries •  Sharding operations –  Consistent backups, balancer operations
  • 11.
    Prototype Script Test Scale Monitor Lather, Rinse, Repeat
  • 12.
    Perfect. I knowwhat to do. How Do I Do It?
  • 13.
    Product Infrastructure Development Development Code QA Monitoring Operations Integration Balancing Priorities
  • 14.
    The Scale TipsTo One Side •  Product development is the priority –  As it should be, but… •  Infrastructure development can’t be overlooked •  Know the downsides of not being prepared –  Downtime –  Data safety •  Disaster will strike in one way or another
  • 15.
    Integrate With TheDev Cycle •  Why are ops typically skipped over until it’s too late? –  Planning can alleviate this issue •  Make operations development a part of the dev cycle –  Put it into the schedule –  Make it a development milestone •  Use it to your advantage –  Script deployment of dev and test systems
  • 16.
    That’s all welland good but we are already deployed
  • 17.
  • 18.
    Prototype Script Test Scale Monitor Start The Cycle Again
  • 19.
    Prototype Start With Monitoring Script Test Scale Monitor •  Monitor your deployment –  Munin, nagios –  MMS •  Instrument your app –  Know your queries –  Read/write/update/delete behaviors –  Index utilization •  Database and collection stats
  • 20.
    Prototype Scaling Deployment Script Test Scale Monitor •  The numbers don’t lie –  But individual measurements don’t always tell the whole story •  Are you hardware bound? –  Memory, Disks, CPU •  Is your app the problem? •  What about system settings? –  Low Resident Memory > Readahead > Page Faults
  • 21.
    Prototype Basic Solutions Script Test Scale Monitor •  Low opcounters + high page faults –  More memory •  High paddingFactor and fragmentation –  Data model changes •  Balancer running a lot, chunks always migrating –  Better shard key •  Persistent b-tree misses, high page faults –  Queries aren’t hitting the indexes or aren’t using them
  • 22.
    Prototype Continue Through theCycle Script Test Scale Monitor •  Script your setup –  This will save time as you iterate •  Prototype the fixes –  Evaluate queries, how documents change, expected usage •  Test the new setup –  Scripts to build the deployment and model usage
  • 23.
    Deployment is about Notbeing surprised
  • 24.
  • 25.
    Problem 1: StreamingEvents •  Suboptimal write throughput •  Where is the bottleneck? –  Check the metrics
  • 26.
    Diagnosis 1 •  Areopcounters reasonably accurate? •  Check the queues •  Examine lock percentages •  How does resident memory look? •  How large are your indexes?
  • 27.
    Solution 1 •  Opcountersaren’t as high as you’d expect but memory is saturated •  Correlated with high page faults •  You might need more memory •  MongoDB wants to fit your working set into memory
  • 28.
    Problem 2: TrackingFB Friends •  Update-heavy workload is slow •  Document paddingFactor is increasing
  • 29.
    Diagnosis 2 •  HighpaddingFactor –  Fragmentation! •  More memory/disk is taken up by new documents –  Inefficient space usage •  Documents are having to be relocated regularly
  • 30.
    Solution 2 •  Checkyour queries –  Are your documents growing because of arrays or added fields? •  Pre-create required document structure or… •  Kick growing elements individual objects in a separate collection –  Data model changes, app changes
  • 31.
    Problem 3: StatusUpdates •  Write-heavy sharded deployment –  Is one shard getting burned –  Balancer locked all the time •  Balancer is constantly migrating chunks
  • 32.
    Diagnosis 3 •  Checkthe mongos logs –  How often is migration occurring? –  Are chunks constantly moving from one shard to the next? •  Shard key distribution –  Sequential keys? –  One shard always getting new writes?
  • 33.
    Solution 3 •  Considerusing hash, byte swapping, etc. if no “natural” key that distributes well –  Avoids the “hot” shard problem •  High writes and high balancer lock –  Manage balancer window –  Run it during low utilization
  • 34.
    Problem 4: FileSharing •  Storing files in GridFS •  Uploads are taking too long
  • 35.
    Diagnosis 4 •  CheckCPU and IO stats •  Is the CPU stuck in IOWAITS? •  High sustained IO operations •  Lots of queued operations •  IO bound workload
  • 36.
    Solution 4 •  Ensurestorage is in good health –  RAID status –  SAN or NAS devices functioning properly –  Virtualized disks •  Consider separating data and journal –  --directoryperdb –  Symlink journal to another location •  Ensure other processes aren’t hitting storage
  • 37.
    Problem 5: ReadingLogs •  Indexes are underperforming •  Queries are using indexes but yielding quite a bit
  • 38.
    Diagnosis 5 •  Use.explain() and .hint() with your queries •  Check out the b-tree metrics –  Persistent non-zero misses? –  Correlated with memory, page faults, IO stats •  B-trees best for range queries over single dimension –  Range queries on {A} if index is {A,B} could be suboptimal
  • 39.
    Solution 5 •  Revisityour indexing strategy •  Consider data model changes to optimize queries and indexes •  Some functionality doesn’t hit the index –  $where javascript clauses –  $mod, $not, $ne –  Complex regular expressions
  • 40.
    Miscellaneous Deployment Notes • Warm the cache –  Use touch via db.runCommand() •  Dynamically change log levels •  Synchronize all clocks to the same NTP server
  • 41.
  • 42.
    How To GetHelp •  Refer to our docs: docs.mongodb.org –  (hint: they’re very helpful!) •  Other things we monitor –  mongodb-user Google group –  Stack Overflow •  Found a bug? Submit a ticket