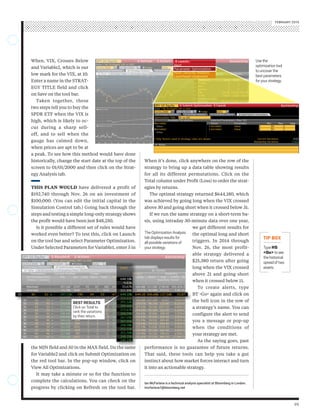
STRATEGIES EQUITIES
98
WALL STREET’S FEAR gauge was all but dead last
summer, dropping to a seven-year low in early July.
By October, the VIX Index had tripled as shares
tumbled on fears of Ebola and sectarian violence
in the Middle East.
The Chicago Board Options Exchange Volatility
Index, as the gauge is formally known, rises when
U.S. stocks fall, and it topped out at 31.06 on Oct. 15,
a three-year high. The number translates to an an-
nualized percentage point change in the Standard
& Poor’s 500 Index during the next 30-day period.
THE HIGHEST VIX readings occur when inves-
tors anticipate huge moves, either up or down, in
equities. Its peak during the past decade was 89.53
on Oct. 24, 2008, a month after Lehman Brothers
Holdings Inc. filed for bankruptcy.
Elevated readings usually occur after a market
selloff, while low levels are typically seen amid
a rally. Investors can use the VIX to analyze the
trading history of stocks and come up with buy
and sell triggers. A hypothetical long-and-short
strategy derived by backtesting and optimization
tools on the Bloomberg Professional service de-
livered a profit of 193 percent from Jan 1, 2000,
to Nov. 26 versus a 48 percent return with a buy-
and-hold approach.
To demonstrate this, first type BT <Go> for the
Advanced Backtesting & Optimization function
and click on New Strategy on the red tool bar. On
the next screen, enter SPY in the security field in
the upper-left corner of the screen and select the
first option in the list
that appears: the SPDR
S&P 500 ETF Trust,
the largest exchange-
traded fund tracking
the benchmark index.
Click on Add Se-
curity/Datafield
and then on the
box to the left of
Use Additional Se-
curity so that a check
mark appears. Enter
VIX in the SECURITY
field and select the first option in the list that ap-
pears. Enter VIX in the NAME field. In the FIELD
field, enter LAST and select Last Price from the list
that appears. Then click on Update.
Now, let’s create some parameters for the VIX.
Click on Add Variable. In the pop-up screen, enter
40 in the VALUE field and then click on Update.
Go through the same steps to add another variable
with a value of 10. We’ll create the trading strategy
by defining our rules. Click on Add Rule in the cen-
ter left of the screen. Click on the first arrow under
Action and select Cover and Go Long. Select When
under Qualifier, if it isn’t already selected. Click on
the arrow to the right of When and select VIX. Un-
der Condition, select Crosses Above. Click on the
arrow to the right and select Variable1, which rep-
resents our high threshold of the VIX, at 40.
Click on the second arrow below Action and se-
lect Close and Go Short. Going left to right, select
Trading the
Fear Index
TypeVCA
<Go> fordata
onvolatilityand
correlation.
TypeBT <Go> totesttrading
strategiesforassetssuchas
theSPDRS&P500ETFTrust.
BY IAN McFARLANE
99
Ian McFarlane is a technical analysis specialist at Bloomberg in London.
Imcfarlane1@bloomberg.net
When it’s done, click anywhere on the row of the
strategy to bring up a data table showing results
for all its different permutations. Click on the
Total column under Profit (Loss) to order the strat-
egies by returns.
The optimal strategy returned $644,180, which
was achieved by going long when the VIX crossed
above 30 and going short when it crossed below 31.
If we run the same strategy on a short-term ba-
sis, using intraday 30-minute data over one year,
we get different results for
the optimal long and short
triggers. In 2014 through
Nov. 26, the most profit-
able strategy delivered a
$25,380 return after going
long when the VIX crossed
above 21 and going short
when it crossed below 11.
To create alerts, type
BT <Go> again and click on
the bell icon in the row of
a strategy’s name. You can
configure the alert to send
you a message or pop-up
when the conditions of
your strategy are met.
As the saying goes, past
performance is no guarantee of future returns.
That said, these tools can help you take a gut
instinct about how market forces interact and turn
it into an actionable strategy.
When, VIX, Crosses Below
and Variable2, which is our
low mark for the VIX, at 10.
Enter a name in the STRAT-
EGY TITLE field and click
on Save on the tool bar.
Taken together, these
two steps tell you to buy the
SPDR ETF when the VIX is
high, which is likely to oc-
cur during a sharp sell-
off, and to sell when the
gauge has calmed down,
when prices are apt to be at
a peak. To see how this method would have done
historically, change the start date at the top of the
screen to 01/01/2000 and then click on the Strat-
egy Analysis tab.
THIS PLAN WOULD have delivered a profit of
$192,740 through Nov. 26 on an investment of
$100,000. (You can edit the initial capital in the
Simulation Control tab.) Going back through the
steps and testing a simple long-only strategy shows
the profit would have been just $48,250.
Is it possible a different set of rules would have
worked even better? To test this, click on Launch
on the tool bar and select Parameter Optimization.
Under Selected Parameters for Variable1, enter 5 in
the MIN field and 50 in the MAX field. Do the same
for Variable2 and click on Submit Optimization on
the red tool bar. In the pop-up window, click on
View All Optimizations.
It may take a minute or so for the function to
complete the calculations. You can check on the
progress by clicking on Refresh on the tool bar.
TheOptimizationAnalysis
tabdisplaysresultsfor
allpossiblevariationsof
yourstrategy. TypeHS
<Go> tosee
thehistorical
spreadoftwo
assets.
FEBRUARY 2015
BEST RESULTS
Click on Total to
rank the variations
by their return.
Usethe
optimizationtool
touncoverthe
bestparameters
foryourstrategy.

VIX Trading Strategy

  • 1.
    STRATEGIES EQUITIES 98 WALL STREET’SFEAR gauge was all but dead last summer, dropping to a seven-year low in early July. By October, the VIX Index had tripled as shares tumbled on fears of Ebola and sectarian violence in the Middle East. The Chicago Board Options Exchange Volatility Index, as the gauge is formally known, rises when U.S. stocks fall, and it topped out at 31.06 on Oct. 15, a three-year high. The number translates to an an- nualized percentage point change in the Standard & Poor’s 500 Index during the next 30-day period. THE HIGHEST VIX readings occur when inves- tors anticipate huge moves, either up or down, in equities. Its peak during the past decade was 89.53 on Oct. 24, 2008, a month after Lehman Brothers Holdings Inc. filed for bankruptcy. Elevated readings usually occur after a market selloff, while low levels are typically seen amid a rally. Investors can use the VIX to analyze the trading history of stocks and come up with buy and sell triggers. A hypothetical long-and-short strategy derived by backtesting and optimization tools on the Bloomberg Professional service de- livered a profit of 193 percent from Jan 1, 2000, to Nov. 26 versus a 48 percent return with a buy- and-hold approach. To demonstrate this, first type BT <Go> for the Advanced Backtesting & Optimization function and click on New Strategy on the red tool bar. On the next screen, enter SPY in the security field in the upper-left corner of the screen and select the first option in the list that appears: the SPDR S&P 500 ETF Trust, the largest exchange- traded fund tracking the benchmark index. Click on Add Se- curity/Datafield and then on the box to the left of Use Additional Se- curity so that a check mark appears. Enter VIX in the SECURITY field and select the first option in the list that ap- pears. Enter VIX in the NAME field. In the FIELD field, enter LAST and select Last Price from the list that appears. Then click on Update. Now, let’s create some parameters for the VIX. Click on Add Variable. In the pop-up screen, enter 40 in the VALUE field and then click on Update. Go through the same steps to add another variable with a value of 10. We’ll create the trading strategy by defining our rules. Click on Add Rule in the cen- ter left of the screen. Click on the first arrow under Action and select Cover and Go Long. Select When under Qualifier, if it isn’t already selected. Click on the arrow to the right of When and select VIX. Un- der Condition, select Crosses Above. Click on the arrow to the right and select Variable1, which rep- resents our high threshold of the VIX, at 40. Click on the second arrow below Action and se- lect Close and Go Short. Going left to right, select Trading the Fear Index TypeVCA <Go> fordata onvolatilityand correlation. TypeBT <Go> totesttrading strategiesforassetssuchas theSPDRS&P500ETFTrust. BY IAN McFARLANE
  • 2.
    99 Ian McFarlane isa technical analysis specialist at Bloomberg in London. Imcfarlane1@bloomberg.net When it’s done, click anywhere on the row of the strategy to bring up a data table showing results for all its different permutations. Click on the Total column under Profit (Loss) to order the strat- egies by returns. The optimal strategy returned $644,180, which was achieved by going long when the VIX crossed above 30 and going short when it crossed below 31. If we run the same strategy on a short-term ba- sis, using intraday 30-minute data over one year, we get different results for the optimal long and short triggers. In 2014 through Nov. 26, the most profit- able strategy delivered a $25,380 return after going long when the VIX crossed above 21 and going short when it crossed below 11. To create alerts, type BT <Go> again and click on the bell icon in the row of a strategy’s name. You can configure the alert to send you a message or pop-up when the conditions of your strategy are met. As the saying goes, past performance is no guarantee of future returns. That said, these tools can help you take a gut instinct about how market forces interact and turn it into an actionable strategy. When, VIX, Crosses Below and Variable2, which is our low mark for the VIX, at 10. Enter a name in the STRAT- EGY TITLE field and click on Save on the tool bar. Taken together, these two steps tell you to buy the SPDR ETF when the VIX is high, which is likely to oc- cur during a sharp sell- off, and to sell when the gauge has calmed down, when prices are apt to be at a peak. To see how this method would have done historically, change the start date at the top of the screen to 01/01/2000 and then click on the Strat- egy Analysis tab. THIS PLAN WOULD have delivered a profit of $192,740 through Nov. 26 on an investment of $100,000. (You can edit the initial capital in the Simulation Control tab.) Going back through the steps and testing a simple long-only strategy shows the profit would have been just $48,250. Is it possible a different set of rules would have worked even better? To test this, click on Launch on the tool bar and select Parameter Optimization. Under Selected Parameters for Variable1, enter 5 in the MIN field and 50 in the MAX field. Do the same for Variable2 and click on Submit Optimization on the red tool bar. In the pop-up window, click on View All Optimizations. It may take a minute or so for the function to complete the calculations. You can check on the progress by clicking on Refresh on the tool bar. TheOptimizationAnalysis tabdisplaysresultsfor allpossiblevariationsof yourstrategy. TypeHS <Go> tosee thehistorical spreadoftwo assets. FEBRUARY 2015 BEST RESULTS Click on Total to rank the variations by their return. Usethe optimizationtool touncoverthe bestparameters foryourstrategy.