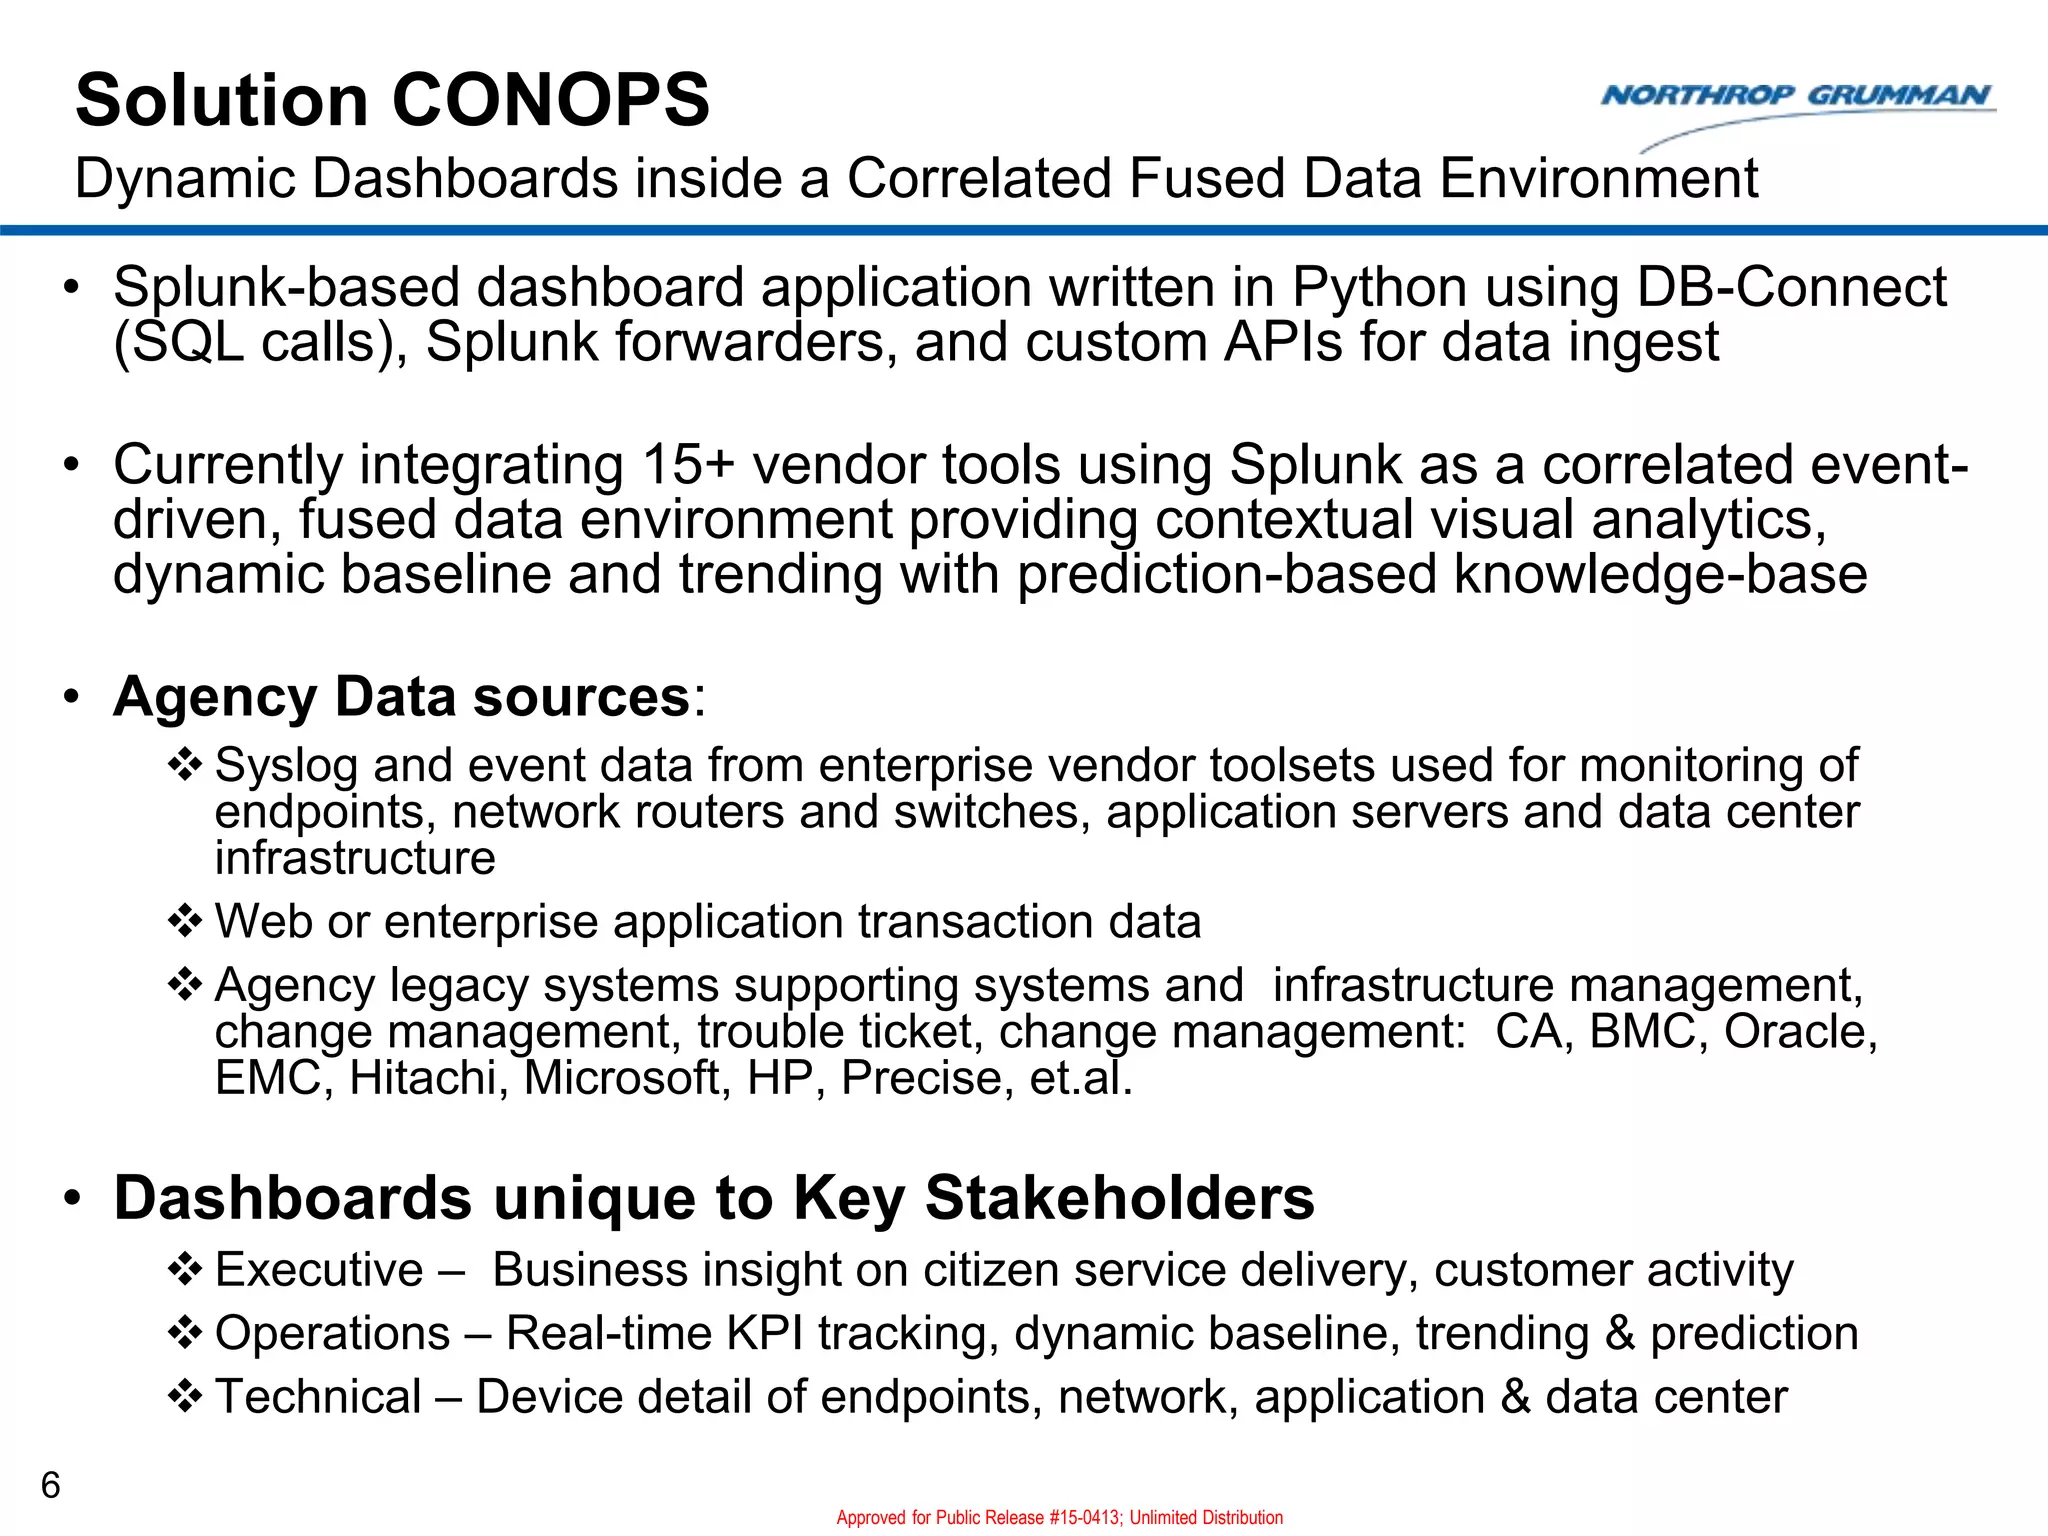
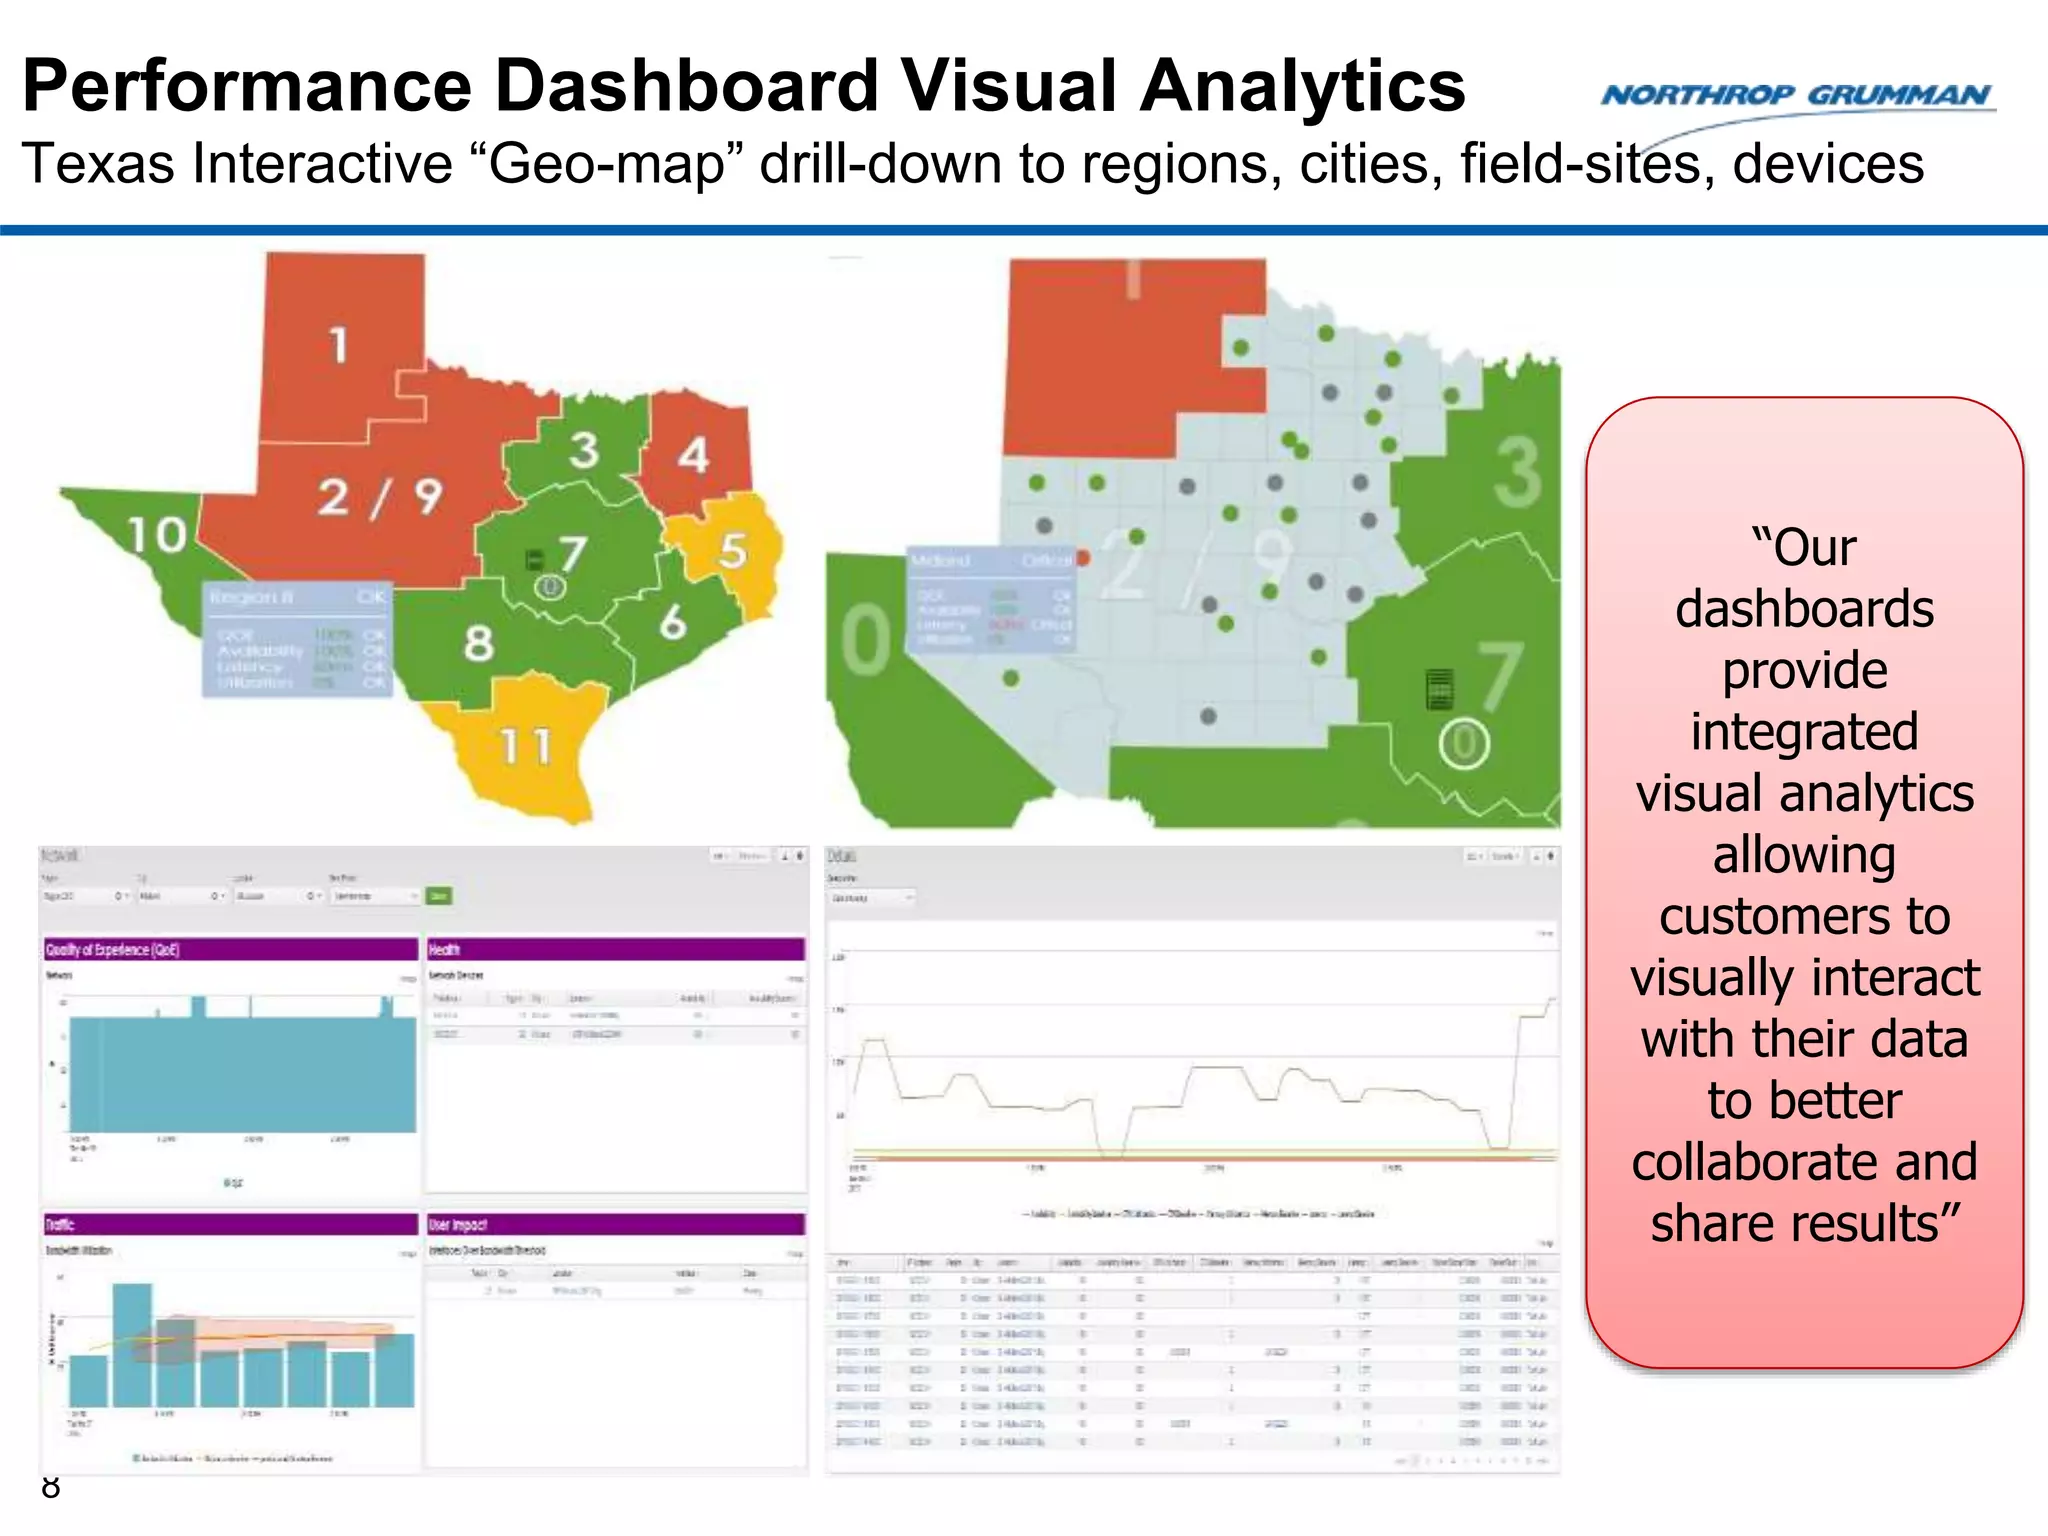
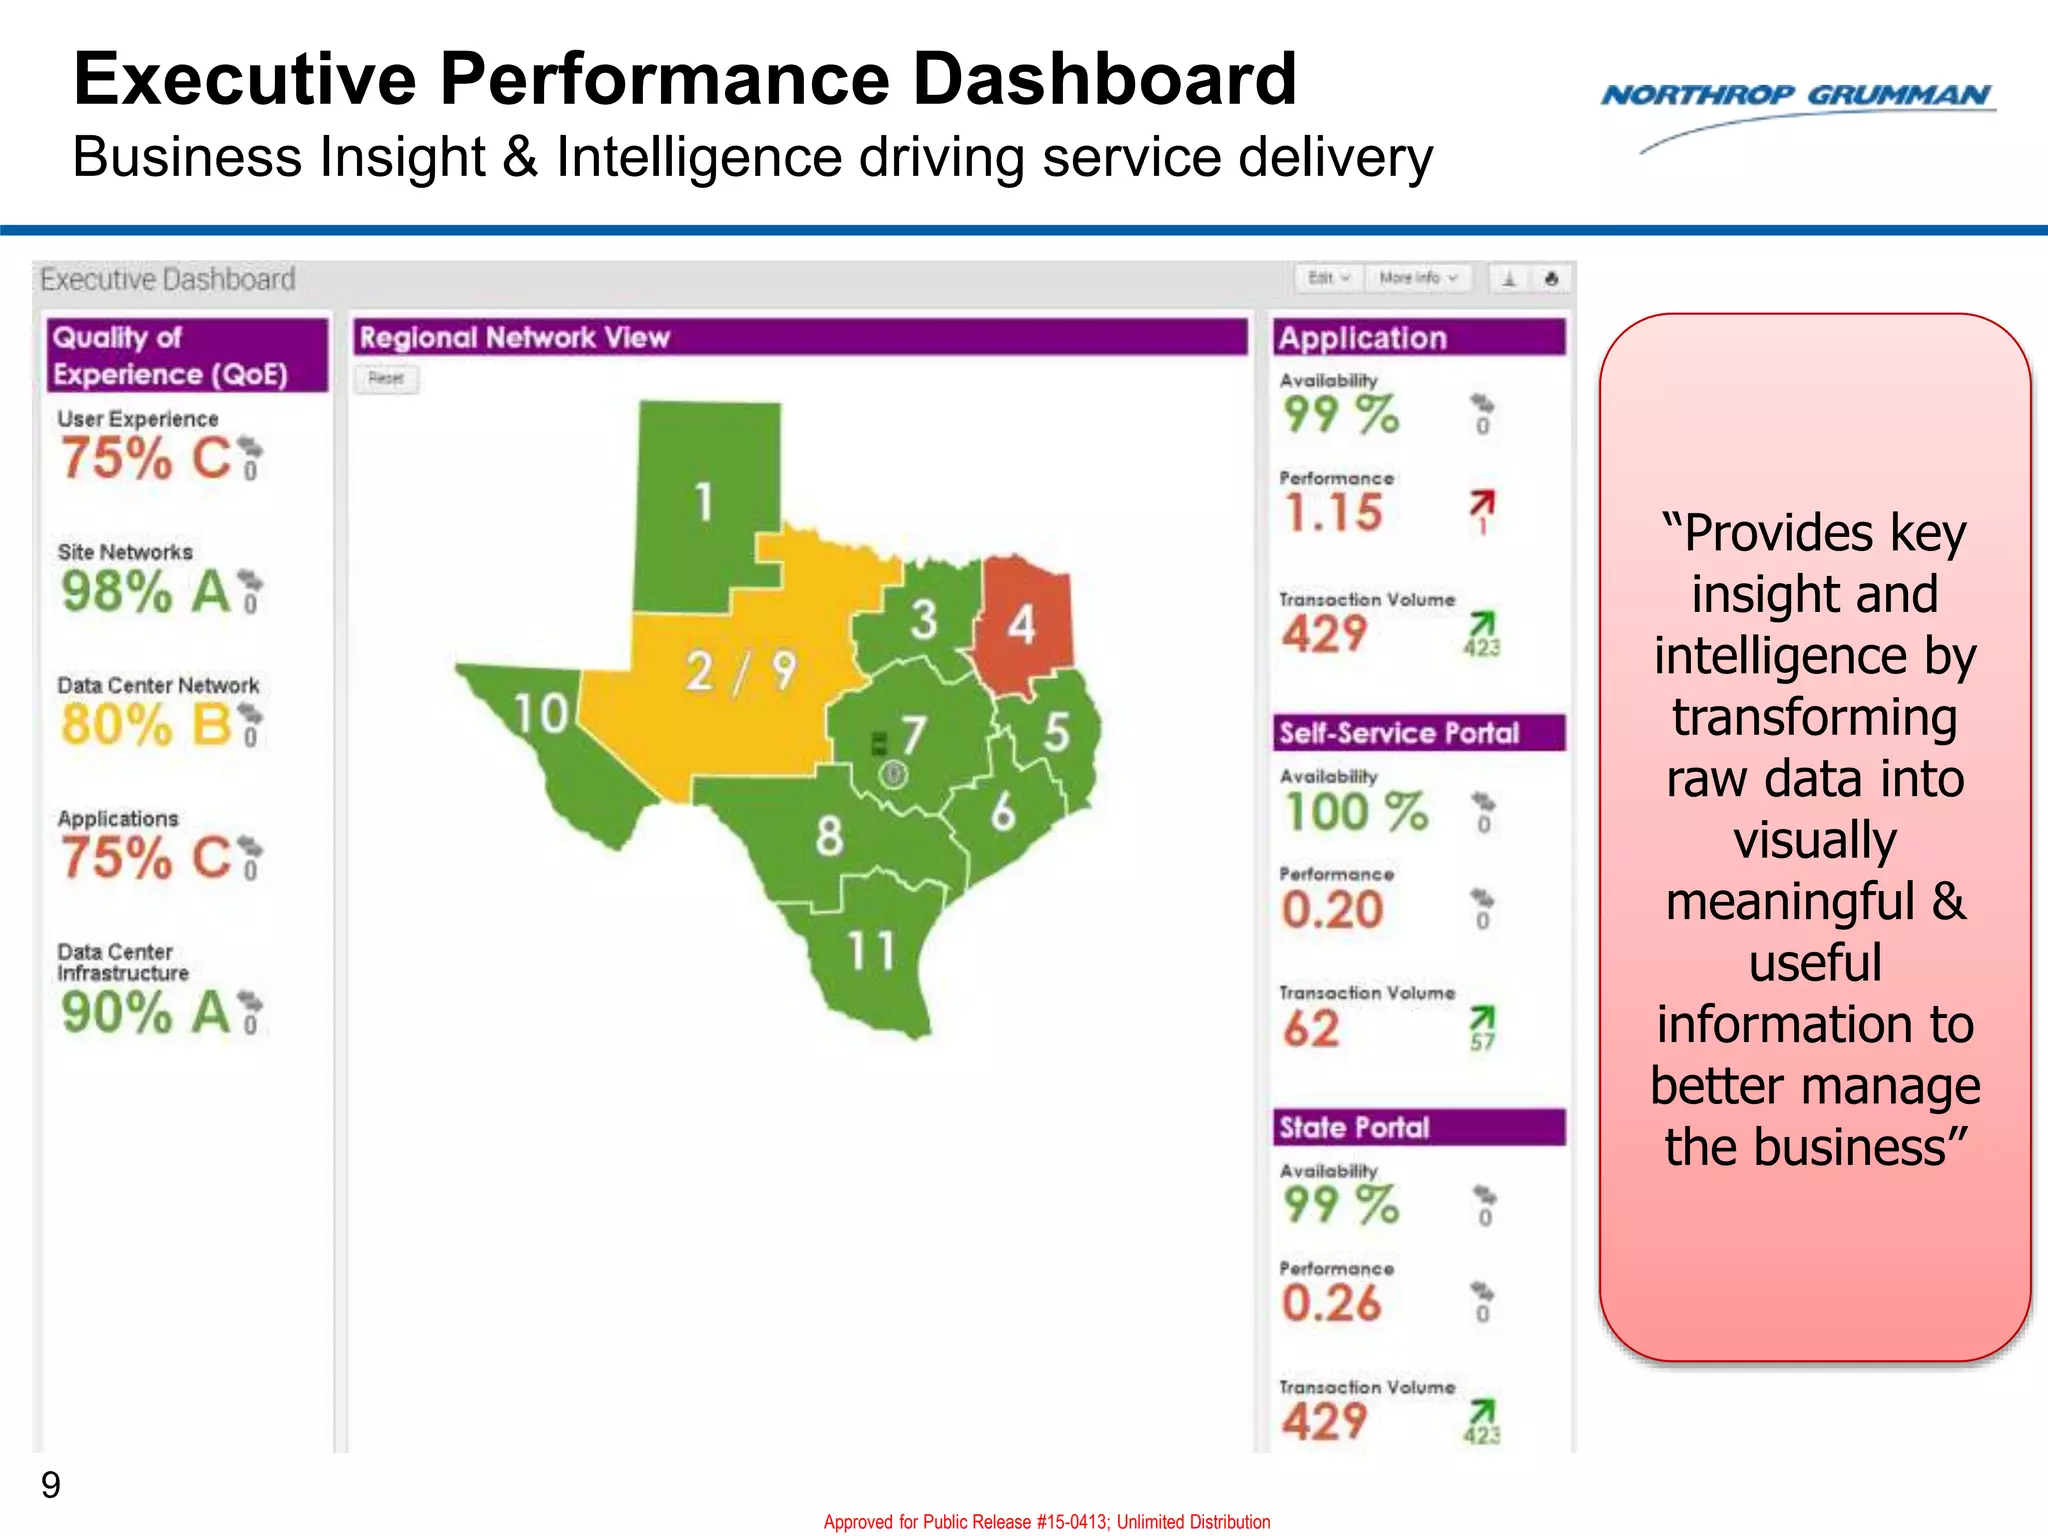
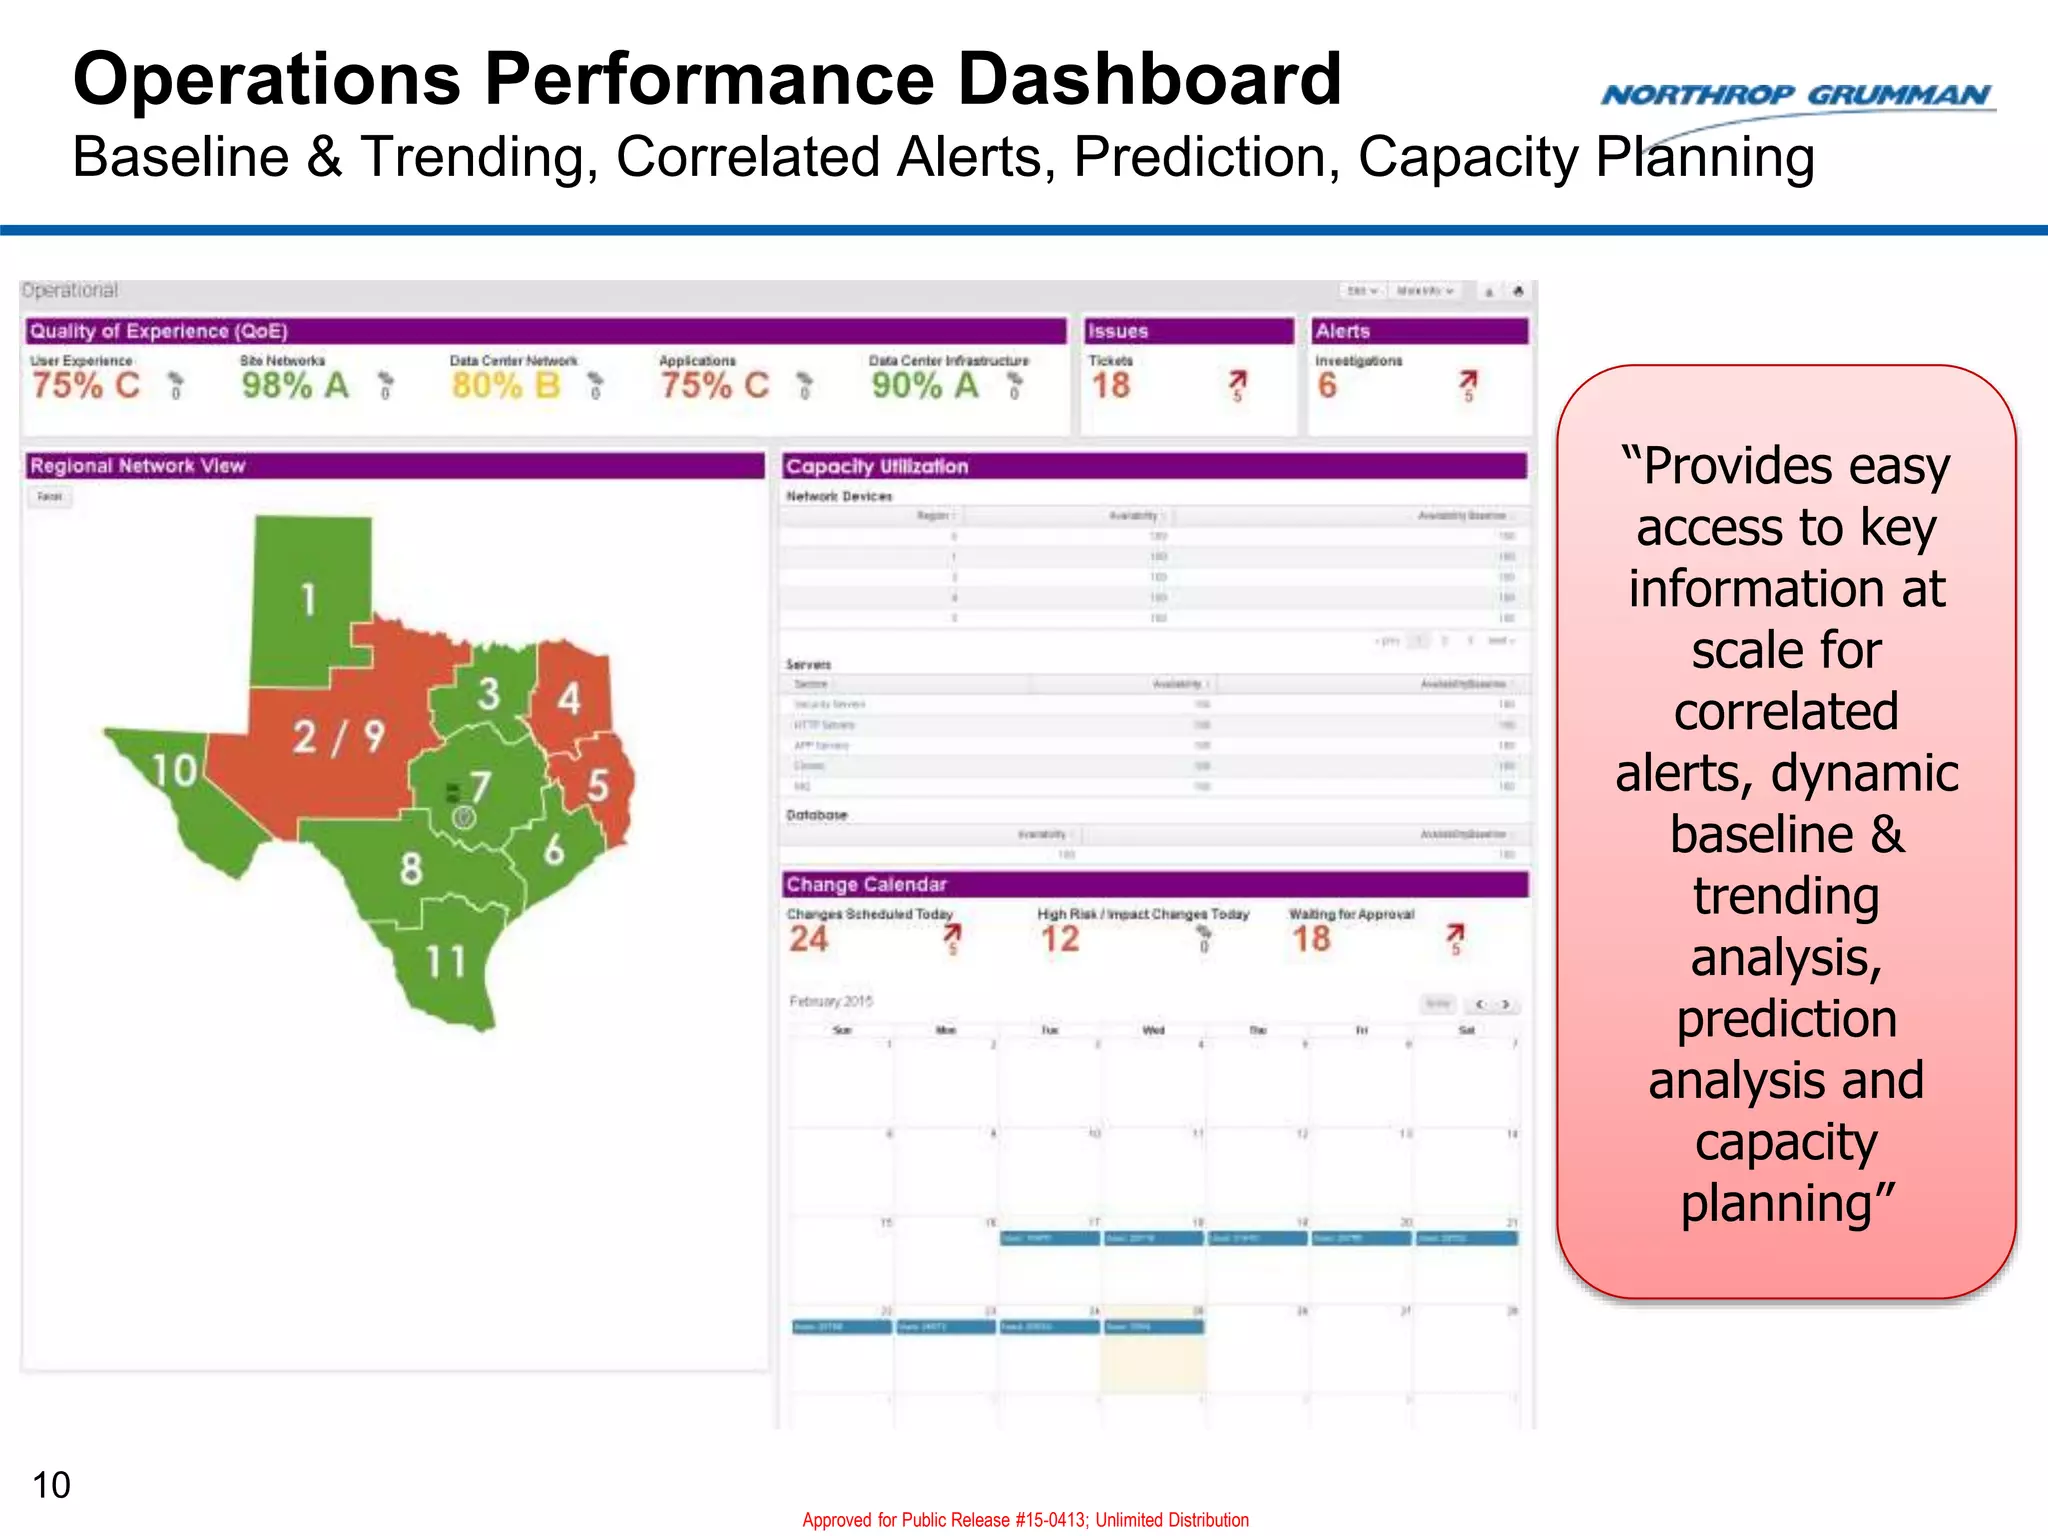
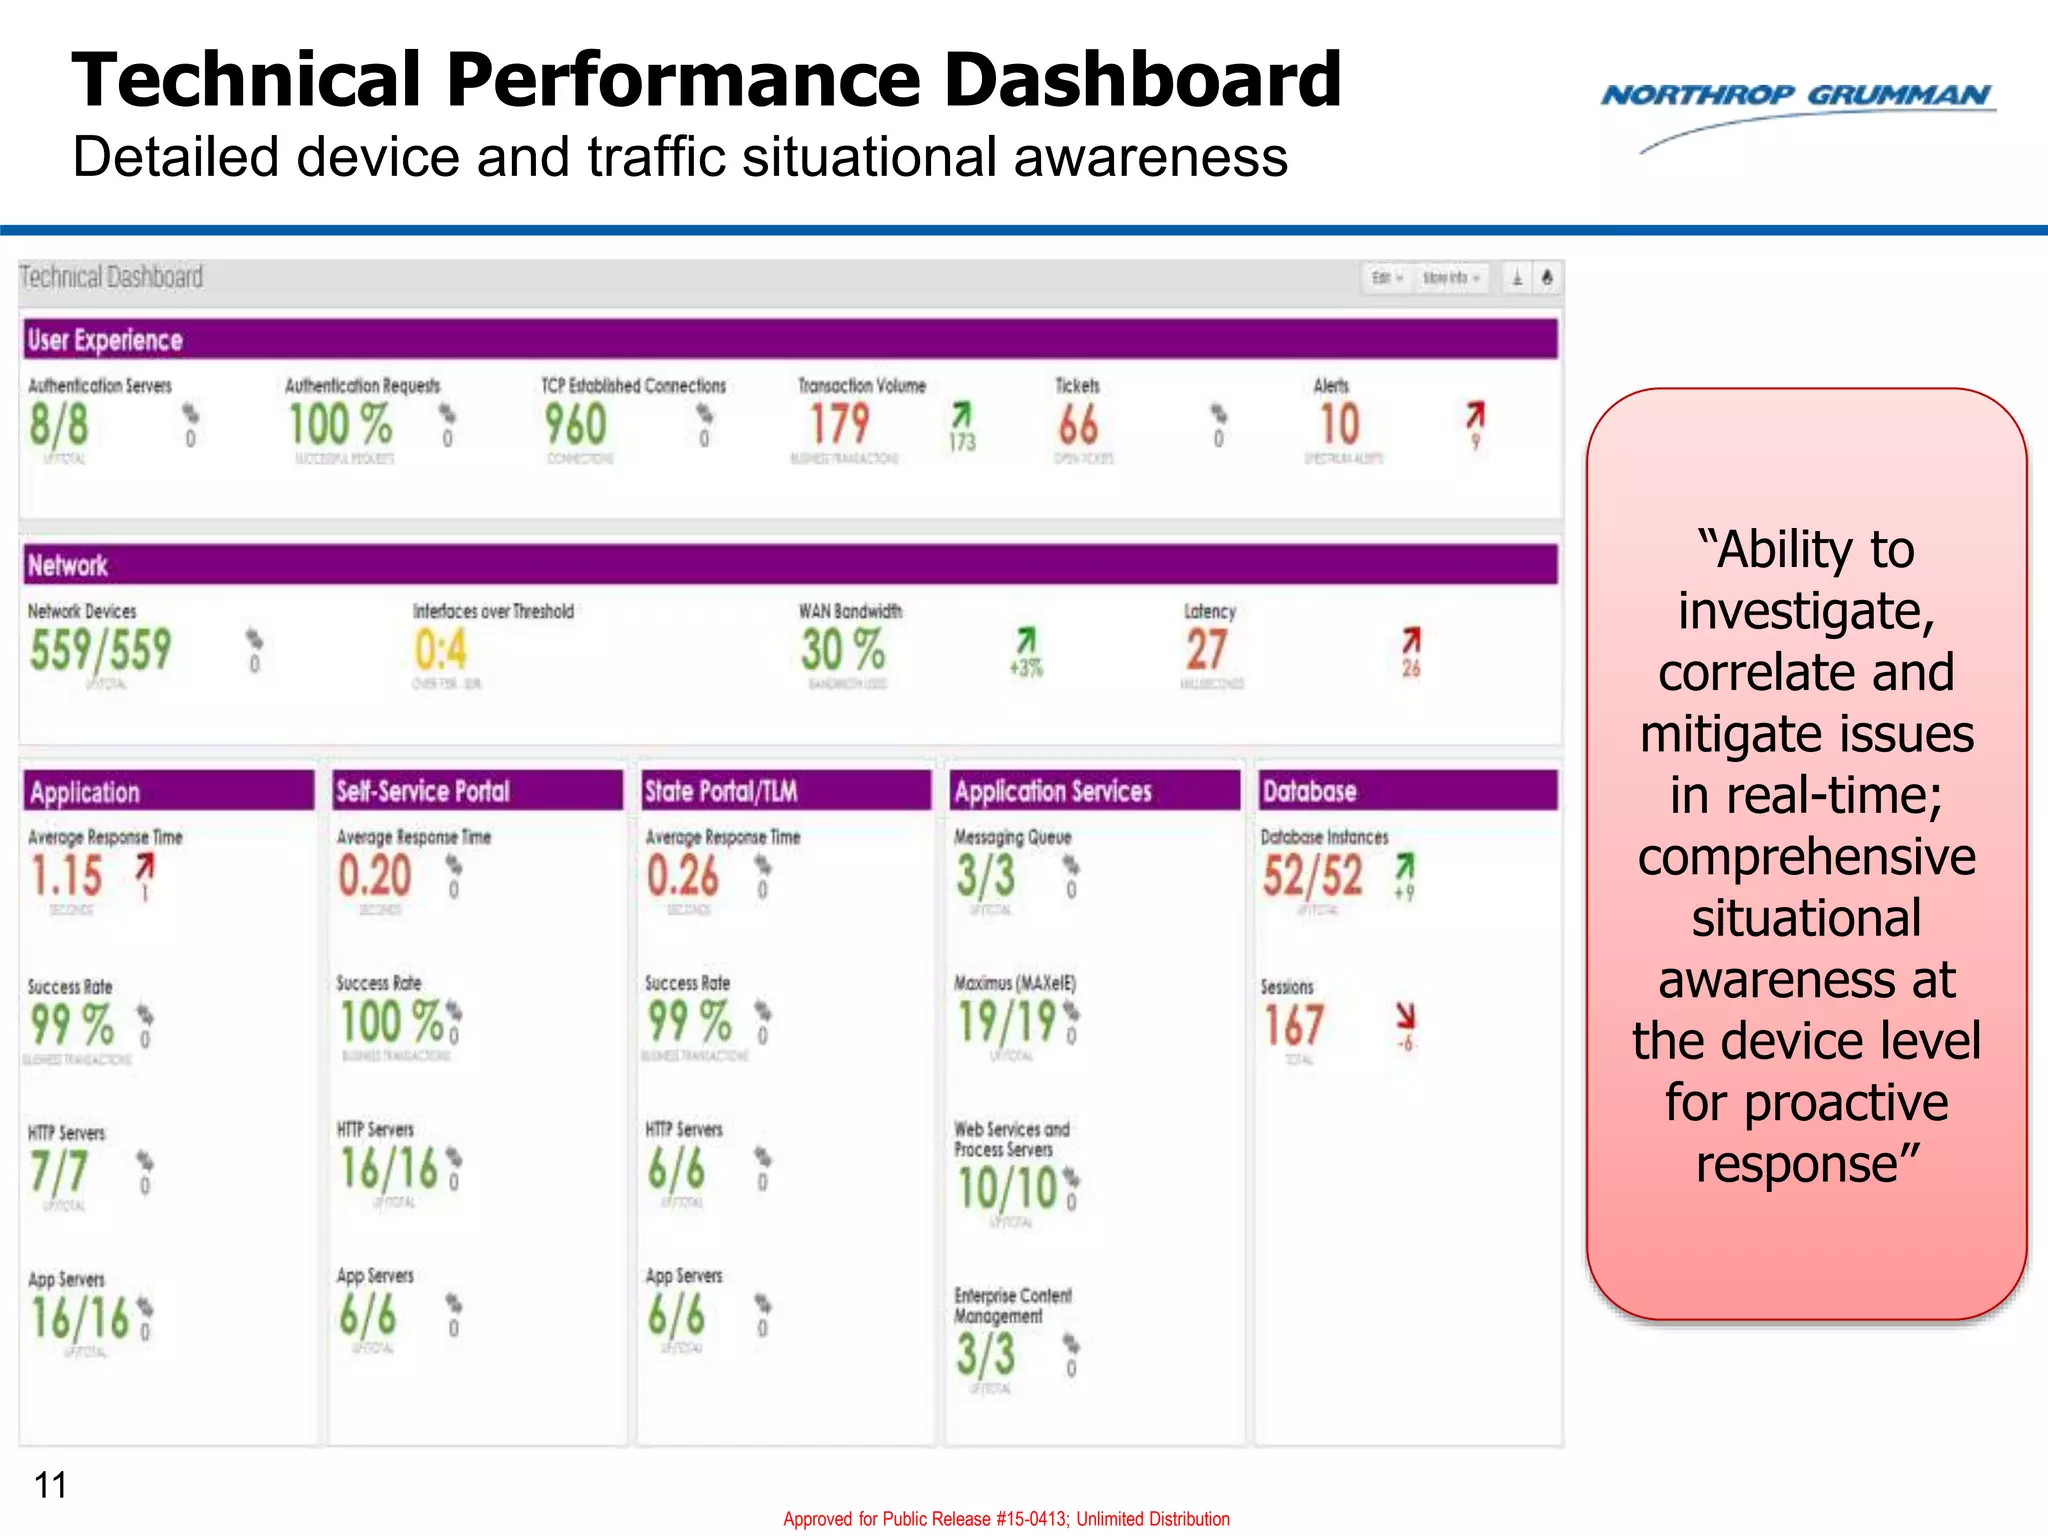
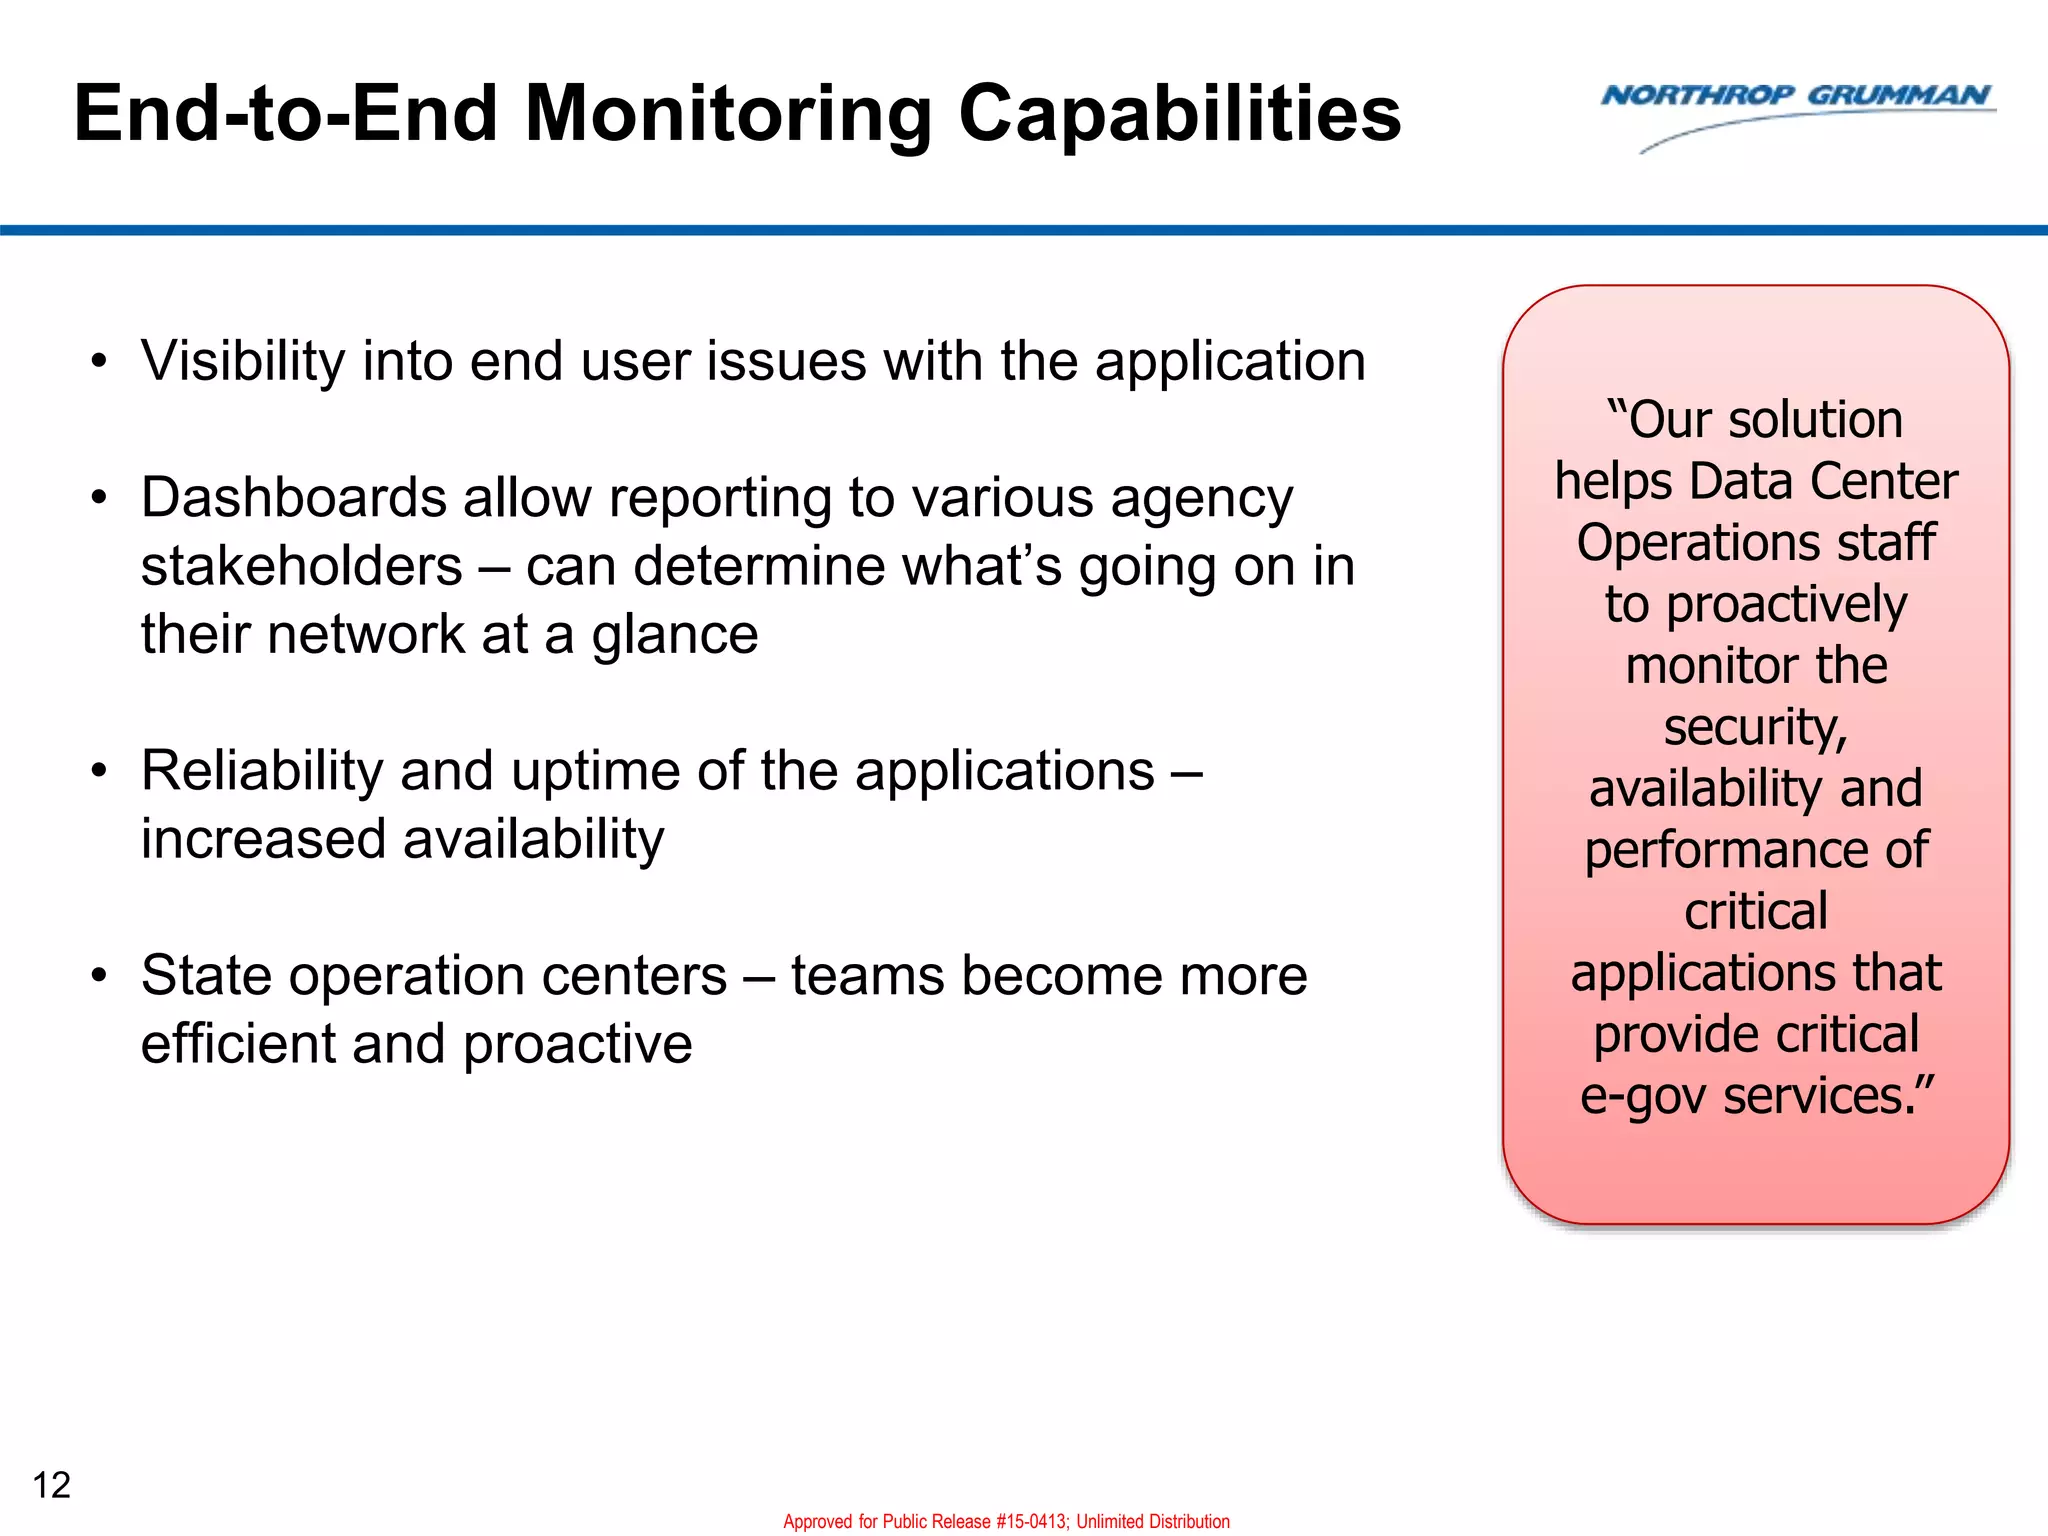
April 9, 2015
Northrop Grumman Information
Systems (NGIS)
End-to-End Monitoring
Unified Performance
Dashboard
Approved for Public Release #15-0413; Unlimited Distribution
UPD E2E Team
Calvin Smith
Jason Liu
Rich Galloway
Michael Rodriguez
About Northrop Grumman
2
• Global provider of advanced solutions that deliver timely,
enabling information to where it is needed most for our
military, intelligence, civilian, state and local, and
commercial customers.
• NGIS Vision/Mission: Our mission is to be at the forefront
of technology and innovation, delivering superior capability
and performance in tandem with maximized cost
efficiencies.
• 17,000+ employees, 50 states, 18 countries
• Headquarters in McLean, VA
Approved for Public Release #15-0413; Unlimited Distribution
About Us
The End-to-End Monitoring team supports federal,
state and local government programs, specializing in
cyber and performance monitoring.
 Cal - 28+ years in networking & cyber, 10 years in
continuous & end-to-end monitoring architectures. In his
spare time he is an avid music collector, IT cloud tech
enthusiast and road warrior.
 Rich – 27 years in fault-tolerant, high-volume computing; 3
years in continuous and end-to-end monitoring. 20-year
Habitat for Humanity volunteer.
 Michael – 8 years in .com engineering and advanced
analytics; 4 years in continuous and end-to-end
monitoring. Supporter of Central Texas Dachshund
Rescue and member of Extra Life. An organization that
raises money through gaming for Dell Children’s Medical
Center of Texas.
3
Top 3 Agency IT Initiatives
4
• Enterprise Application Reliability and Availability
• Visibility into Enterprise Application Performance issues from the End-
User Perspective
• Dynamic End-to-End Monitoring and Reporting
Approved for Public Release #15-0413; Unlimited Distribution
Agency IT Challenges
5
Complex IT Environment
– State-wide presence
– 11 Regions
– 1,000+ field sites
– Thousands of users
– Thousands of infrastructure devices and servers
Data Difficulties
– Many disparate data sources, highly complex network environment
– Siloed information
– Hard to aggregate, correlate and analyze information in real time
Availability Issues
– Impacts end-user productivity within agency
– Disrupts delivery of public-facing citizen services
Approved for Public Release #15-0413; Unlimited Distribution
Solution CONOPS
Dynamic Dashboards inside a Correlated Fused Data Environment
6
• Splunk-based dashboard application written in Python using DB-Connect
(SQL calls), Splunk forwarders, and custom APIs for data ingest
• Currently integrating 15+ vendor tools using Splunk as a correlated event-
driven, fused data environment providing contextual visual analytics,
dynamic baseline and trending with prediction-based knowledge-base
• Agency Data sources:
 Syslog and event data from enterprise vendor toolsets used for monitoring of
endpoints, network routers and switches, application servers and data center
infrastructure
 Web or enterprise application transaction data
 Agency legacy systems supporting systems and infrastructure management,
change management, trouble ticket, change management: CA, BMC, Oracle,
EMC, Hitachi, Microsoft, HP, Precise, et.al.
• Dashboards unique to Key Stakeholders
 Executive – Business insight on citizen service delivery, customer activity
 Operations – Real-time KPI tracking, dynamic baseline, trending & prediction
 Technical – Device detail of endpoints, network, application & data center
Approved for Public Release #15-0413; Unlimited Distribution
UPD Application CONOPS
• Acceptable Performance Range (APR) – The APR is dynamically determined based
on advanced analytics and machine-learning algorithms. It is continuously generated
based on historical and real-time data. There are no static, defined thresholds.
• Advanced Analytics – A moving average is used to calculate and analyze data points
through a series of minute-to-minute averages within a given timeframe. This process is
used to create UPD metric baselines and detect hidden performance patterns.
• Dynamic Color Coding and Letter Grades – A color scheme using green, yellow and
red applied to dashboard metrics and maps based on dynamic changes in the APR.
Similarly, letter grades ‘A-B-C-D-F’ are used for easier understanding of complex data.
• Predictive Analytics (Machine-Learning) – The dashboard dynamically extracts and
learns from application performance information (i.e., historical and real-time) in order to
determine patterns and predict future events.
• Quality of Experience – A derived metric capturing end-to-end performance across an
enterprise network. KPIs are calculated, combined and weighted to measure potential
risk factors contributing to application slowness from the end-user perspective.
7
8
“Our
dashboards
provide
integrated
visual analytics
allowing
customers to
visually interact
with their data
to better
collaborate and
share results”
Performance Dashboard Visual Analytics
Texas Interactive “Geo-map” drill-down to regions, cities, field-sites, devices
Executive Performance Dashboard
Business Insight & Intelligence driving service delivery
9
“Provides key
insight and
intelligence by
transforming
raw data into
visually
meaningful &
useful
information to
better manage
the business”
Approved for Public Release #15-0413; Unlimited Distribution
Operations Performance Dashboard
Baseline & Trending, Correlated Alerts, Prediction, Capacity Planning
10
“Provides easy
access to key
information at
scale for
correlated
alerts, dynamic
baseline &
trending
analysis,
prediction
analysis and
capacity
planning”
Approved for Public Release #15-0413; Unlimited Distribution
11
Technical Performance Dashboard
Detailed device and traffic situational awareness
“Ability to
investigate,
correlate and
mitigate issues
in real-time;
comprehensive
situational
awareness at
the device level
for proactive
response”
Approved for Public Release #15-0413; Unlimited Distribution
End-to-End Monitoring Capabilities
12
• Visibility into end user issues with the application
• Dashboards allow reporting to various agency
stakeholders – can determine what’s going on in
their network at a glance
• Reliability and uptime of the applications –
increased availability
• State operation centers – teams become more
efficient and proactive
“Our solution
helps Data Center
Operations staff
to proactively
monitor the
security,
availability and
performance of
critical
applications that
provide critical
e-gov services.”
Approved for Public Release #15-0413; Unlimited Distribution
Solution Benefits
Bring Immediate Value to Customer
13
• Leverages existing IT Investments
• Data consistency & Relevance
– All stakeholders view the same enterprise source data
– Dashboards present data that is tailored and targeted for different stakeholders
• Baseline and Trending Analysis
– Baseline, then trend up or down based on configurable time intervals
– Predictions based on historical information mapped to current events
• Troubleshooting Efficiency
– Timely triage – determine root cause and engage right people faster
– Decrease MTTR from hours to minutes
– Proactive vs. Reactive ability to avoid outages and lessen impact
• Interactive Visual Analytics
– Situational awareness for cross-team collaboration and increased understanding
– Allows stakeholders to visually interact with data to better collaborate and share
– Reporting based on role-based access
– Hidden pattern detection to discover unknown anomalies and speed remediation
Approved for Public Release #15-0413; Unlimited Distribution
Next Steps
• Continuous Improvement – Data Interfaces and data feeds, Splunk
saved searches requires continual maintenance and upkeep
• Continue to expand current end-to-monitoring capabilities into other
enterprise organizational components to provide complete “end-to-end
visibility” to support efficient delivery of key enterprise services
• Expand in other areas:
– Enhanced Network Monitoring
– Security Operations Monitoring
– Enterprise Application Performance Monitoring
– Extend current monitoring to other key Enterprise Network Environments
• Add additional data sources to provide greater Big Data Fidelity & Visual
Analytics thereby reducing complexity and improving collaboration
14
Approved for Public Release #15-0413; Unlimited Distribution
Points of Contact
Karen Wilson
Program Manager
Office: 512-374-4199
Email: Karen.Wilson@ngc.com
Calvin Smith
Cyber Technologist, Solutions Architect & Project Lead
Office: 512-374-4136
Email: ch.smith@ngc.com
Dawn Doyle
Senior Consultant, Strategic Partnerships, Inc.
Office: 512-531-3943
Email: ddoyle@spartnerships.com
15
Thank you

Virtual Gov Day - Application Delivery Breakout - Northrop Grumman Information Systems

  • 1.
    April 9, 2015 NorthropGrumman Information Systems (NGIS) End-to-End Monitoring Unified Performance Dashboard Approved for Public Release #15-0413; Unlimited Distribution UPD E2E Team Calvin Smith Jason Liu Rich Galloway Michael Rodriguez
  • 2.
    About Northrop Grumman 2 •Global provider of advanced solutions that deliver timely, enabling information to where it is needed most for our military, intelligence, civilian, state and local, and commercial customers. • NGIS Vision/Mission: Our mission is to be at the forefront of technology and innovation, delivering superior capability and performance in tandem with maximized cost efficiencies. • 17,000+ employees, 50 states, 18 countries • Headquarters in McLean, VA Approved for Public Release #15-0413; Unlimited Distribution
  • 3.
    About Us The End-to-EndMonitoring team supports federal, state and local government programs, specializing in cyber and performance monitoring.  Cal - 28+ years in networking & cyber, 10 years in continuous & end-to-end monitoring architectures. In his spare time he is an avid music collector, IT cloud tech enthusiast and road warrior.  Rich – 27 years in fault-tolerant, high-volume computing; 3 years in continuous and end-to-end monitoring. 20-year Habitat for Humanity volunteer.  Michael – 8 years in .com engineering and advanced analytics; 4 years in continuous and end-to-end monitoring. Supporter of Central Texas Dachshund Rescue and member of Extra Life. An organization that raises money through gaming for Dell Children’s Medical Center of Texas. 3
  • 4.
    Top 3 AgencyIT Initiatives 4 • Enterprise Application Reliability and Availability • Visibility into Enterprise Application Performance issues from the End- User Perspective • Dynamic End-to-End Monitoring and Reporting Approved for Public Release #15-0413; Unlimited Distribution
  • 5.
    Agency IT Challenges 5 ComplexIT Environment – State-wide presence – 11 Regions – 1,000+ field sites – Thousands of users – Thousands of infrastructure devices and servers Data Difficulties – Many disparate data sources, highly complex network environment – Siloed information – Hard to aggregate, correlate and analyze information in real time Availability Issues – Impacts end-user productivity within agency – Disrupts delivery of public-facing citizen services Approved for Public Release #15-0413; Unlimited Distribution
  • 6.
    Solution CONOPS Dynamic Dashboardsinside a Correlated Fused Data Environment 6 • Splunk-based dashboard application written in Python using DB-Connect (SQL calls), Splunk forwarders, and custom APIs for data ingest • Currently integrating 15+ vendor tools using Splunk as a correlated event- driven, fused data environment providing contextual visual analytics, dynamic baseline and trending with prediction-based knowledge-base • Agency Data sources:  Syslog and event data from enterprise vendor toolsets used for monitoring of endpoints, network routers and switches, application servers and data center infrastructure  Web or enterprise application transaction data  Agency legacy systems supporting systems and infrastructure management, change management, trouble ticket, change management: CA, BMC, Oracle, EMC, Hitachi, Microsoft, HP, Precise, et.al. • Dashboards unique to Key Stakeholders  Executive – Business insight on citizen service delivery, customer activity  Operations – Real-time KPI tracking, dynamic baseline, trending & prediction  Technical – Device detail of endpoints, network, application & data center Approved for Public Release #15-0413; Unlimited Distribution
  • 7.
    UPD Application CONOPS •Acceptable Performance Range (APR) – The APR is dynamically determined based on advanced analytics and machine-learning algorithms. It is continuously generated based on historical and real-time data. There are no static, defined thresholds. • Advanced Analytics – A moving average is used to calculate and analyze data points through a series of minute-to-minute averages within a given timeframe. This process is used to create UPD metric baselines and detect hidden performance patterns. • Dynamic Color Coding and Letter Grades – A color scheme using green, yellow and red applied to dashboard metrics and maps based on dynamic changes in the APR. Similarly, letter grades ‘A-B-C-D-F’ are used for easier understanding of complex data. • Predictive Analytics (Machine-Learning) – The dashboard dynamically extracts and learns from application performance information (i.e., historical and real-time) in order to determine patterns and predict future events. • Quality of Experience – A derived metric capturing end-to-end performance across an enterprise network. KPIs are calculated, combined and weighted to measure potential risk factors contributing to application slowness from the end-user perspective. 7
  • 8.
    8 “Our dashboards provide integrated visual analytics allowing customers to visuallyinteract with their data to better collaborate and share results” Performance Dashboard Visual Analytics Texas Interactive “Geo-map” drill-down to regions, cities, field-sites, devices
  • 9.
    Executive Performance Dashboard BusinessInsight & Intelligence driving service delivery 9 “Provides key insight and intelligence by transforming raw data into visually meaningful & useful information to better manage the business” Approved for Public Release #15-0413; Unlimited Distribution
  • 10.
    Operations Performance Dashboard Baseline& Trending, Correlated Alerts, Prediction, Capacity Planning 10 “Provides easy access to key information at scale for correlated alerts, dynamic baseline & trending analysis, prediction analysis and capacity planning” Approved for Public Release #15-0413; Unlimited Distribution
  • 11.
    11 Technical Performance Dashboard Detaileddevice and traffic situational awareness “Ability to investigate, correlate and mitigate issues in real-time; comprehensive situational awareness at the device level for proactive response” Approved for Public Release #15-0413; Unlimited Distribution
  • 12.
    End-to-End Monitoring Capabilities 12 •Visibility into end user issues with the application • Dashboards allow reporting to various agency stakeholders – can determine what’s going on in their network at a glance • Reliability and uptime of the applications – increased availability • State operation centers – teams become more efficient and proactive “Our solution helps Data Center Operations staff to proactively monitor the security, availability and performance of critical applications that provide critical e-gov services.” Approved for Public Release #15-0413; Unlimited Distribution
  • 13.
    Solution Benefits Bring ImmediateValue to Customer 13 • Leverages existing IT Investments • Data consistency & Relevance – All stakeholders view the same enterprise source data – Dashboards present data that is tailored and targeted for different stakeholders • Baseline and Trending Analysis – Baseline, then trend up or down based on configurable time intervals – Predictions based on historical information mapped to current events • Troubleshooting Efficiency – Timely triage – determine root cause and engage right people faster – Decrease MTTR from hours to minutes – Proactive vs. Reactive ability to avoid outages and lessen impact • Interactive Visual Analytics – Situational awareness for cross-team collaboration and increased understanding – Allows stakeholders to visually interact with data to better collaborate and share – Reporting based on role-based access – Hidden pattern detection to discover unknown anomalies and speed remediation Approved for Public Release #15-0413; Unlimited Distribution
  • 14.
    Next Steps • ContinuousImprovement – Data Interfaces and data feeds, Splunk saved searches requires continual maintenance and upkeep • Continue to expand current end-to-monitoring capabilities into other enterprise organizational components to provide complete “end-to-end visibility” to support efficient delivery of key enterprise services • Expand in other areas: – Enhanced Network Monitoring – Security Operations Monitoring – Enterprise Application Performance Monitoring – Extend current monitoring to other key Enterprise Network Environments • Add additional data sources to provide greater Big Data Fidelity & Visual Analytics thereby reducing complexity and improving collaboration 14 Approved for Public Release #15-0413; Unlimited Distribution
  • 15.
    Points of Contact KarenWilson Program Manager Office: 512-374-4199 Email: Karen.Wilson@ngc.com Calvin Smith Cyber Technologist, Solutions Architect & Project Lead Office: 512-374-4136 Email: ch.smith@ngc.com Dawn Doyle Senior Consultant, Strategic Partnerships, Inc. Office: 512-531-3943 Email: ddoyle@spartnerships.com 15
  • 17.