More Related Content

PDF

PDF

PDF

PDF

XLS
27 August Financial Analysis 
PDF
Ranking Simulado Rede Damas - Recife 
TXT

DOCX
More from Ingrith Rivera

PDF

DOCX

PDF

PDF

PDF

PDF

PDF

PDF

PDF

PDF

PDF

PDF
Matiz de datos microempresarios 
PDF

PPTX

DOCX

DOCX
Plateamiento del problema 
DOCX
Problema. microempresarios y cuenta gotas 
PPTX
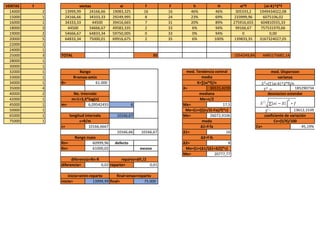
Ventas
- 1.
VENTAS f xif F h H xi*f |xi-X|^2*f
14000 2 13999,99 24166,66 19083,325 16 16 46% 46% 305333,2 1949434022,08
15000 1 24166,66 34333,33 29249,995 8 24 23% 69% 233999,96 6075106,02
16000 1 34333,33 44500 39416,665 7 31 20% 89% 275916,655 604810555,33
18000 3 44500 54666,67 49583,335 2 33 6% 94% 99166,67 757531970,66
19000 2 54666,67 64833,34 59750,005 0 33 0% 94% 0 0,00
20000 5 64833,34 75000,01 69916,675 2 35 6% 100% 139833,35 3167324027,05
22000 1
24000 1
25000 3 TOTAL 35 1054249,84 6485175681,14
28000 1
30000 1
32000 1
33000 1
34000 1 R= 61.000
35000 4 X= 30121,4239 185290734
40000 2
42000 1
45000 1 m= 6,09542455 6 Me= 17,5
50000 1 13612,1539
65000 1 10166,67 Me= 26072,9106
75000 1
c= 10166,6667 Cv= 45,19%
10166,66 10166,67 ∆1= 16
Rn= 60999,96 defecto ∆2= 8
Rn= 61000,02 exceso
Mo= 20777,77
diferencia= 0,02 reparto= 0,01
inicio= 13999,99 final= 75.000
desviacion estandar
m=1+3,3*log(n) Me=n/2
med. Dispersion
R=xmax-xmin media varianza
X=∑(xi*f)/n
∆2=f-fs
Mo=(Li+(∆1/(∆1+∆2))*c)
ventas
Rango med. Tendencia central
No. Intervalo mediana
Rango nueo
coeficiente de variación
c=R/m moda Cv=(S/X)/100
∆1=f-fa
Me=(Li+((((n/2)-Fa)/f)*c)
longitud intervalo
diferencia=Rn-R reparto=dif./2
inicio=xmin-reparto final=xmax+reparto
𝑆2
=(∑|xi-X|^2*f)/n
𝑆2
=
𝑆⬚
∑ 𝑥𝑖 − 𝑋 ቚ
2
∗ 𝑓
𝑆⬚