UNIT - 1
Principlesof IOT and AI, Fundamentals of IOT and AI,
Definition of IOT, IOT reference model, IOT Platforms,
IOT verticals, Big Data and IOT, Infusion of AI and
IOT, The standard process in data mining, IOT
Platforms and AI Platforms, Introduction to Datasets,
Tensorflow, Keras, Dataset Examples, Data Access and
distributed processing for IOT, Text files in python,
SQL data, HDF5
3.
What is IoT?
The term IoT was coined by Kevin Ashton in 1999.
At that time, most of the data fed to computers was generated by
humans; he proposed that the best way would be for computers to take
data directly, without any intervention from humans. And so he proposed
things such as RFID and sensors, which gather data, should be connected
to the network, and feed directly to the computer.
The International Telecommunication Unit (ITU), a United Nations
agency, defines IoT as:
"a global infrastructure for the information society, enabling
advanced services by interconnecting (physical and virtual) things based
on existing and evolving interoperable information and communication
technologies."
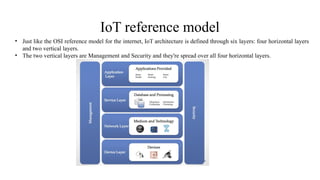
IoT reference model
•Just like the OSI reference model for the internet, IoT architecture is defined through six layers: four horizontal layers
and two vertical layers.
• The two vertical layers are Management and Security and they're spread over all four horizontal layers.
7.
• The DeviceLayer:
At the bottom of the stack, we have the device layer, also called the perception layer. This layer contains the
physical things needed to sense or control the physical world and acquire data (that is, by perceiving the physical
world).
Existing hardware, such as sensors, RFID, and actuators, constitutes the perception layer.
• The Network Layer:
This layer provides the networking support and transfer of data over either wired or wireless network.
The layer securely transmits the information from the devices in the device layer to the information processing
system.
Both transmission Medium and Technology are part of the networking layer. Examples include 3G, UMTS, ZigBee,
Bluetooth, Wi-Fi, and so on.
• The Service Layer:
This layer is responsible for service management. It receives information from the network layer, stores it into the
database, processes that information, and can make an automatic decision based on the results.
• The Application Layer:
This layer manages the applications dependent upon the information processed in the service layer. There's a wide
range of applications that can be implemented by IoT: smart cities, smart farming, and smart homes, to name a few.
8.
IoT platforms
• Informationfrom the network layer is often managed with the help of IoT
platforms.
• Many companies today provide IoT platform services, where they help not
only with data but also enable seamless integration with different
hardware.
• Since they function as a mediator between the hardware and application
layer, IoT platforms are also referred to as IoT middleware and are part of
the service layer in the IoT reference stack.
• IoT platforms provide the ability to connect and communicate with things
from anywhere in the world.
• Some popular IoT platforms such as the Google Cloud Platform, Azure
IoT, Amazon AWS IoT, Predix, and H2O.
9.
• IoT platformcan be chosen according to the following criteria:
• Scalability: Addition and deletion of new devices to the existing IoT
network should be possible
• Ease of use: The system should be perfectly working and delivering all its
specifications with minimum intervention
• Third party integration: Heterogeneous devices and protocols should be
able to inter-network with each other
• Deployment options: It should be workable on a broad variety of
hardware devices and software platforms
• Data security: The security of data and devices is ensured
10.
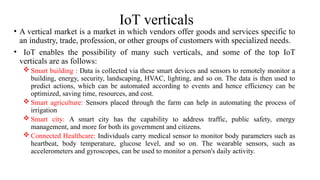
IoT verticals
• Avertical market is a market in which vendors offer goods and services specific to
an industry, trade, profession, or other groups of customers with specialized needs.
• IoT enables the possibility of many such verticals, and some of the top IoT
verticals are as follows:
Smart building : Data is collected via these smart devices and sensors to remotely monitor a
building, energy, security, landscaping, HVAC, lighting, and so on. The data is then used to
predict actions, which can be automated according to events and hence efficiency can be
optimized, saving time, resources, and cost.
Smart agriculture: Sensors placed through the farm can help in automating the process of
irrigation
Smart city: A smart city has the capability to address traffic, public safety, energy
management, and more for both its government and citizens.
Connected Healthcare: Individuals carry medical sensor to monitor body parameters such as
heartbeat, body temperature, glucose level, and so on. The wearable sensors, such as
accelerometers and gyroscopes, can be used to monitor a person's daily activity.
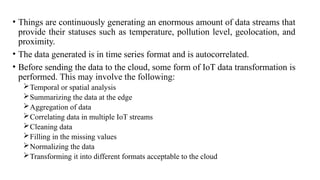
• Things arecontinuously generating an enormous amount of data streams that
provide their statuses such as temperature, pollution level, geolocation, and
proximity.
• The data generated is in time series format and is autocorrelated.
• Before sending the data to the cloud, some form of IoT data transformation is
performed. This may involve the following:
Temporal or spatial analysis
Summarizing the data at the edge
Aggregation of data
Correlating data in multiple IoT streams
Cleaning data
Filling in the missing values
Normalizing the data
Transforming it into different formats acceptable to the cloud
13.
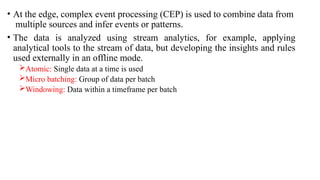
• At theedge, complex event processing (CEP) is used to combine data from
multiple sources and infer events or patterns.
• The data is analyzed using stream analytics, for example, applying
analytical tools to the stream of data, but developing the insights and rules
used externally in an offline mode.
Atomic: Single data at a time is used
Micro batching: Group of data per batch
Windowing: Data within a timeframe per batch
14.
Infusion of AI– data science in IoT
• IoT generates an enormous amount of data; presently, 90% of the data
generated isn't even captured, and out of the 10% that is captured, most is
time-dependent and loses its value within milliseconds.
15.
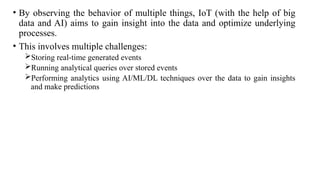
• By observingthe behavior of multiple things, IoT (with the help of big
data and AI) aims to gain insight into the data and optimize underlying
processes.
• This involves multiple challenges:
Storing real-time generated events
Running analytical queries over stored events
Performing analytics using AI/ML/DL techniques over the data to gain insights
and make predictions
16.
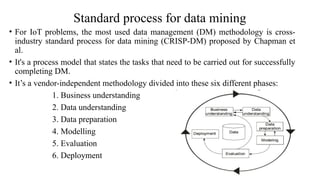
Standard process fordata mining
• For IoT problems, the most used data management (DM) methodology is cross-
industry standard process for data mining (CRISP-DM) proposed by Chapman et
al.
• It's a process model that states the tasks that need to be carried out for successfully
completing DM.
• It’s a vendor-independent methodology divided into these six different phases:
1. Business understanding
2. Data understanding
3. Data preparation
4. Modelling
5. Evaluation
6. Deployment
17.
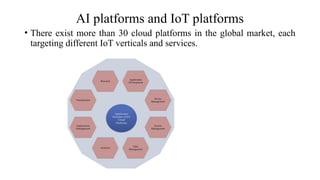
• There existmore than 30 cloud platforms in the global market, each
targeting different IoT verticals and services.
AI platforms and IoT platforms
18.
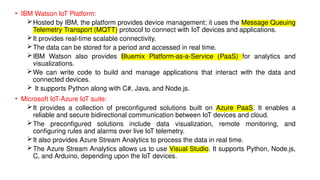
• IBM WatsonIoT Platform:
Hosted by IBM, the platform provides device management; it uses the Message Queuing
Telemetry Transport (MQTT) protocol to connect with IoT devices and applications.
It provides real-time scalable connectivity.
The data can be stored for a period and accessed in real time.
IBM Watson also provides Bluemix Platform-as-a-Service (PaaS) for analytics and
visualizations.
We can write code to build and manage applications that interact with the data and
connected devices.
It supports Python along with C#, Java, and Node.js.
• Microsoft IoT-Azure IoT suite:
It provides a collection of preconfigured solutions built on Azure PaaS. It enables a
reliable and secure bidirectional communication between IoT devices and cloud.
The preconfigured solutions include data visualization, remote monitoring, and
configuring rules and alarms over live IoT telemetry.
It also provides Azure Stream Analytics to process the data in real time.
The Azure Stream Analytics allows us to use Visual Studio. It supports Python, Node.js,
C, and Arduino, depending upon the IoT devices.
19.
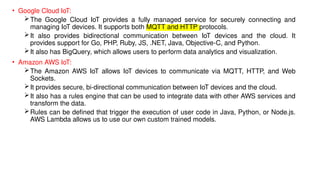
• Google CloudIoT:
The Google Cloud IoT provides a fully managed service for securely connecting and
managing IoT devices. It supports both MQTT and HTTP protocols.
It also provides bidirectional communication between IoT devices and the cloud. It
provides support for Go, PHP, Ruby, JS, .NET, Java, Objective-C, and Python.
It also has BigQuery, which allows users to perform data analytics and visualization.
• Amazon AWS IoT:
The Amazon AWS IoT allows IoT devices to communicate via MQTT, HTTP, and Web
Sockets.
It provides secure, bi-directional communication between IoT devices and the cloud.
It also has a rules engine that can be used to integrate data with other AWS services and
transform the data.
Rules can be defined that trigger the execution of user code in Java, Python, or Node.js.
AWS Lambda allows us to use our own custom trained models.
20.
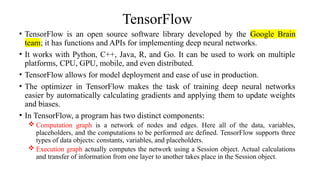
TensorFlow
• TensorFlow isan open source software library developed by the Google Brain
team; it has functions and APIs for implementing deep neural networks.
• It works with Python, C++, Java, R, and Go. It can be used to work on multiple
platforms, CPU, GPU, mobile, and even distributed.
• TensorFlow allows for model deployment and ease of use in production.
• The optimizer in TensorFlow makes the task of training deep neural networks
easier by automatically calculating gradients and applying them to update weights
and biases.
• In TensorFlow, a program has two distinct components:
Computation graph is a network of nodes and edges. Here all of the data, variables,
placeholders, and the computations to be performed are defined. TensorFlow supports three
types of data objects: constants, variables, and placeholders.
Execution graph actually computes the network using a Session object. Actual calculations
and transfer of information from one layer to another takes place in the Session object.
21.
Let's see thecode to perform matrix multiplication in TensorFlow.
# import libraries and modules needed for the code
import tensorflow as tf
import numpy as np
# Data
# A random matrix of size [3,5]
mat1 = np.random.rand(3,5)
# A random matrix of size [5,2]
mat2 = np.random.rand(5,2)
#Computation Graph
A = tf.placeholder(tf.float32, None, name='A')
B = tf.placeholder(tf.float32, None, name='B')
C = tf.matmul(A,B)
#Execution Graph
with tf.Session() as sess:
result = sess.run(C, feed_dict={A: mat1, B:mat2})
print(result)
22.
Keras
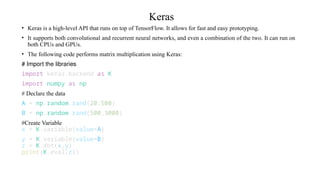
• Keras isa high-level API that runs on top of TensorFlow. It allows for fast and easy prototyping.
• It supports both convolutional and recurrent neural networks, and even a combination of the two. It can run on
both CPUs and GPUs.
• The following code performs matrix multiplication using Keras:
# Import the libraries
import keras.backend as K
import numpy as np
# Declare the data
A = np.random.rand(20,500)
B = np.random.rand(500,3000)
#Create Variable
x = K.variable(value=A)
y = K.variable(value=B)
z = K.dot(x,y)
print(K.eval(z))
23.
Datasets
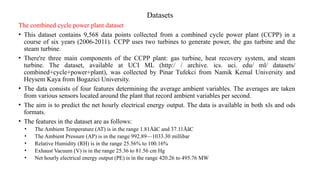
The combined cyclepower plant dataset
• This dataset contains 9,568 data points collected from a combined cycle power plant (CCPP) in a
course of six years (2006-2011). CCPP uses two turbines to generate power, the gas turbine and the
steam turbine.
• There're three main components of the CCPP plant: gas turbine, heat recovery system, and steam
turbine. The dataset, available at UCI ML (http:/ / archive. ics. uci. edu/ ml/ datasets/
combined+cycle+power+plant), was collected by Pinar Tufekci from Namik Kemal University and
Heysem Kaya from Bogazici University.
• The data consists of four features determining the average ambient variables. The averages are taken
from various sensors located around the plant that record ambient variables per second.
• The aim is to predict the net hourly electrical energy output. The data is available in both xls and ods
formats.
• The features in the dataset are as follows:
• The Ambient Temperature (AT) is in the range 1.81ÅãC and 37.11ÅãC
• The Ambient Pressure (AP) is in the range 992.89—1033.30 millibar
• Relative Humidity (RH) is in the range 25.56% to 100.16%
• Exhaust Vacuum (V) is in the range 25.36 to 81.56 cm Hg
• Net hourly electrical energy output (PE) is in the range 420.26 to 495.76 MW
24.
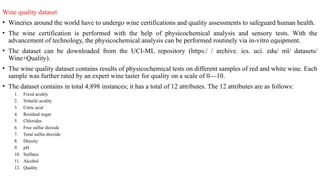
Wine quality dataset
•Wineries around the world have to undergo wine certifications and quality assessments to safeguard human health.
• The wine certification is performed with the help of physicochemical analysis and sensory tests. With the
advancement of technology, the physicochemical analysis can be performed routinely via in-vitro equipment.
• The dataset can be downloaded from the UCI-ML repository (https:/ / archive. ics. uci. edu/ ml/ datasets/
Wine+Quality).
• The wine quality dataset contains results of physicochemical tests on different samples of red and white wine. Each
sample was further rated by an expert wine taster for quality on a scale of 0—10.
• The dataset contains in total 4,898 instances; it has a total of 12 attributes. The 12 attributes are as follows:
1. Fixed acidity
2. Volatile acidity
3. Citric acid
4. Residual sugar
5. Chlorides
6. Free sulfur dioxide
7. Total sulfur dioxide
8. Density
9. pH
10. Sulfates
11. Alcohol
12. Quality
25.
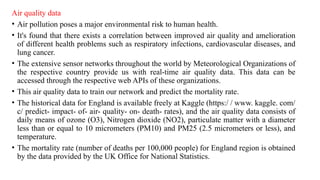
Air quality data
•Air pollution poses a major environmental risk to human health.
• It's found that there exists a correlation between improved air quality and amelioration
of different health problems such as respiratory infections, cardiovascular diseases, and
lung cancer.
• The extensive sensor networks throughout the world by Meteorological Organizations of
the respective country provide us with real-time air quality data. This data can be
accessed through the respective web APIs of these organizations.
• This air quality data to train our network and predict the mortality rate.
• The historical data for England is available freely at Kaggle (https:/ / www. kaggle. com/
c/ predict- impact- of- air- quality- on- death- rates), and the air quality data consists of
daily means of ozone (O3), Nitrogen dioxide (NO2), particulate matter with a diameter
less than or equal to 10 micrometers (PM10) and PM25 (2.5 micrometers or less), and
temperature.
• The mortality rate (number of deaths per 100,000 people) for England region is obtained
by the data provided by the UK Office for National Statistics.
26.
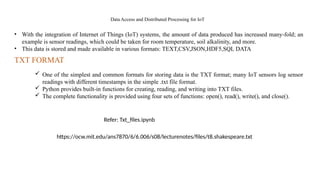
Data Access andDistributed Processing for IoT
• With the integration of Internet of Things (IoT) systems, the amount of data produced has increased many-fold; an
example is sensor readings, which could be taken for room temperature, soil alkalinity, and more.
• This data is stored and made available in various formats: TEXT,CSV,JSON,HDF5,SQL DATA
One of the simplest and common formats for storing data is the TXT format; many IoT sensors log sensor
readings with different timestamps in the simple .txt file format.
Python provides built-in functions for creating, reading, and writing into TXT files.
The complete functionality is provided using four sets of functions: open(), read(), write(), and close().
TXT FORMAT
Refer: Txt_files.ipynb
https://ocw.mit.edu/ans7870/6/6.006/s08/lecturenotes/files/t8.shakespeare.txt
27.
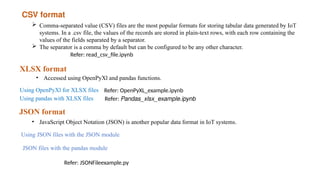
CSV format
Comma-separatedvalue (CSV) files are the most popular formats for storing tabular data generated by IoT
systems. In a .csv file, the values of the records are stored in plain-text rows, with each row containing the
values of the fields separated by a separator.
The separator is a comma by default but can be configured to be any other character.
Refer: read_csv_file.ipynb
XLSX format
• Accessed using OpenPyXl and pandas functions.
Using OpenPyXl for XLSX files Refer: OpenPyXL_example.ipynb
Using pandas with XLSX files Refer: Pandas_xlsx_example.ipynb
JSON format
• JavaScript Object Notation (JSON) is another popular data format in IoT systems.
Using JSON files with the JSON module
JSON files with the pandas module
Refer: JSONFileexample.py
28.
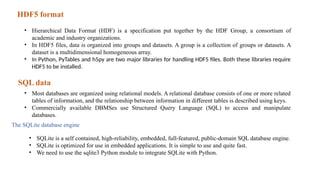
HDF5 format
• HierarchicalData Format (HDF) is a specification put together by the HDF Group, a consortium of
academic and industry organizations.
• In HDF5 files, data is organized into groups and datasets. A group is a collection of groups or datasets. A
dataset is a multidimensional homogeneous array.
• In Python, PyTables and h5py are two major libraries for handling HDF5 files. Both these libraries require
HDF5 to be installed.
SQL data
• Most databases are organized using relational models. A relational database consists of one or more related
tables of information, and the relationship between information in different tables is described using keys.
• Commercially available DBMSes use Structured Query Language (SQL) to access and manipulate
databases.
The SQLite database engine
• SQLite is a self contained, high-reliability, embedded, full-featured, public-domain SQL database engine.
• SQLite is optimized for use in embedded applications. It is simple to use and quite fast.
• We need to use the sqlite3 Python module to integrate SQLite with Python.
29.
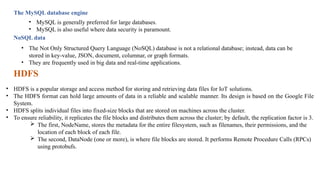
The MySQL databaseengine
• MySQL is generally preferred for large databases.
• MySQL is also useful where data security is paramount.
NoSQL data
• The Not Only Structured Query Language (NoSQL) database is not a relational database; instead, data can be
stored in key-value, JSON, document, columnar, or graph formats.
• They are frequently used in big data and real-time applications.
HDFS
• HDFS is a popular storage and access method for storing and retrieving data files for IoT solutions.
• The HDFS format can hold large amounts of data in a reliable and scalable manner. Its design is based on the Google File
System.
• HDFS splits individual files into fixed-size blocks that are stored on machines across the cluster.
• To ensure reliability, it replicates the file blocks and distributes them across the cluster; by default, the replication factor is 3.
The first, NodeName, stores the metadata for the entire filesystem, such as filenames, their permissions, and the
location of each block of each file.
The second, DataNode (one or more), is where file blocks are stored. It performs Remote Procedure Calls (RPCs)
using protobufs.
30.
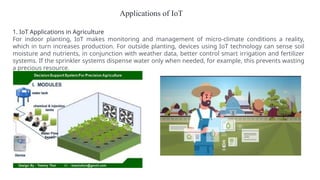
Applications of IoT
1.IoT Applications in Agriculture
For indoor planting, IoT makes monitoring and management of micro-climate conditions a reality,
which in turn increases production. For outside planting, devices using IoT technology can sense soil
moisture and nutrients, in conjunction with weather data, better control smart irrigation and fertilizer
systems. If the sprinkler systems dispense water only when needed, for example, this prevents wasting
a precious resource.
31.
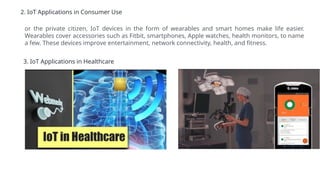
2. IoT Applicationsin Consumer Use
or the private citizen, IoT devices in the form of wearables and smart homes make life easier.
Wearables cover accessories such as Fitbit, smartphones, Apple watches, health monitors, to name
a few. These devices improve entertainment, network connectivity, health, and fitness.
3. IoT Applications in Healthcare
![Let's see the code to perform matrix multiplication in TensorFlow.
# import libraries and modules needed for the code
import tensorflow as tf
import numpy as np
# Data
# A random matrix of size [3,5]
mat1 = np.random.rand(3,5)
# A random matrix of size [5,2]
mat2 = np.random.rand(5,2)
#Computation Graph
A = tf.placeholder(tf.float32, None, name='A')
B = tf.placeholder(tf.float32, None, name='B')
C = tf.matmul(A,B)
#Execution Graph
with tf.Session() as sess:
result = sess.run(C, feed_dict={A: mat1, B:mat2})
print(result)](https://image.slidesharecdn.com/unit-1-250424001332-69945e9e/85/Unit-1_Artificial-Intelligence-Internet-of-Things-21-320.jpg)