Download to read offline

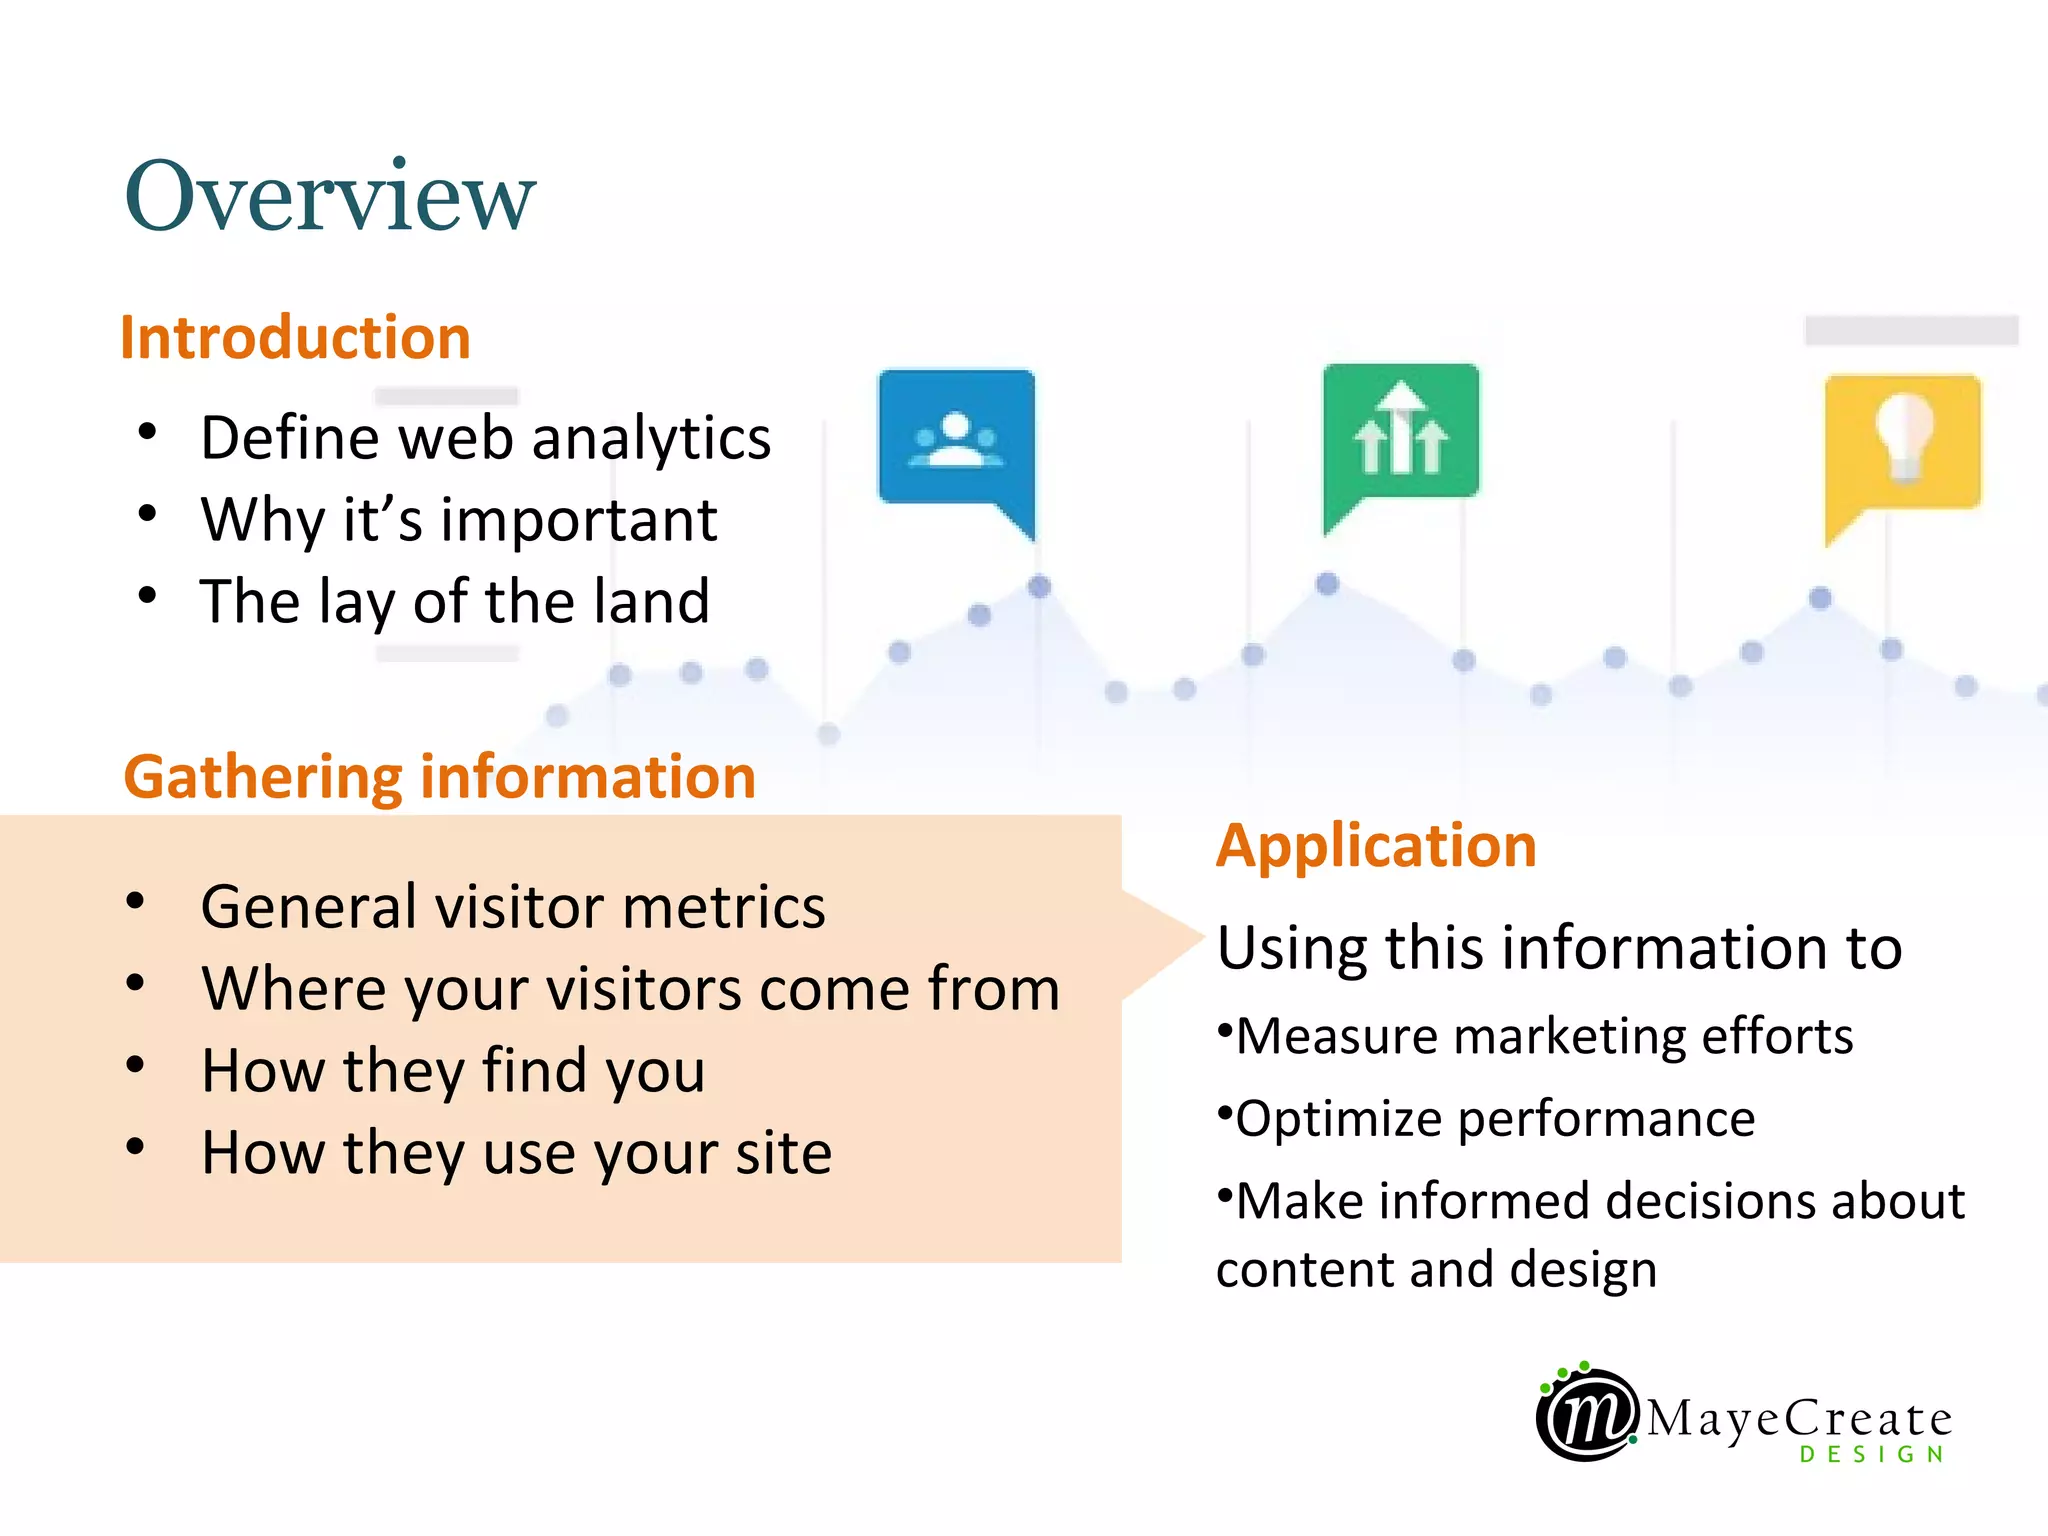


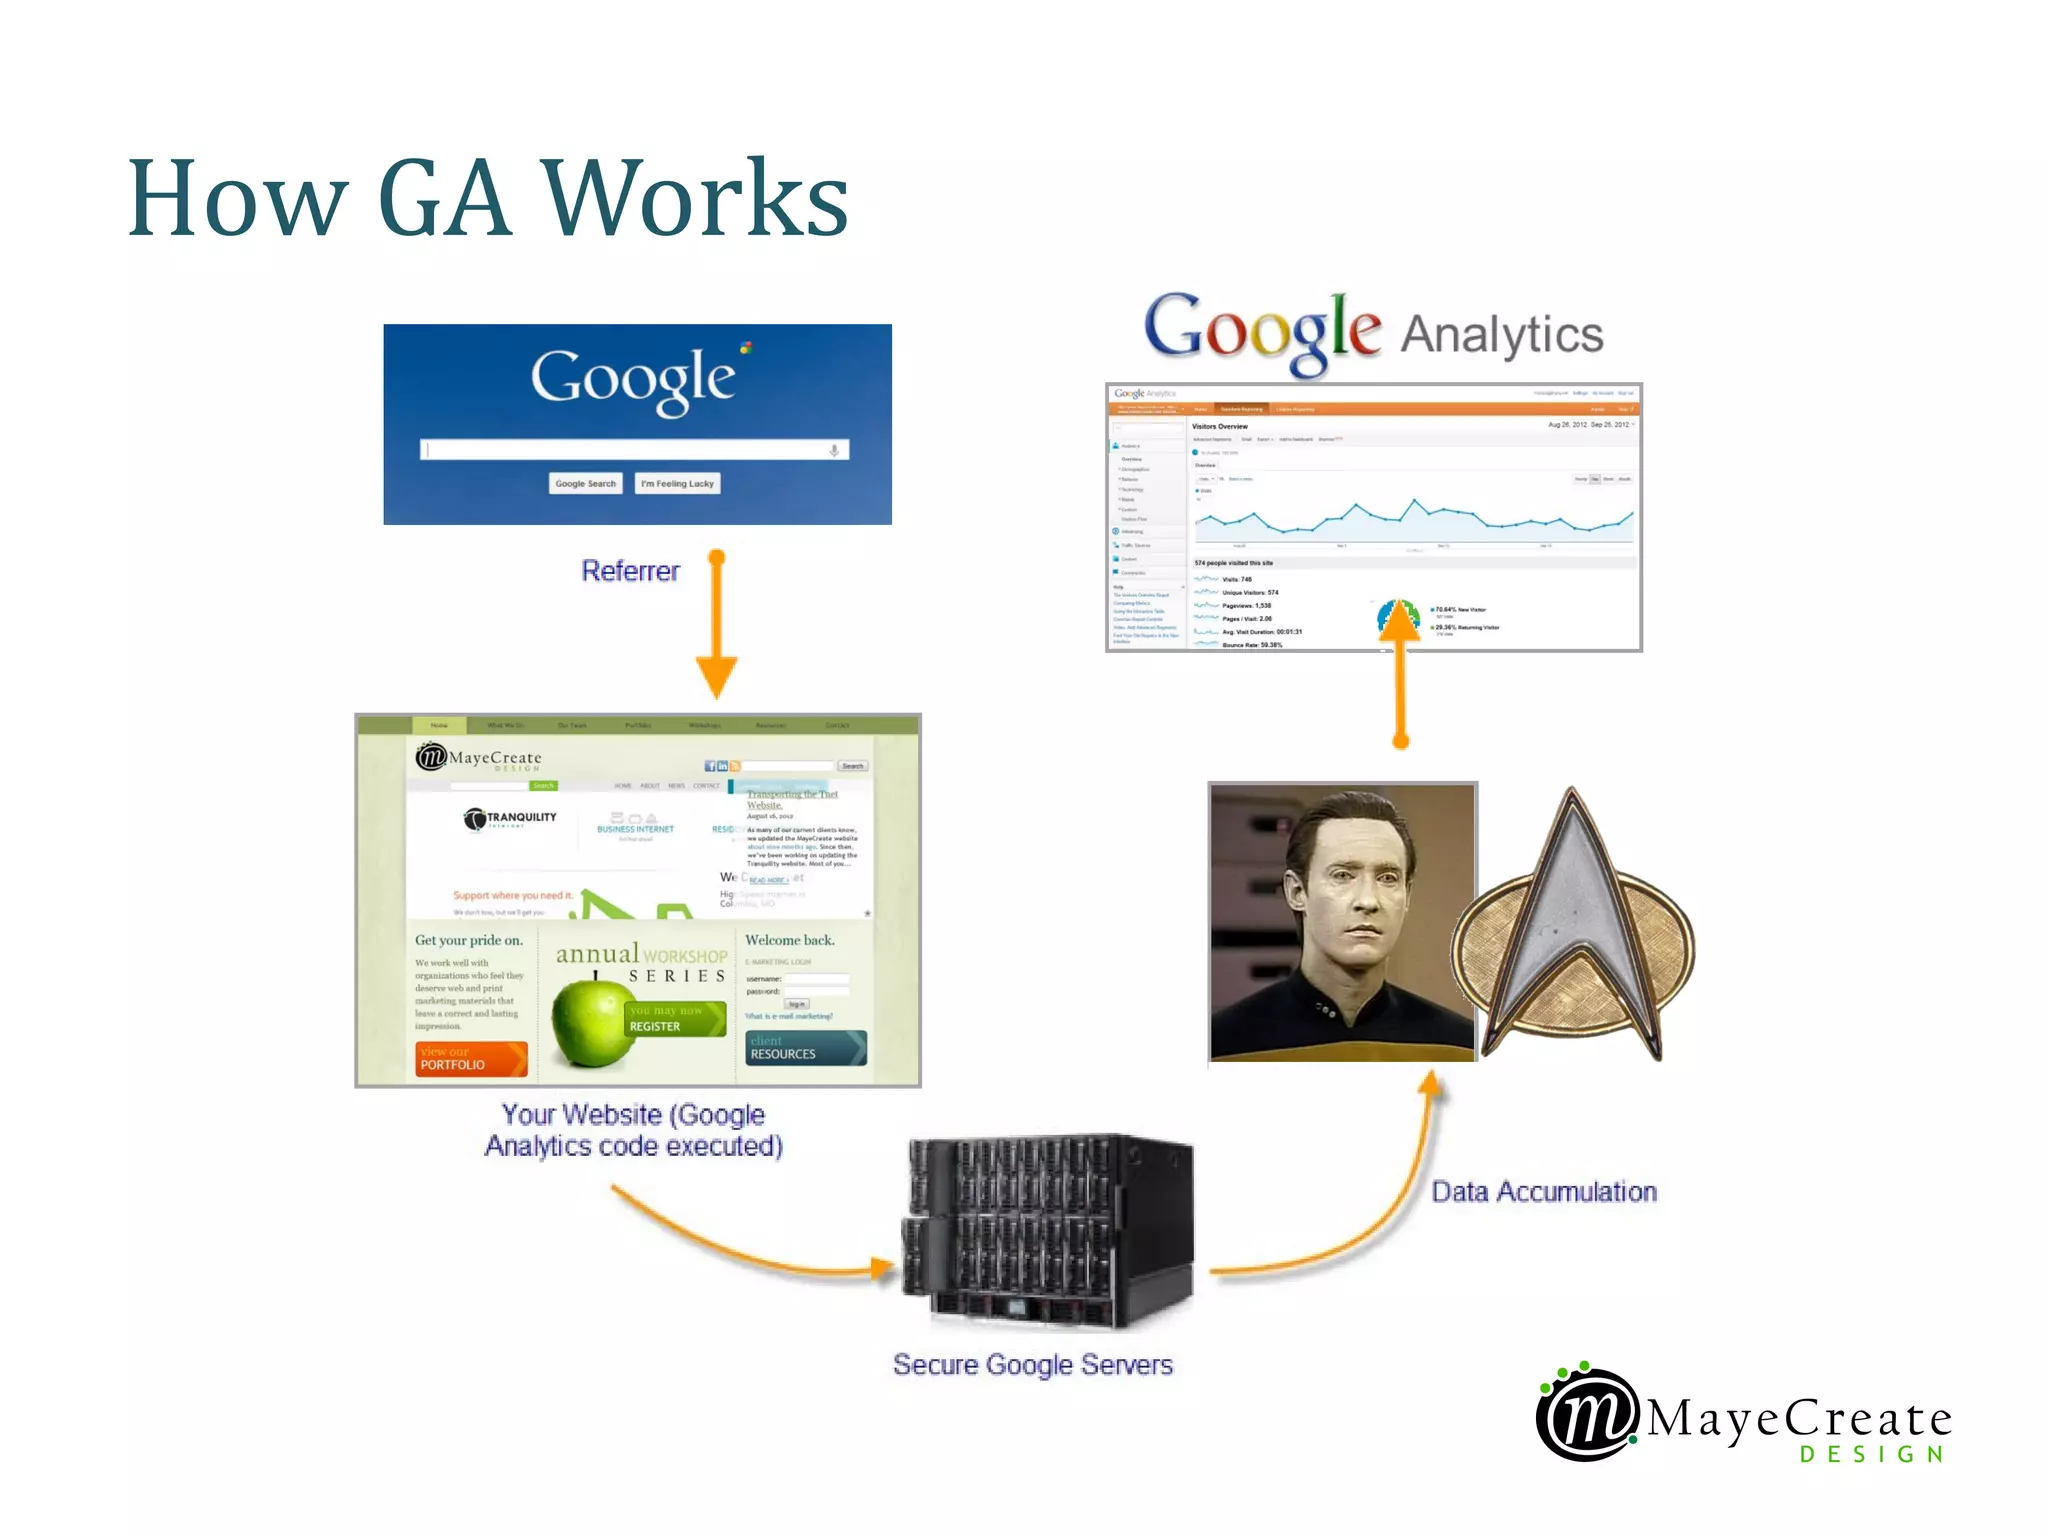
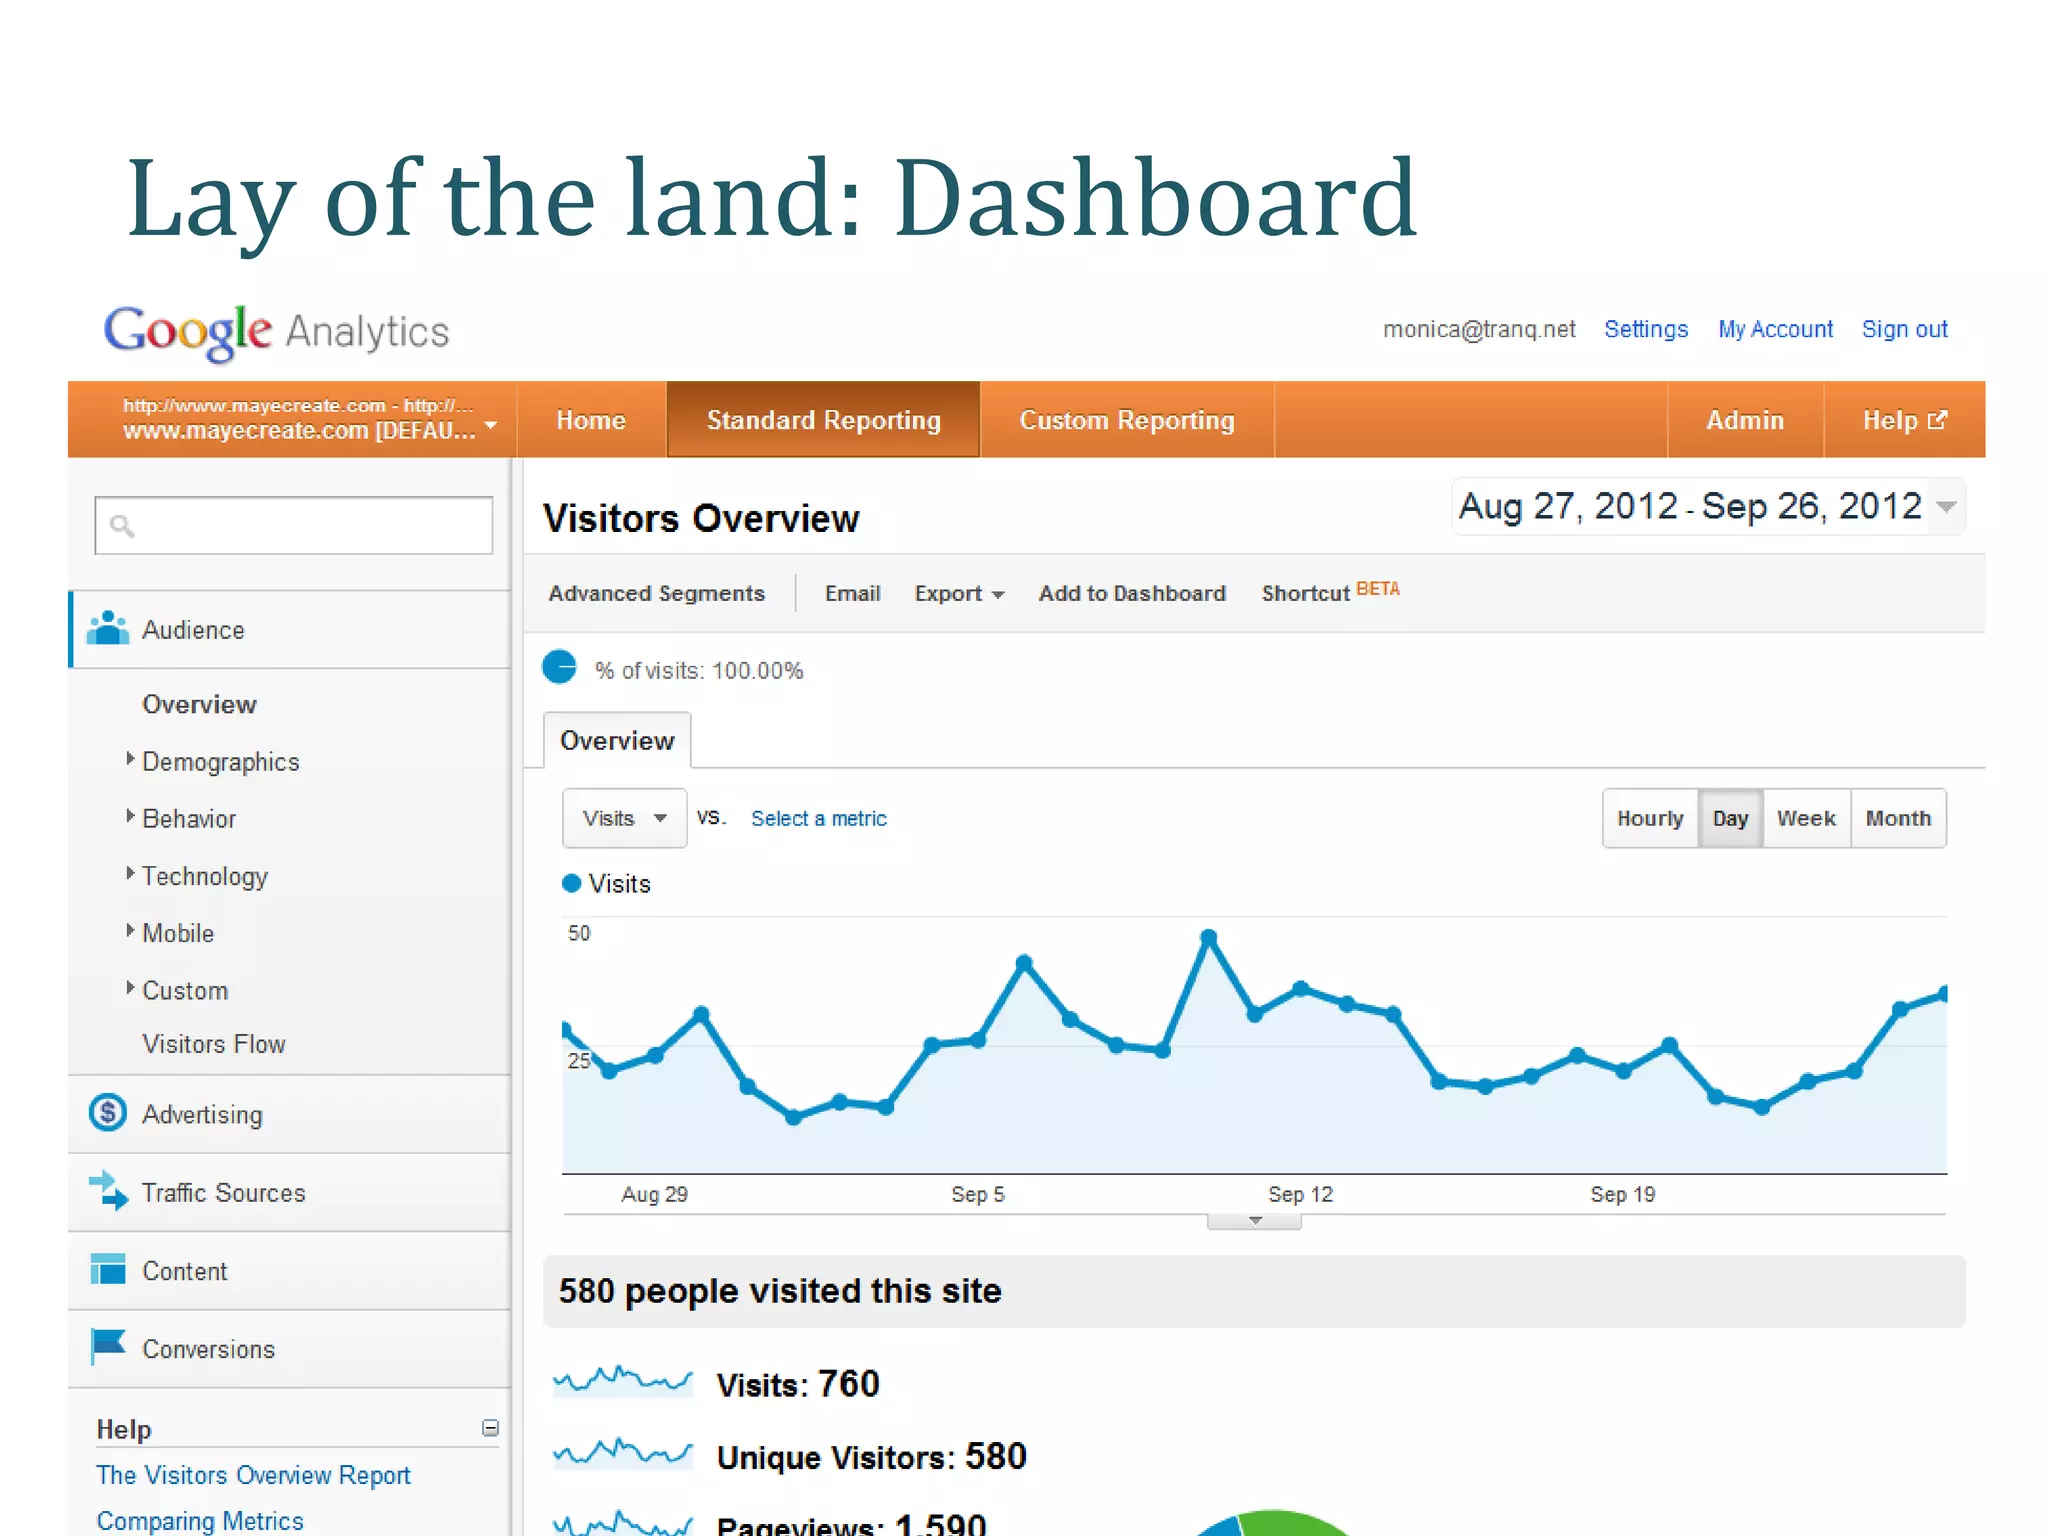
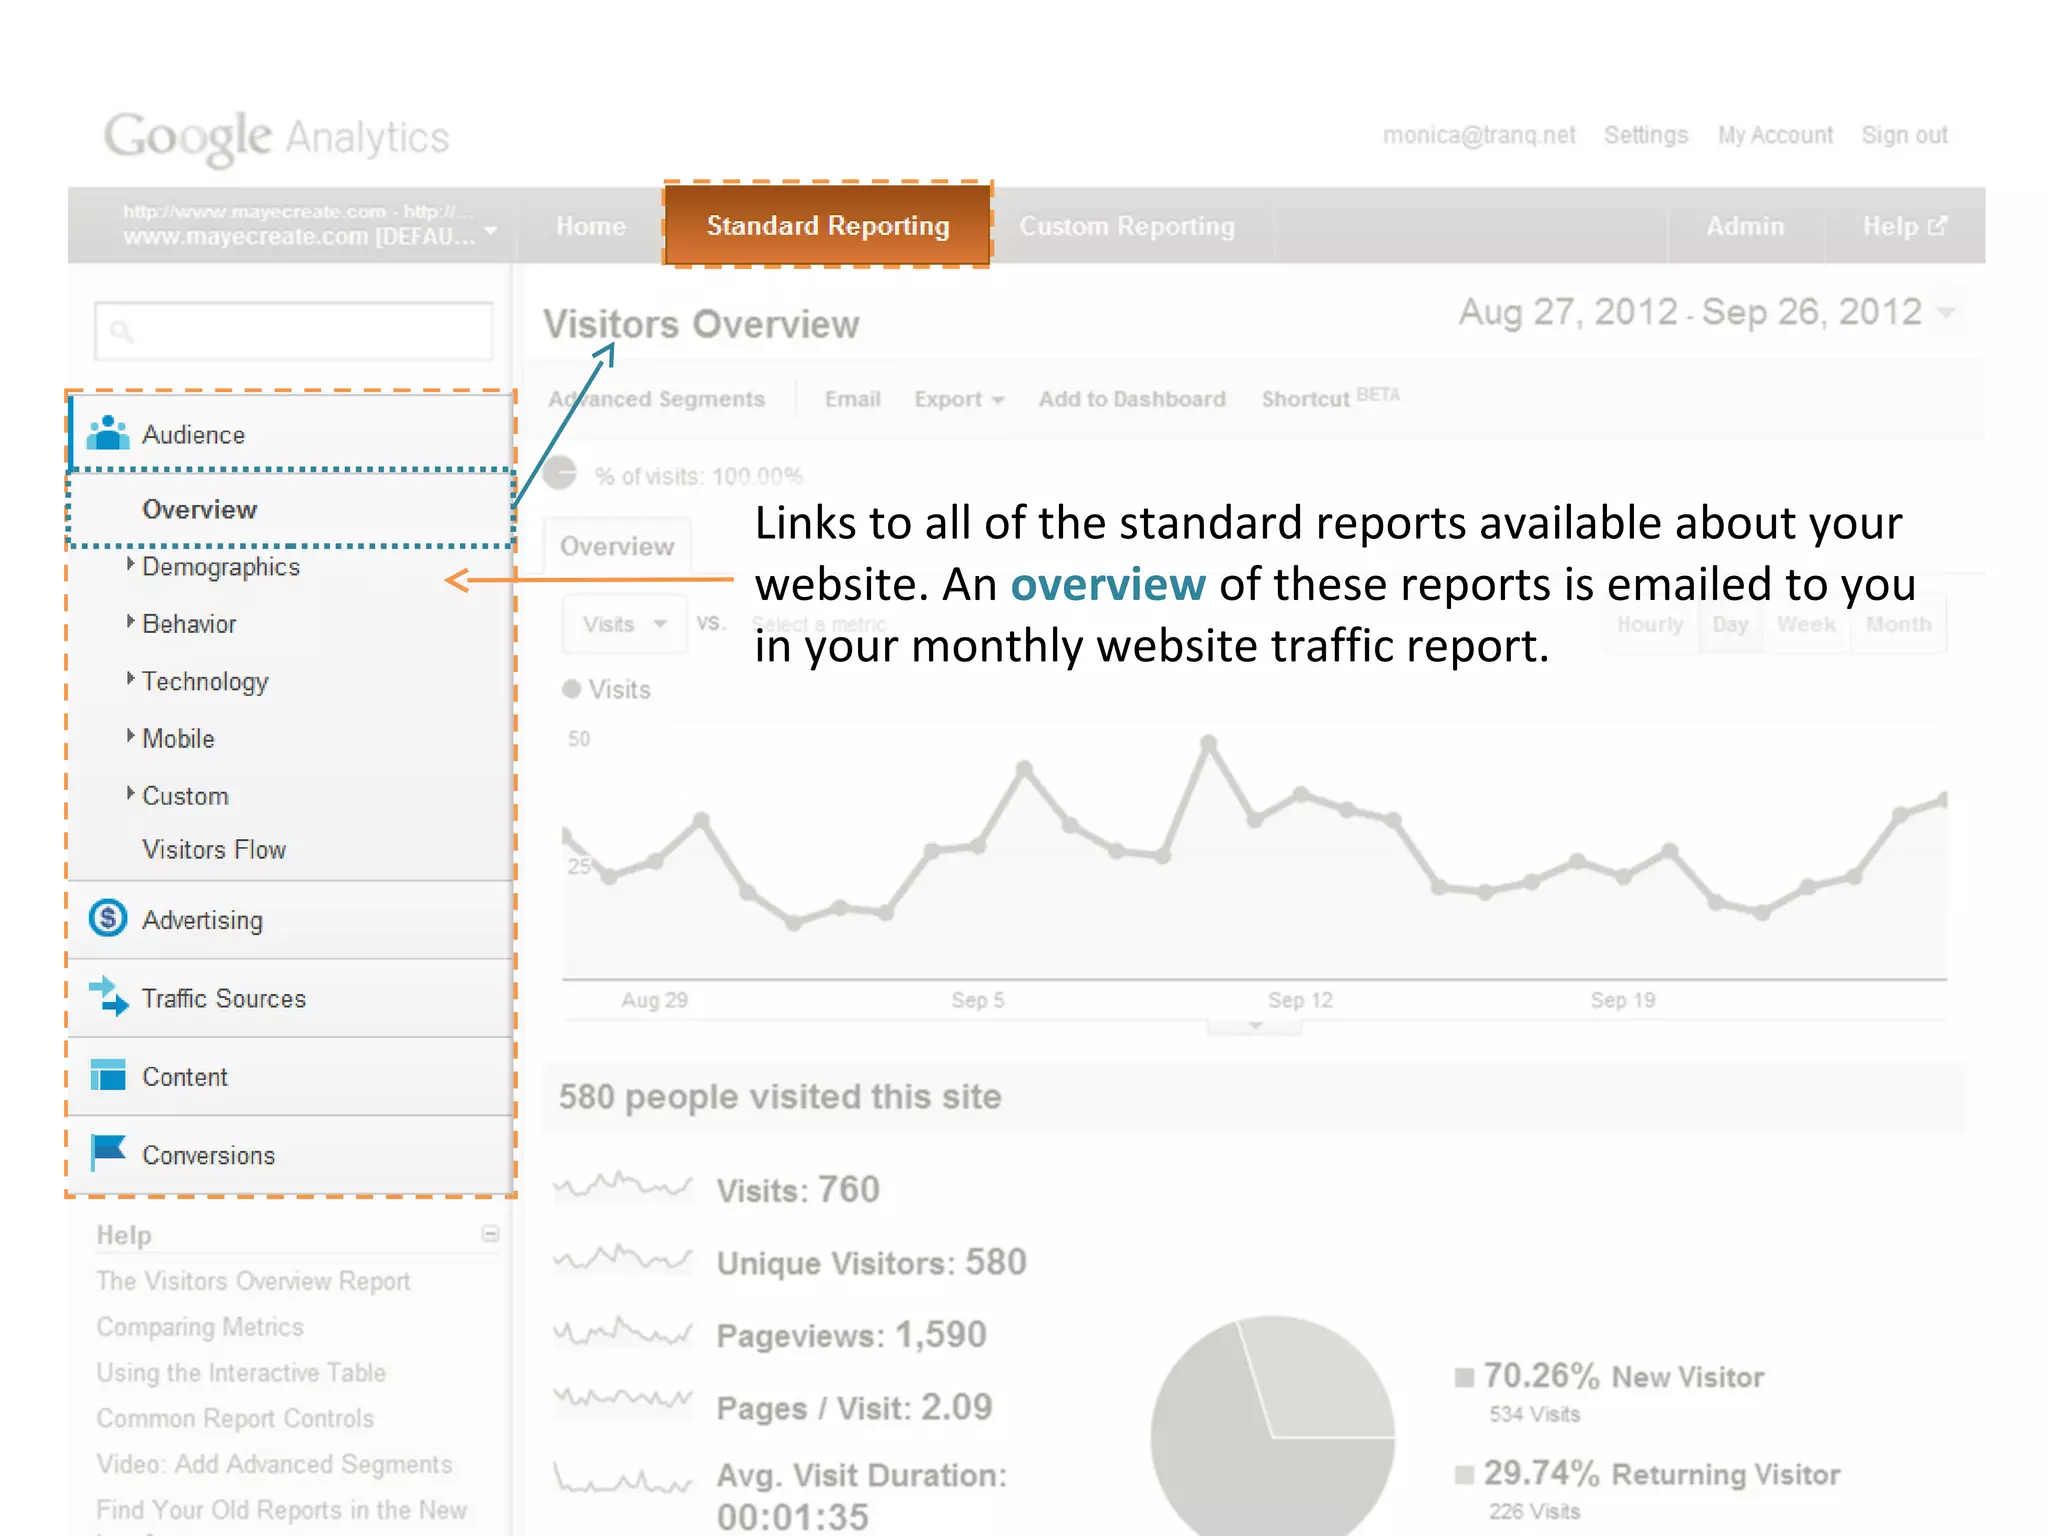
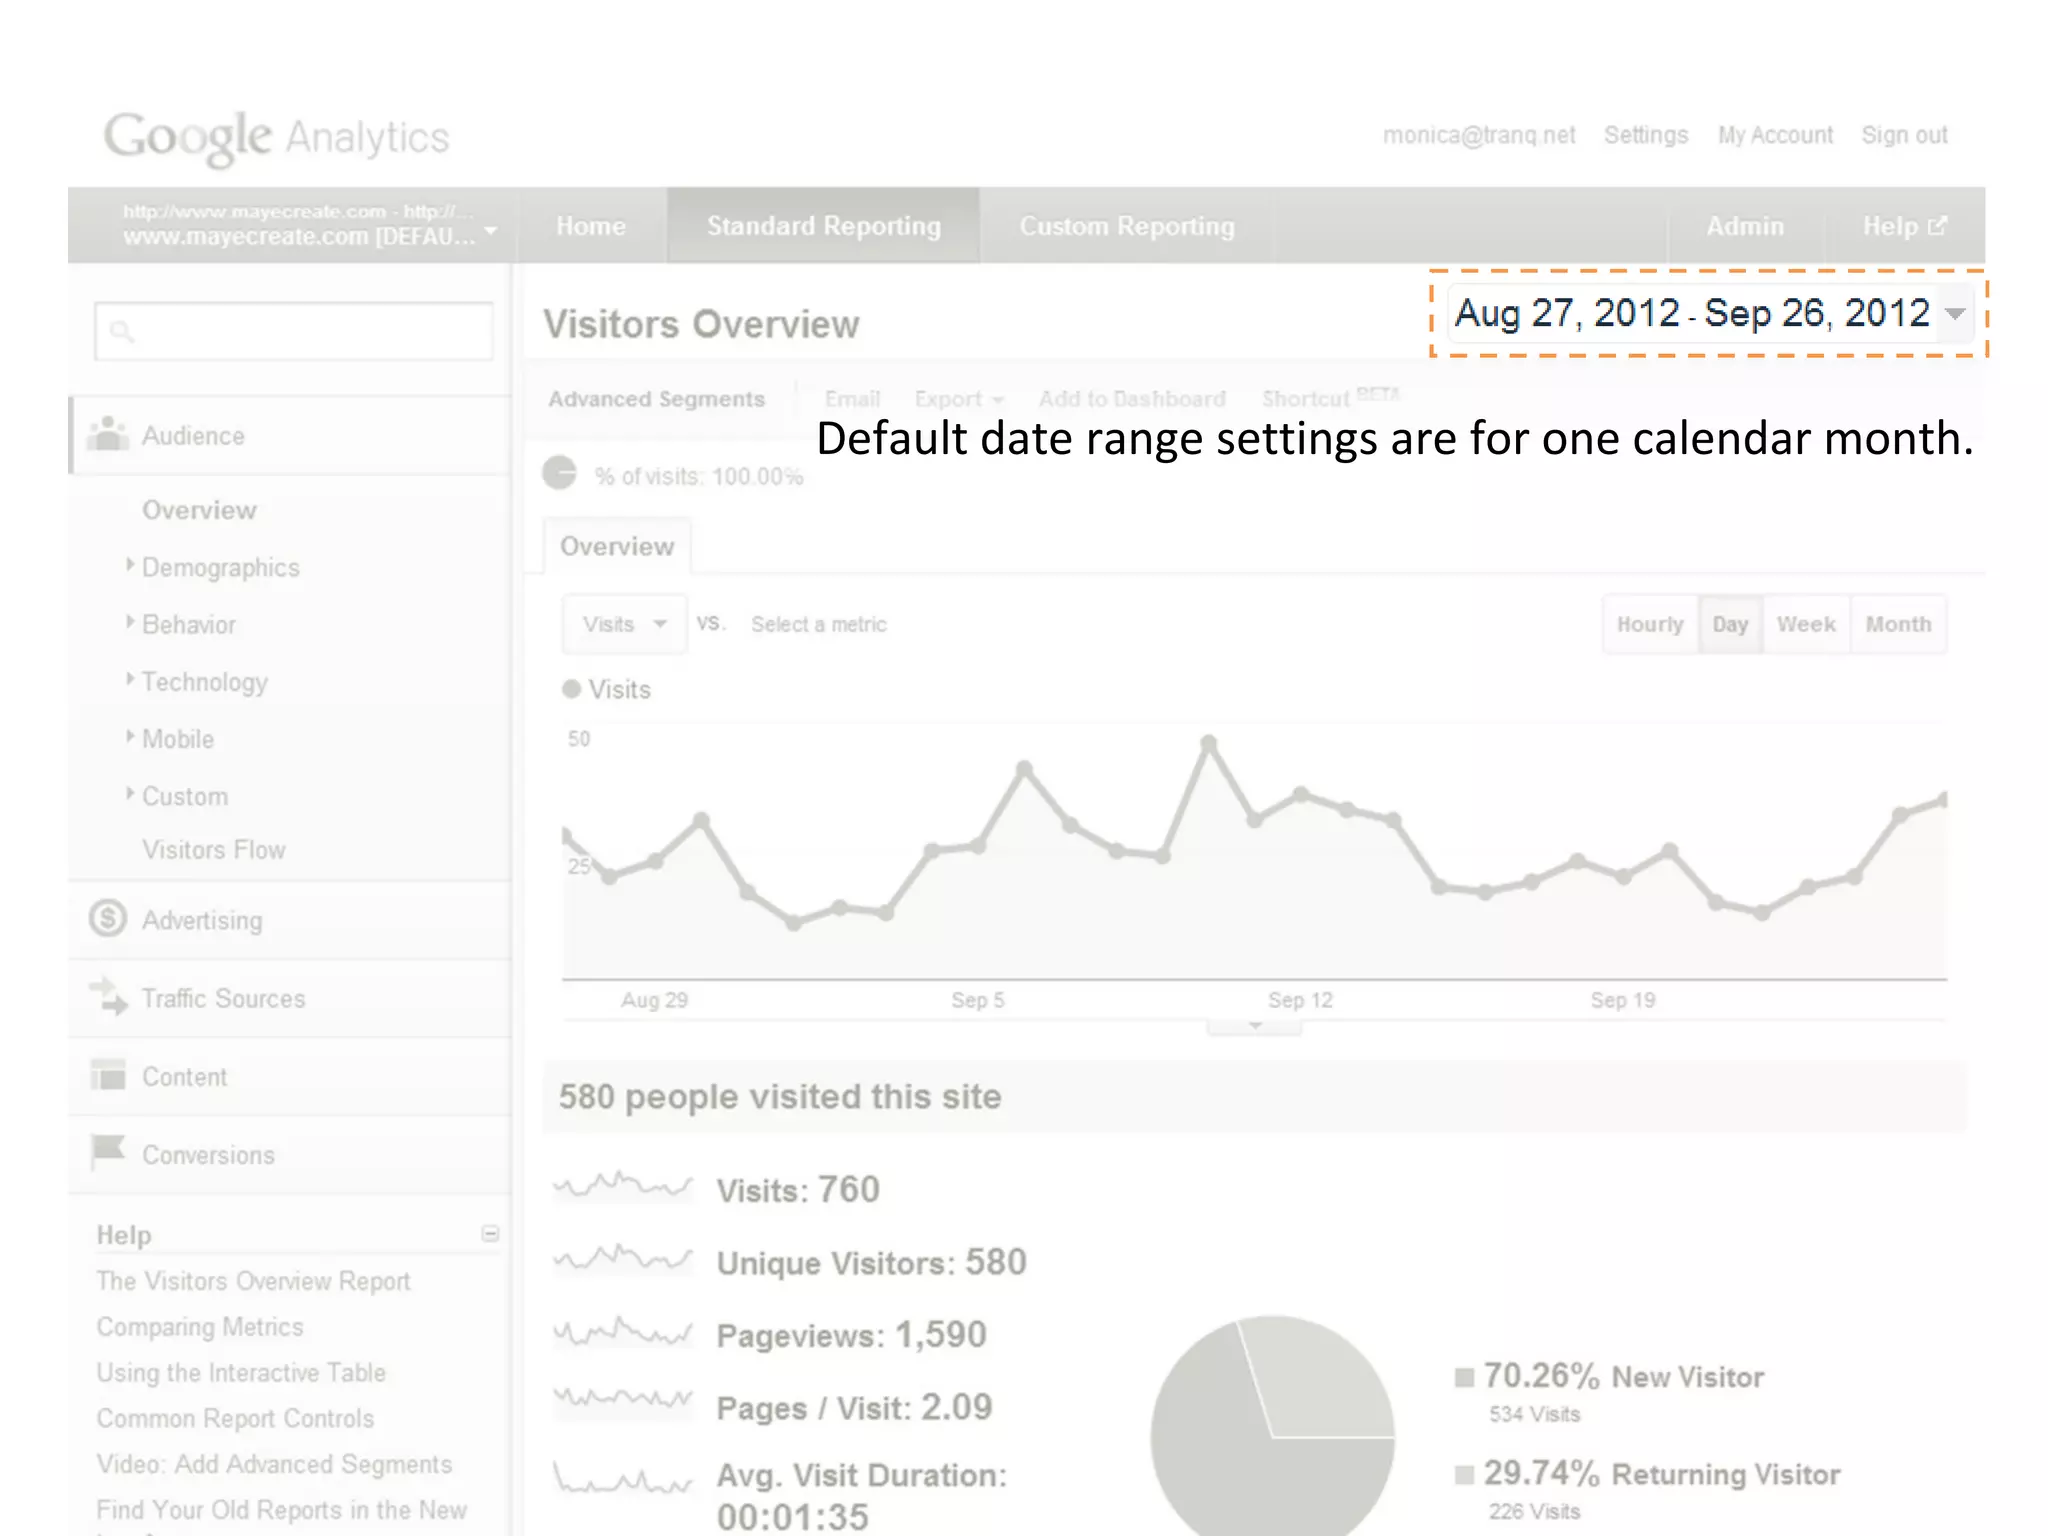
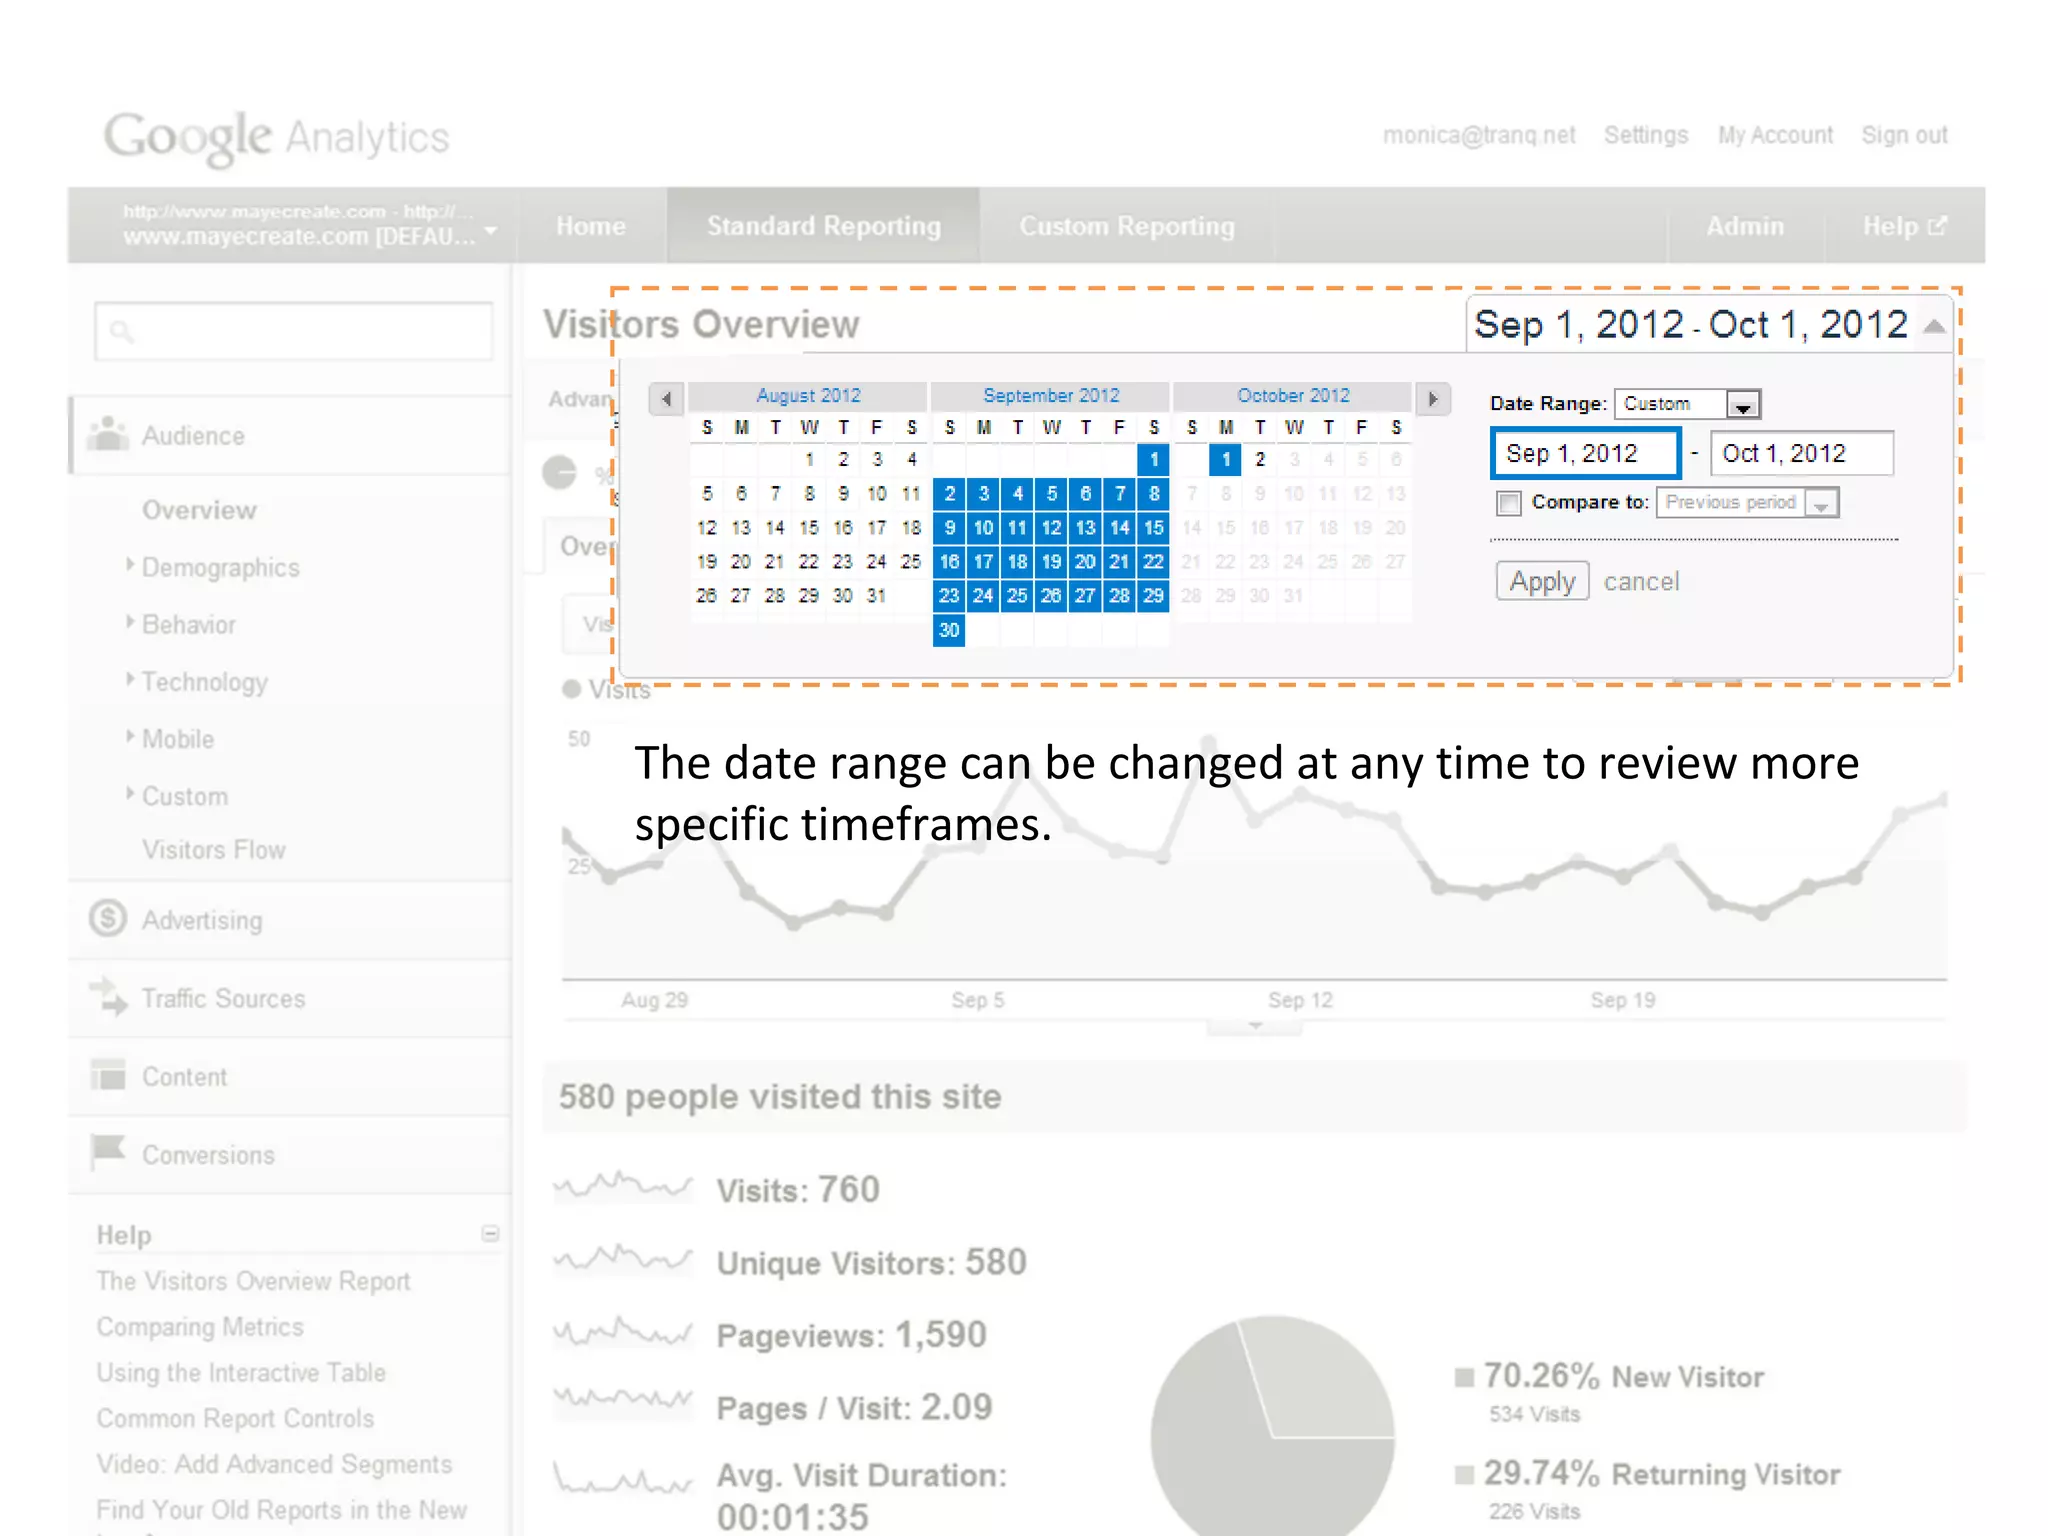
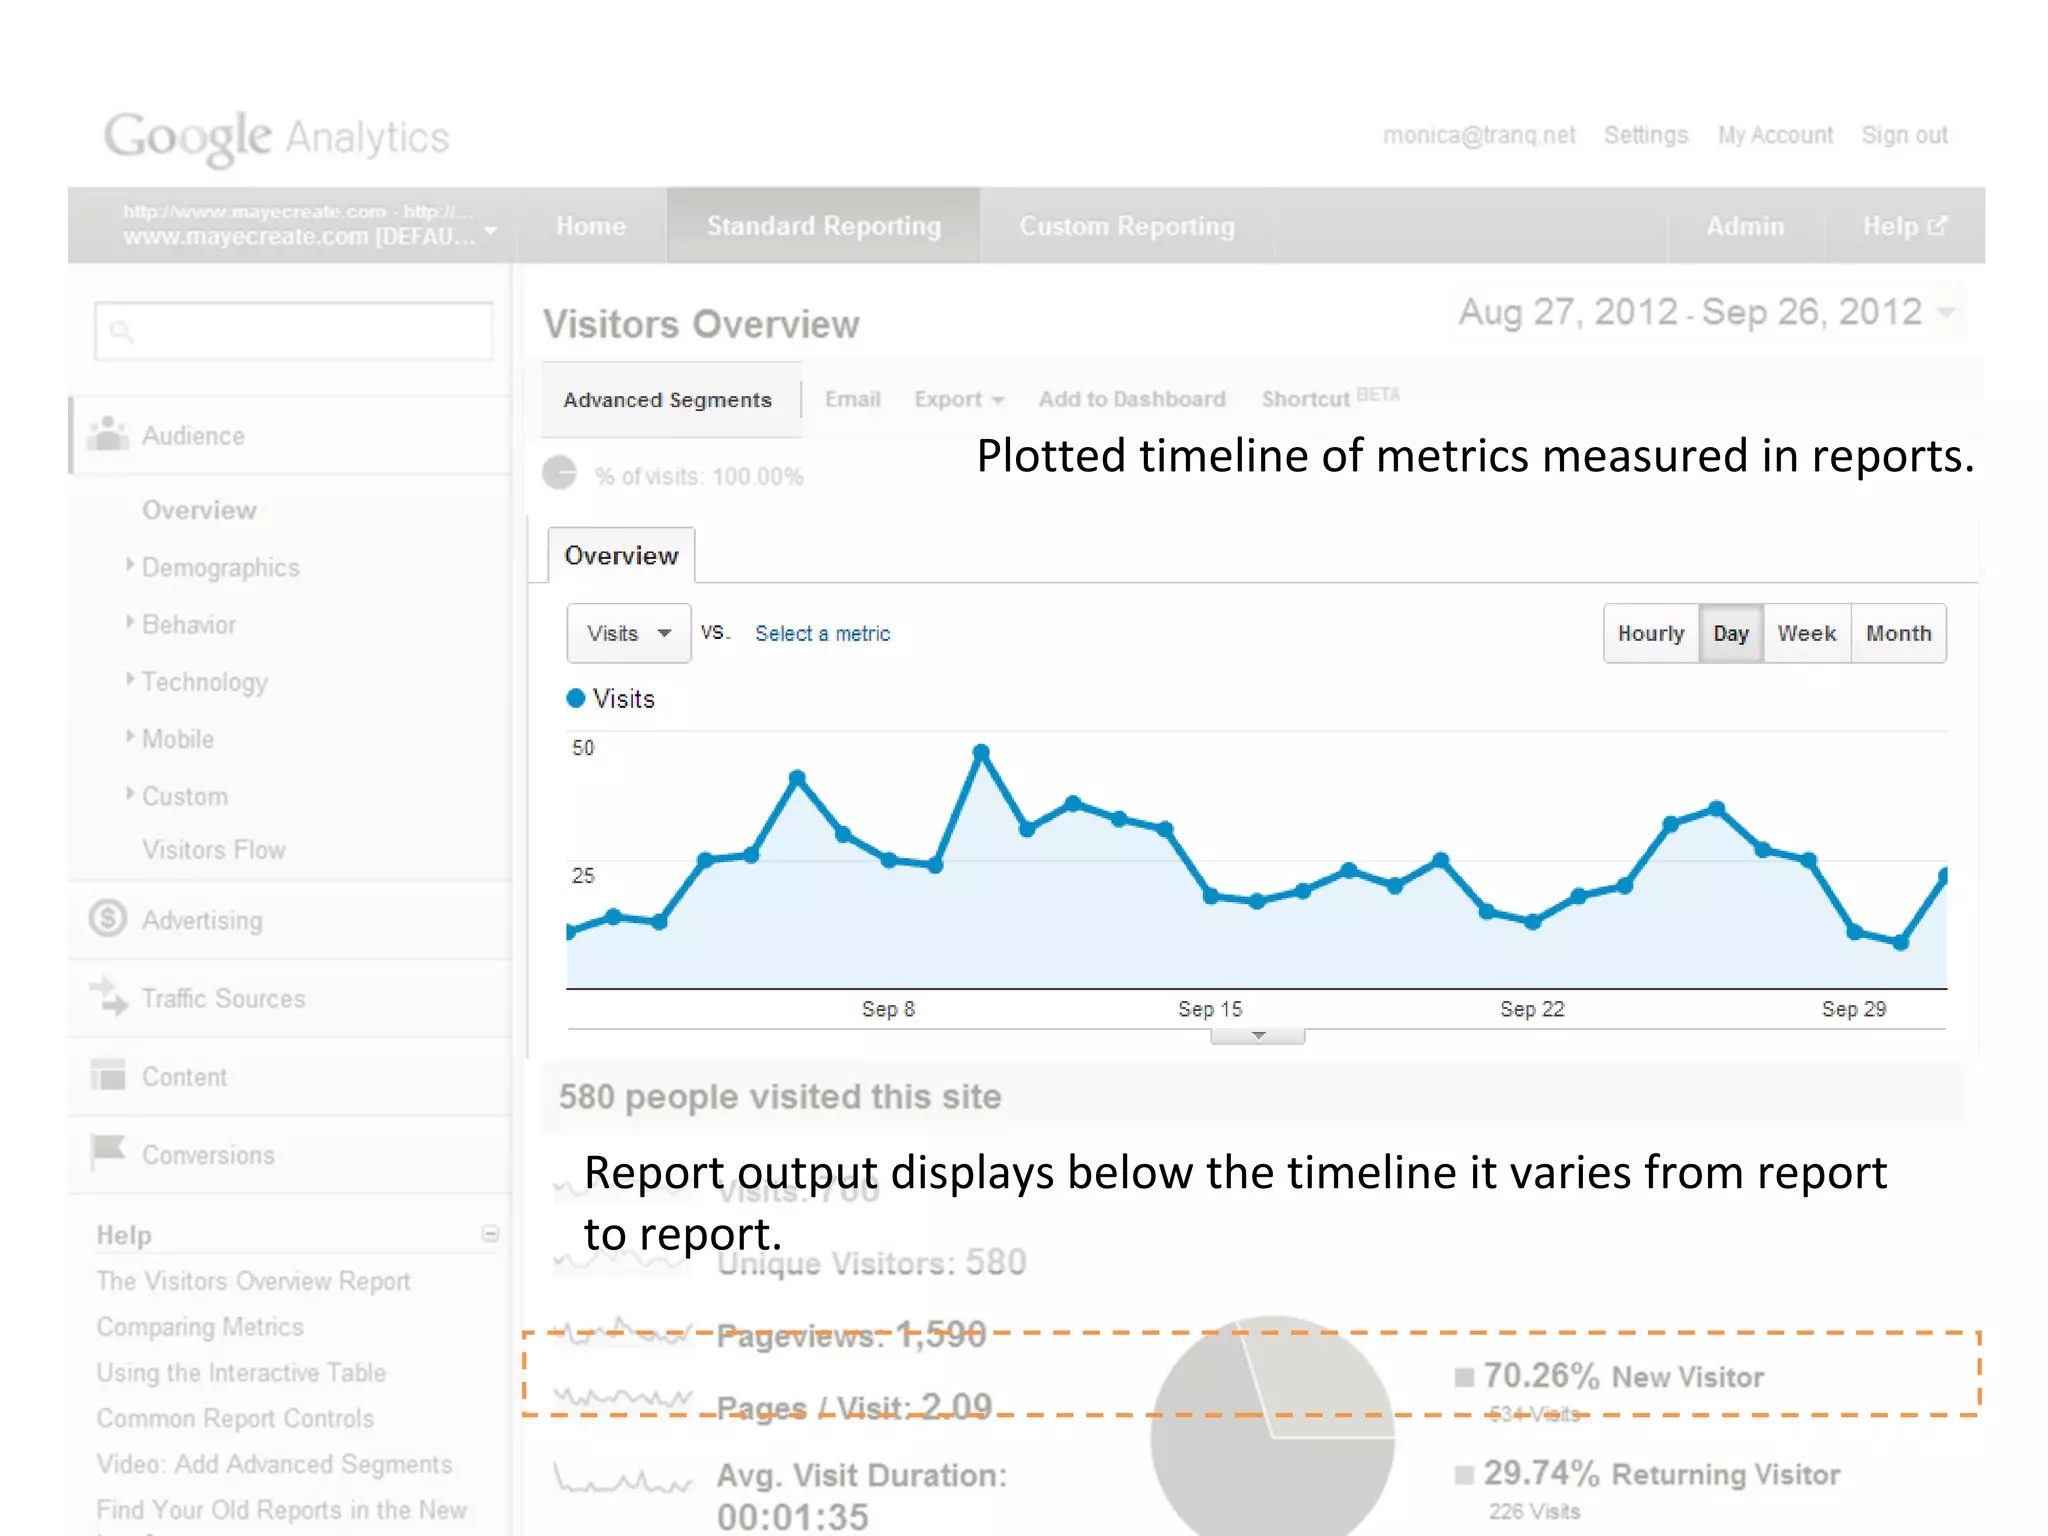
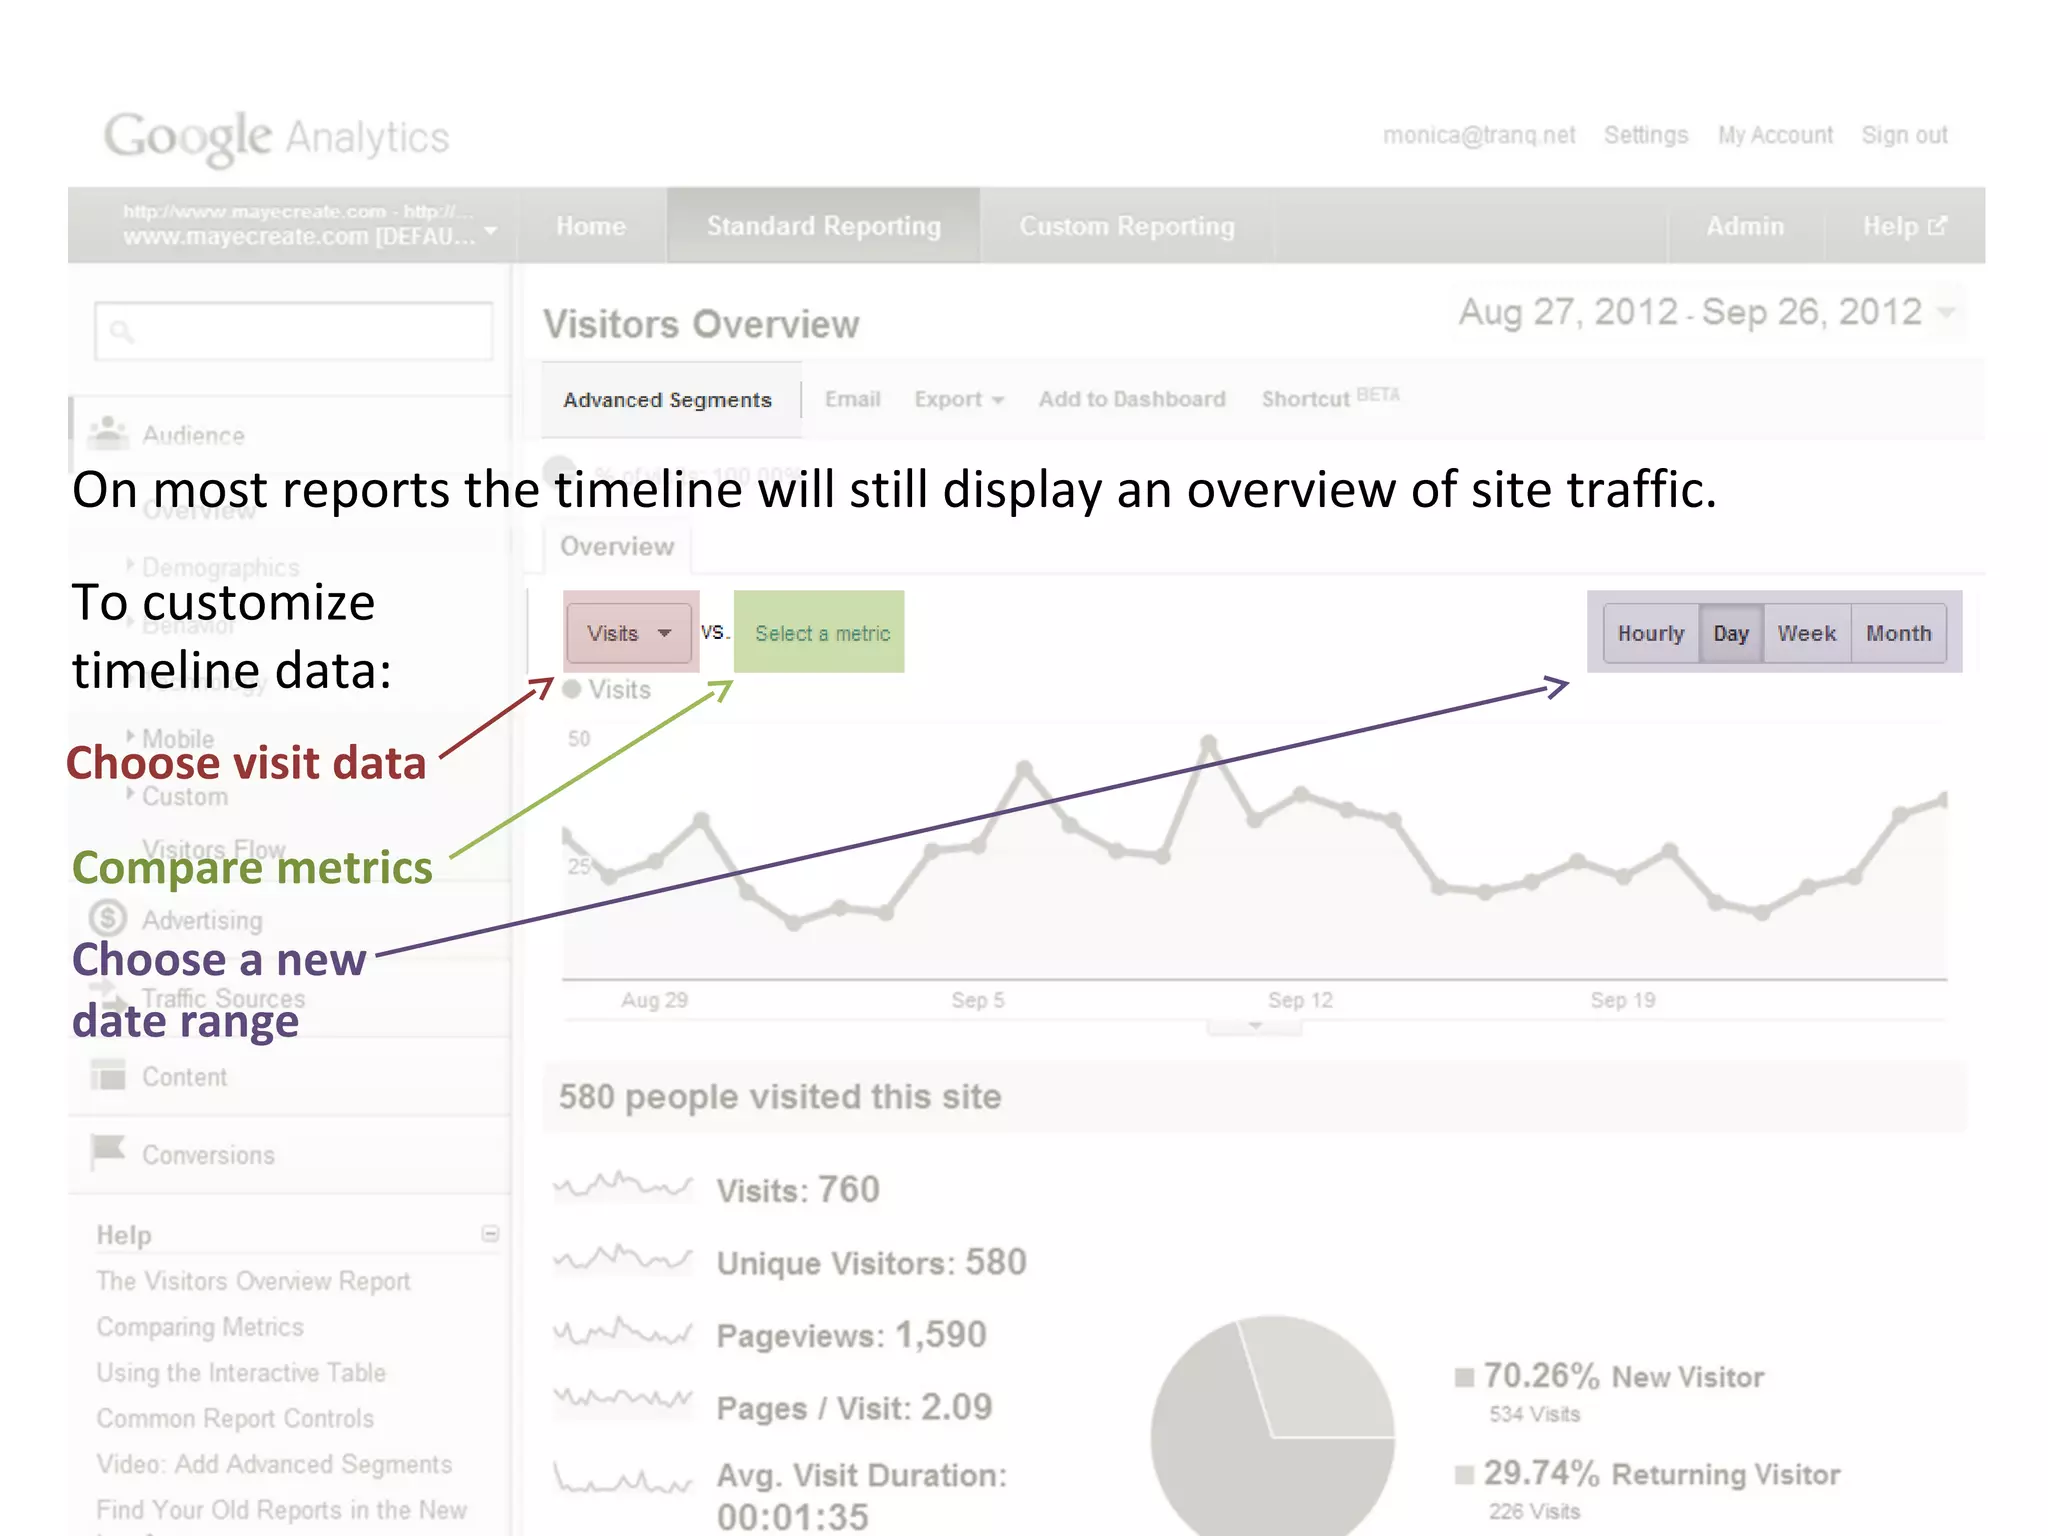
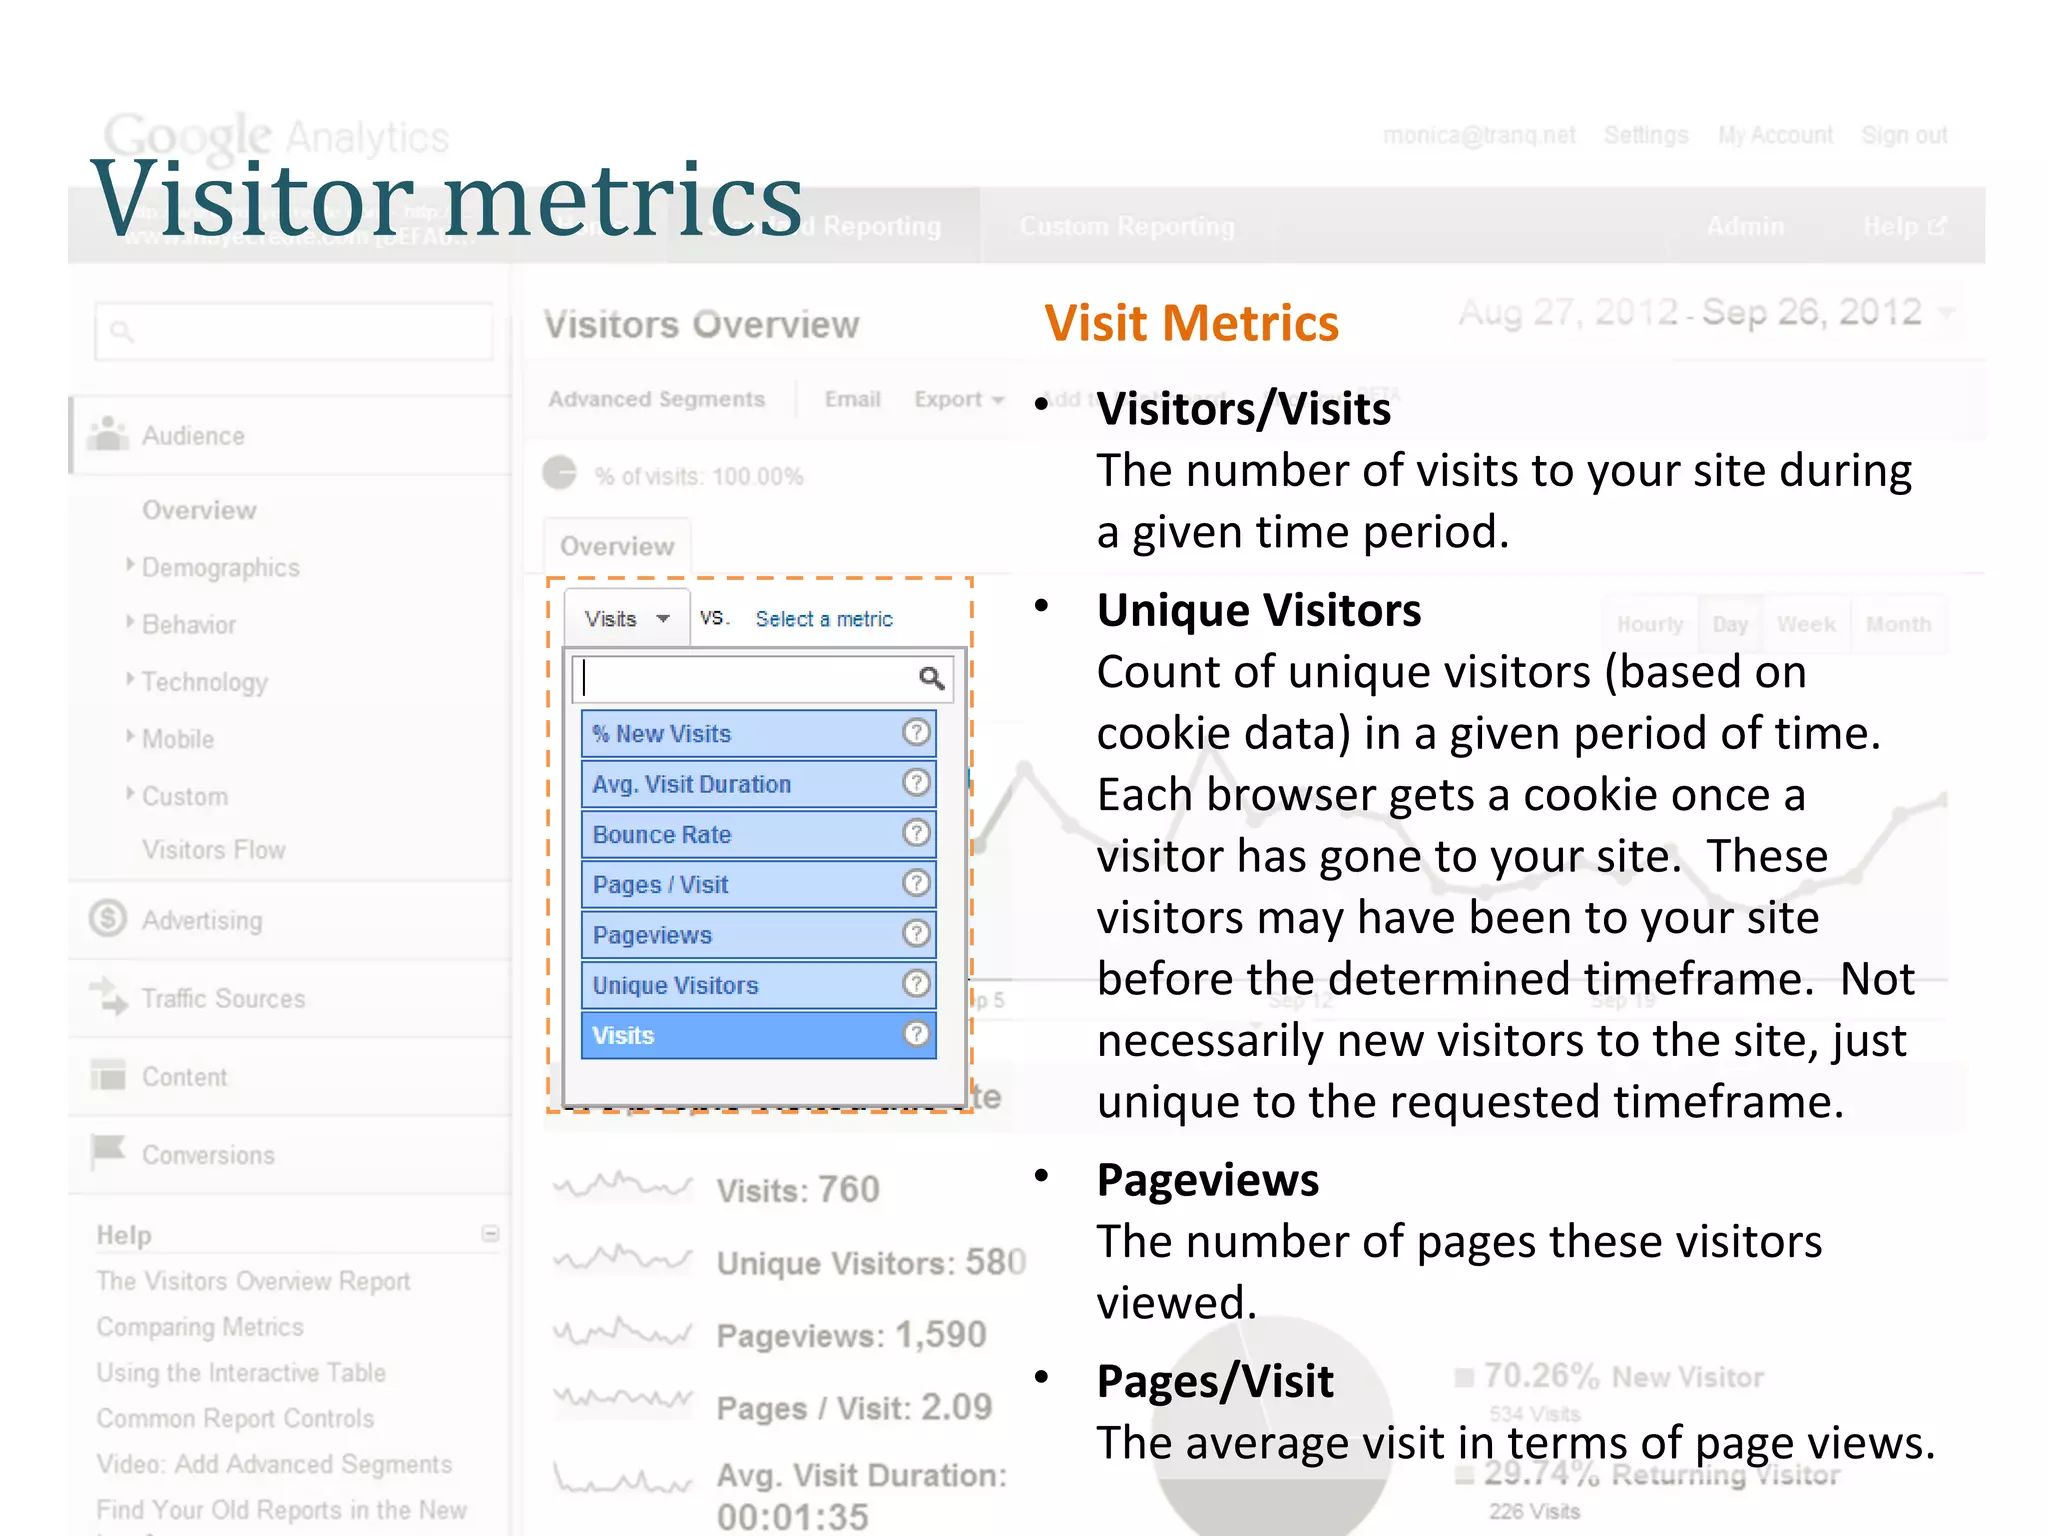
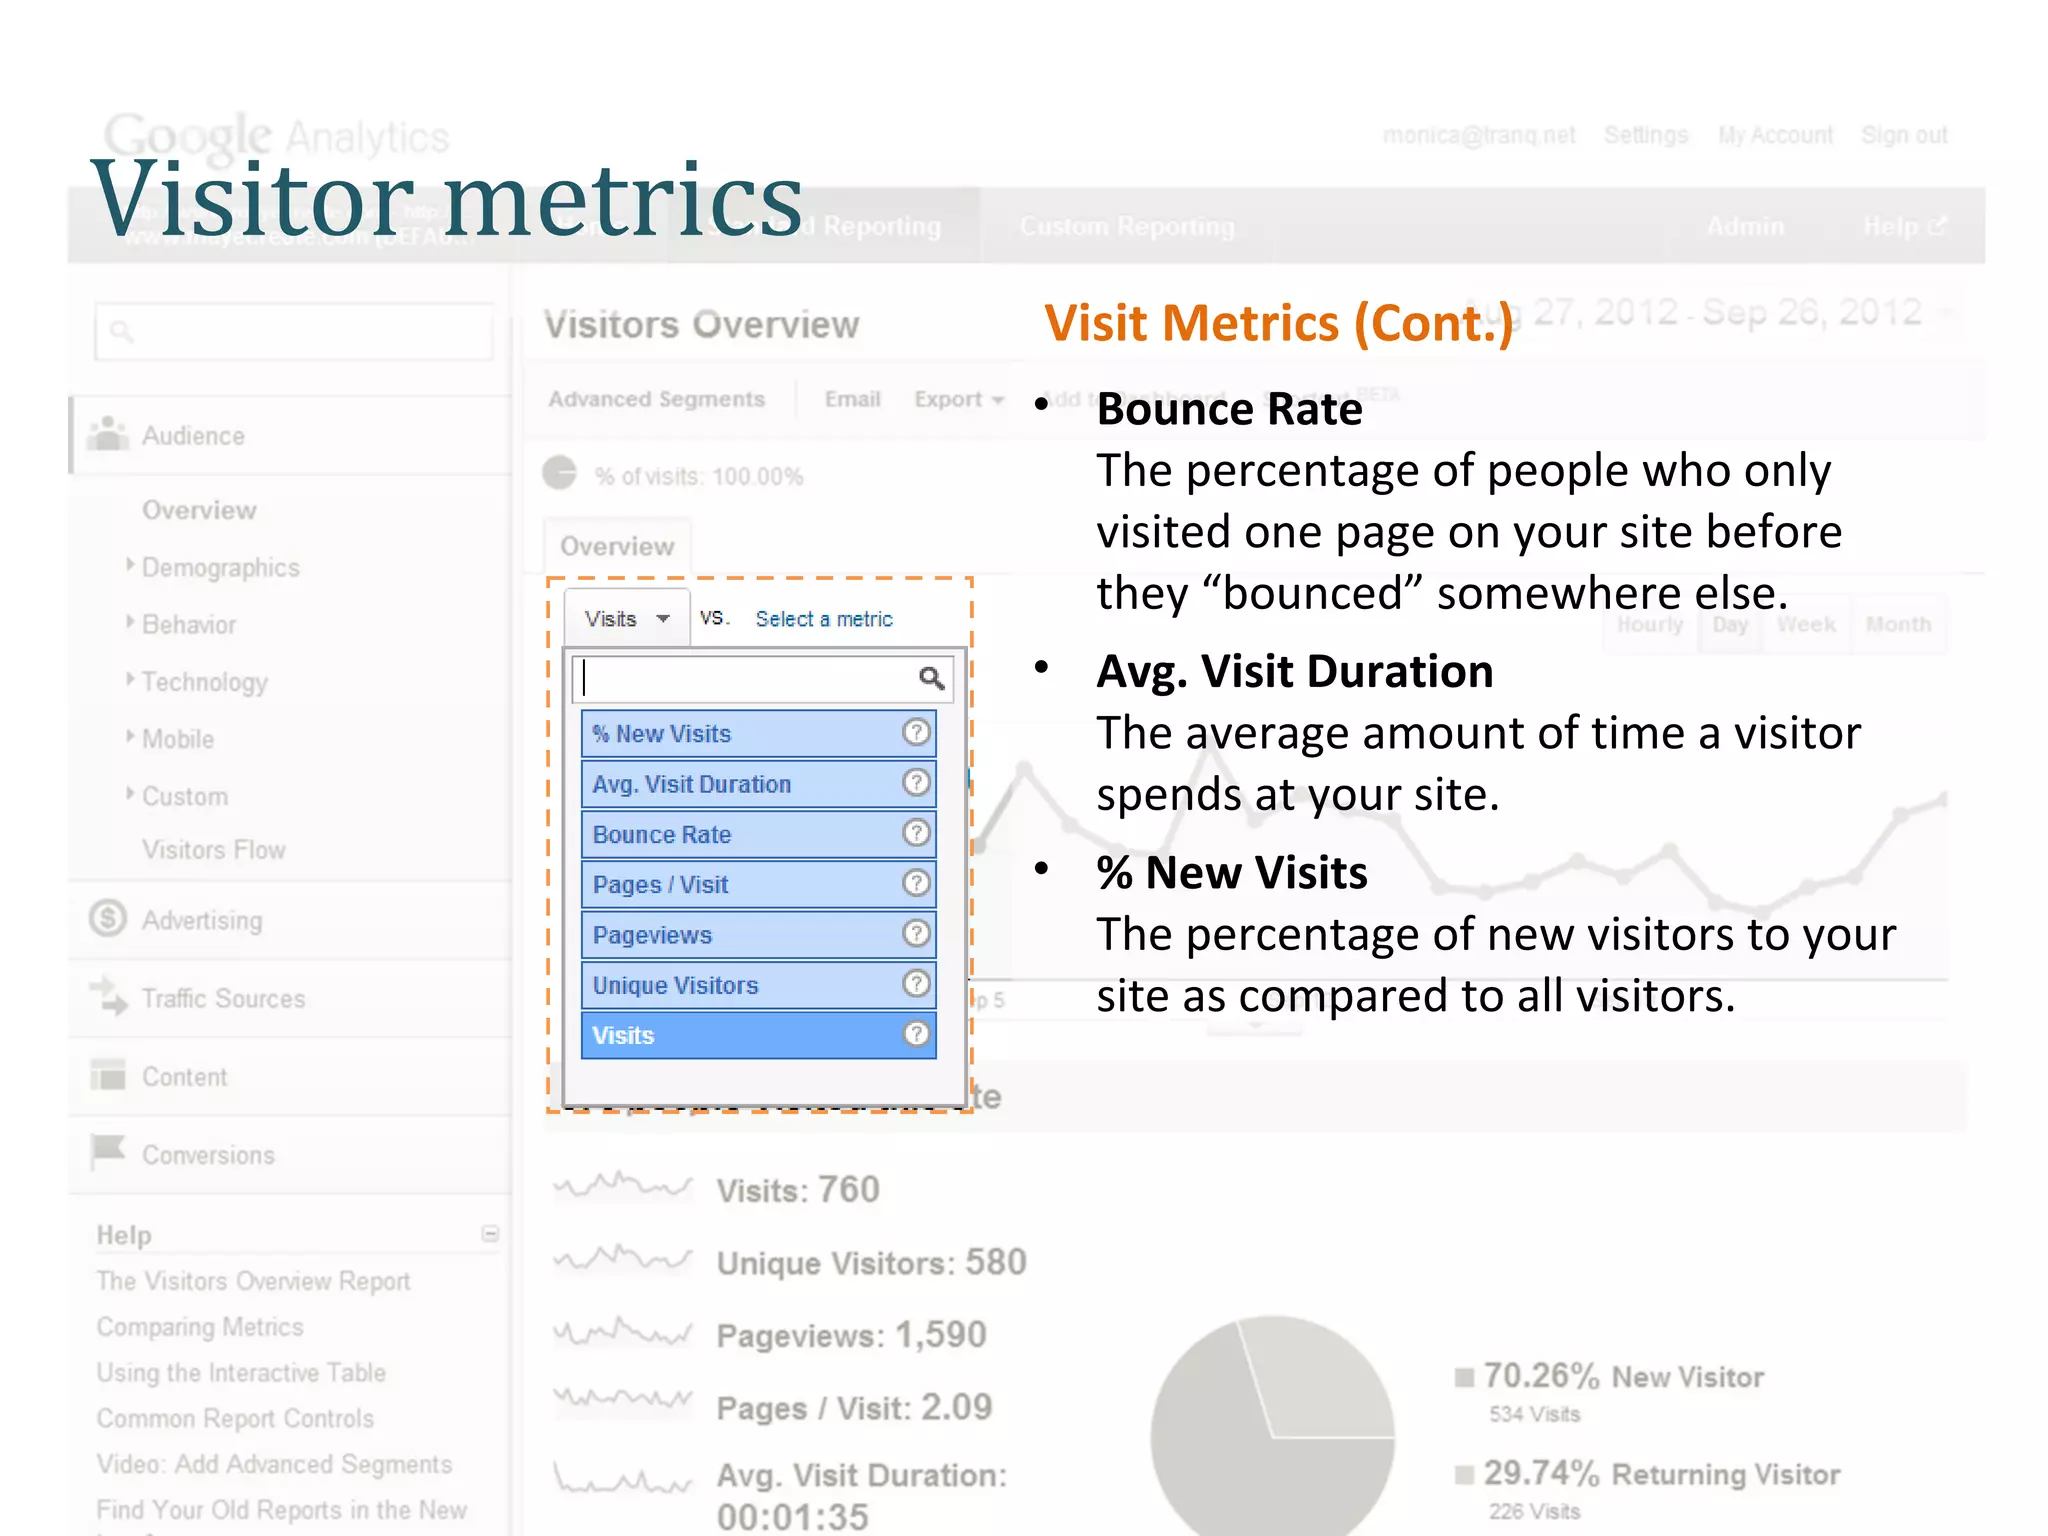

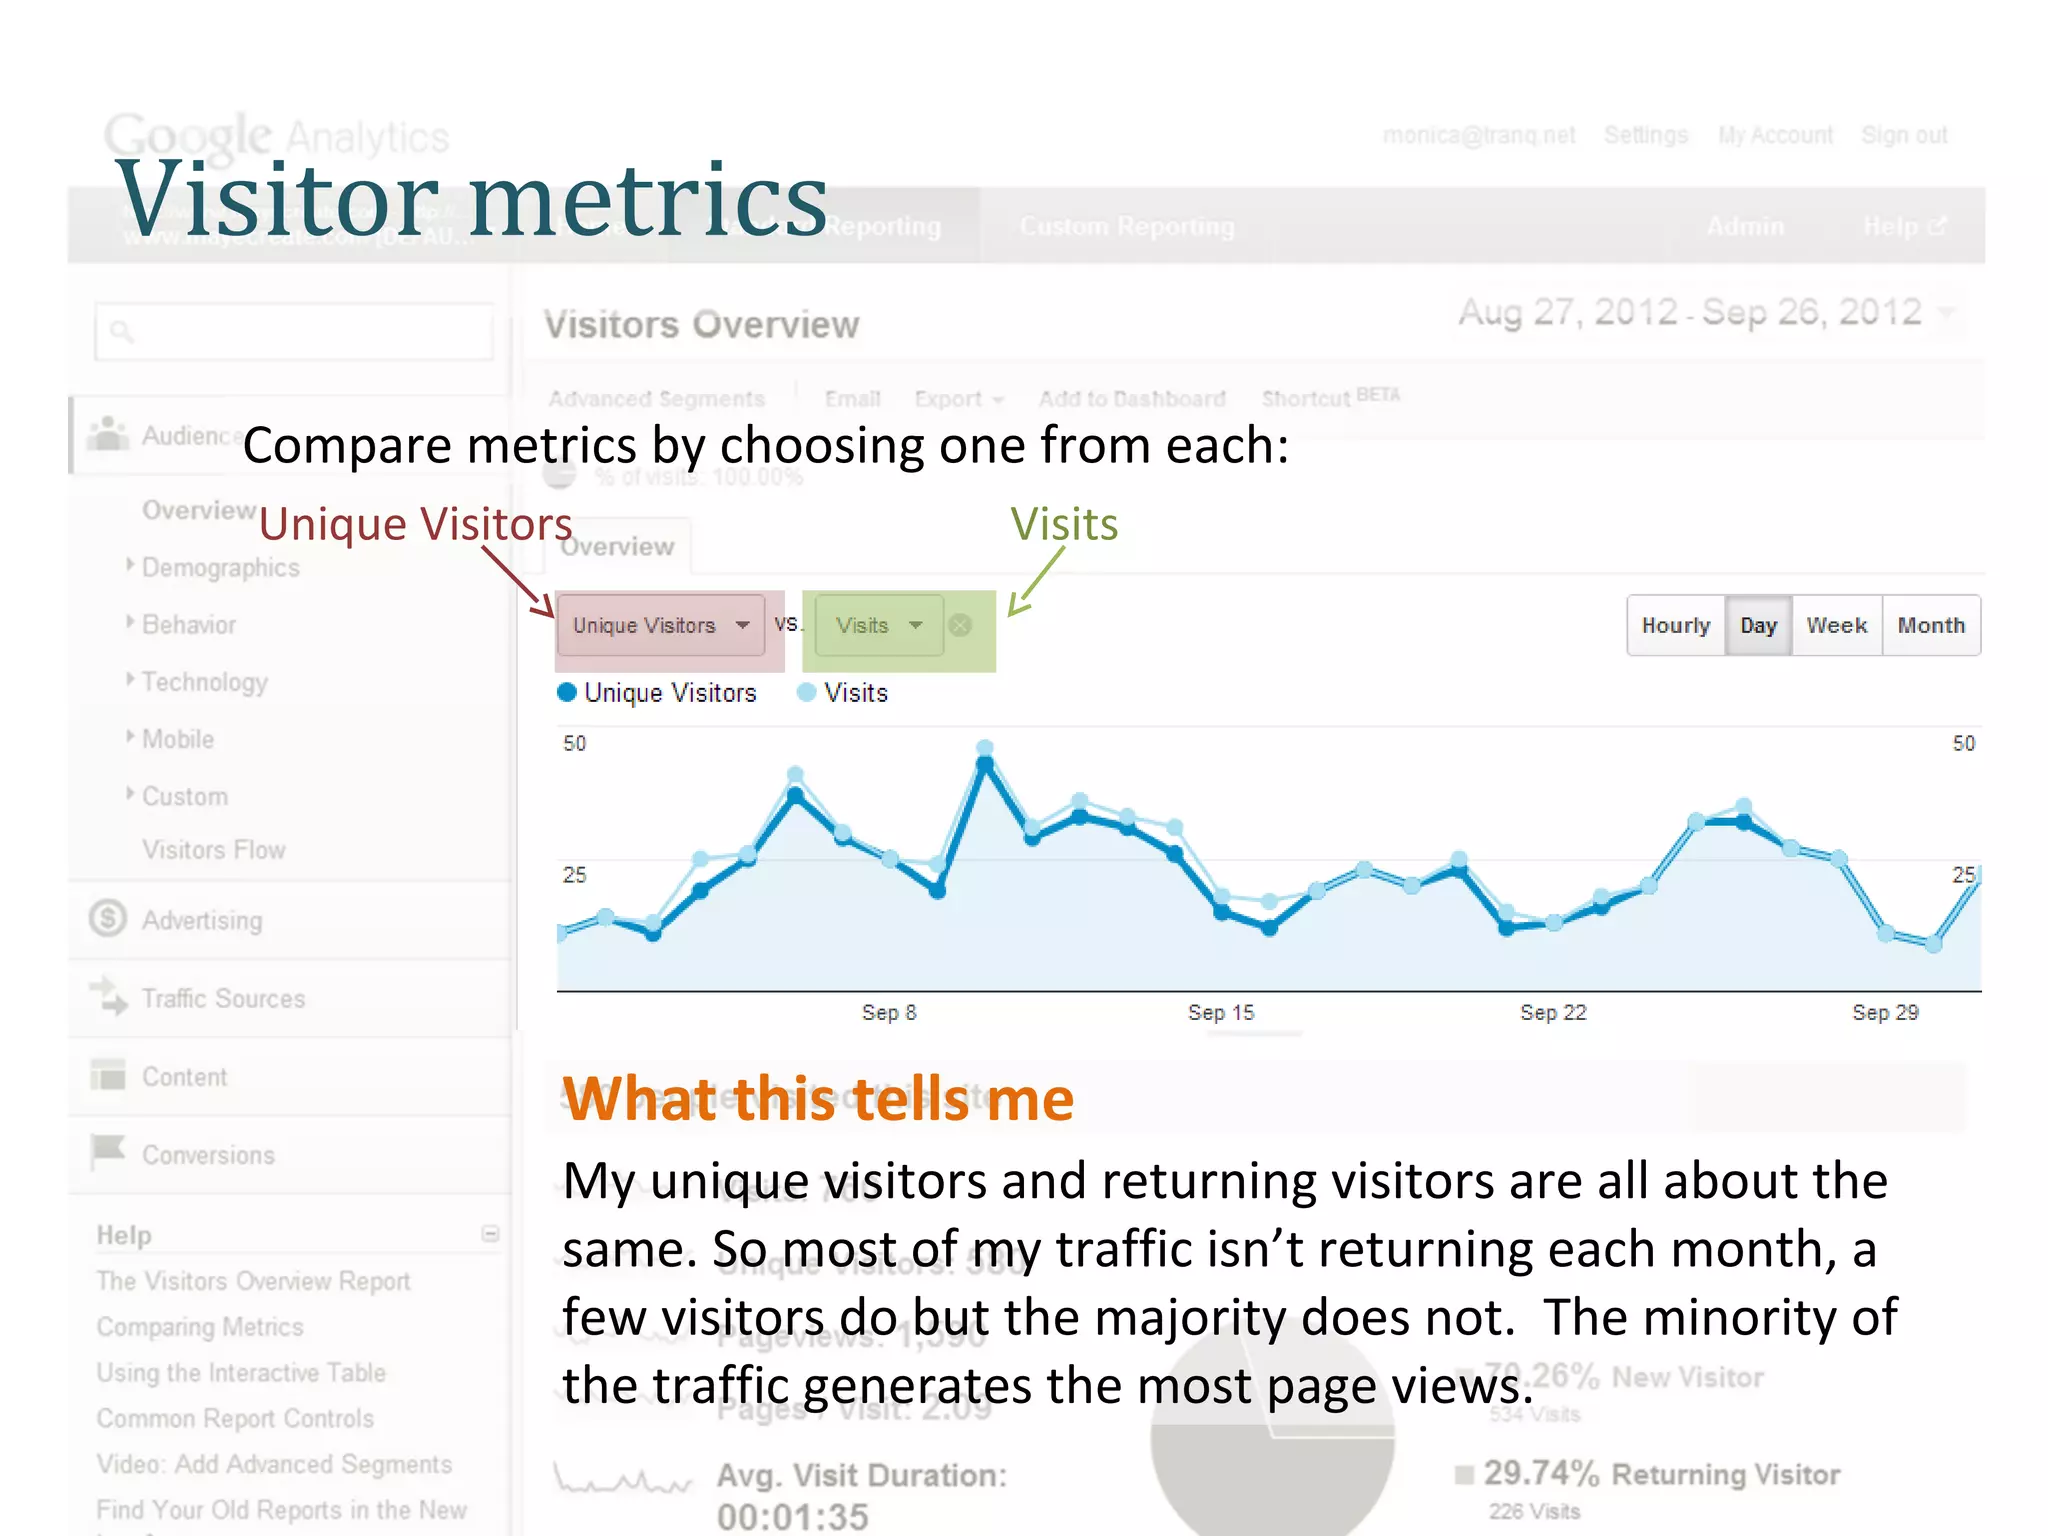

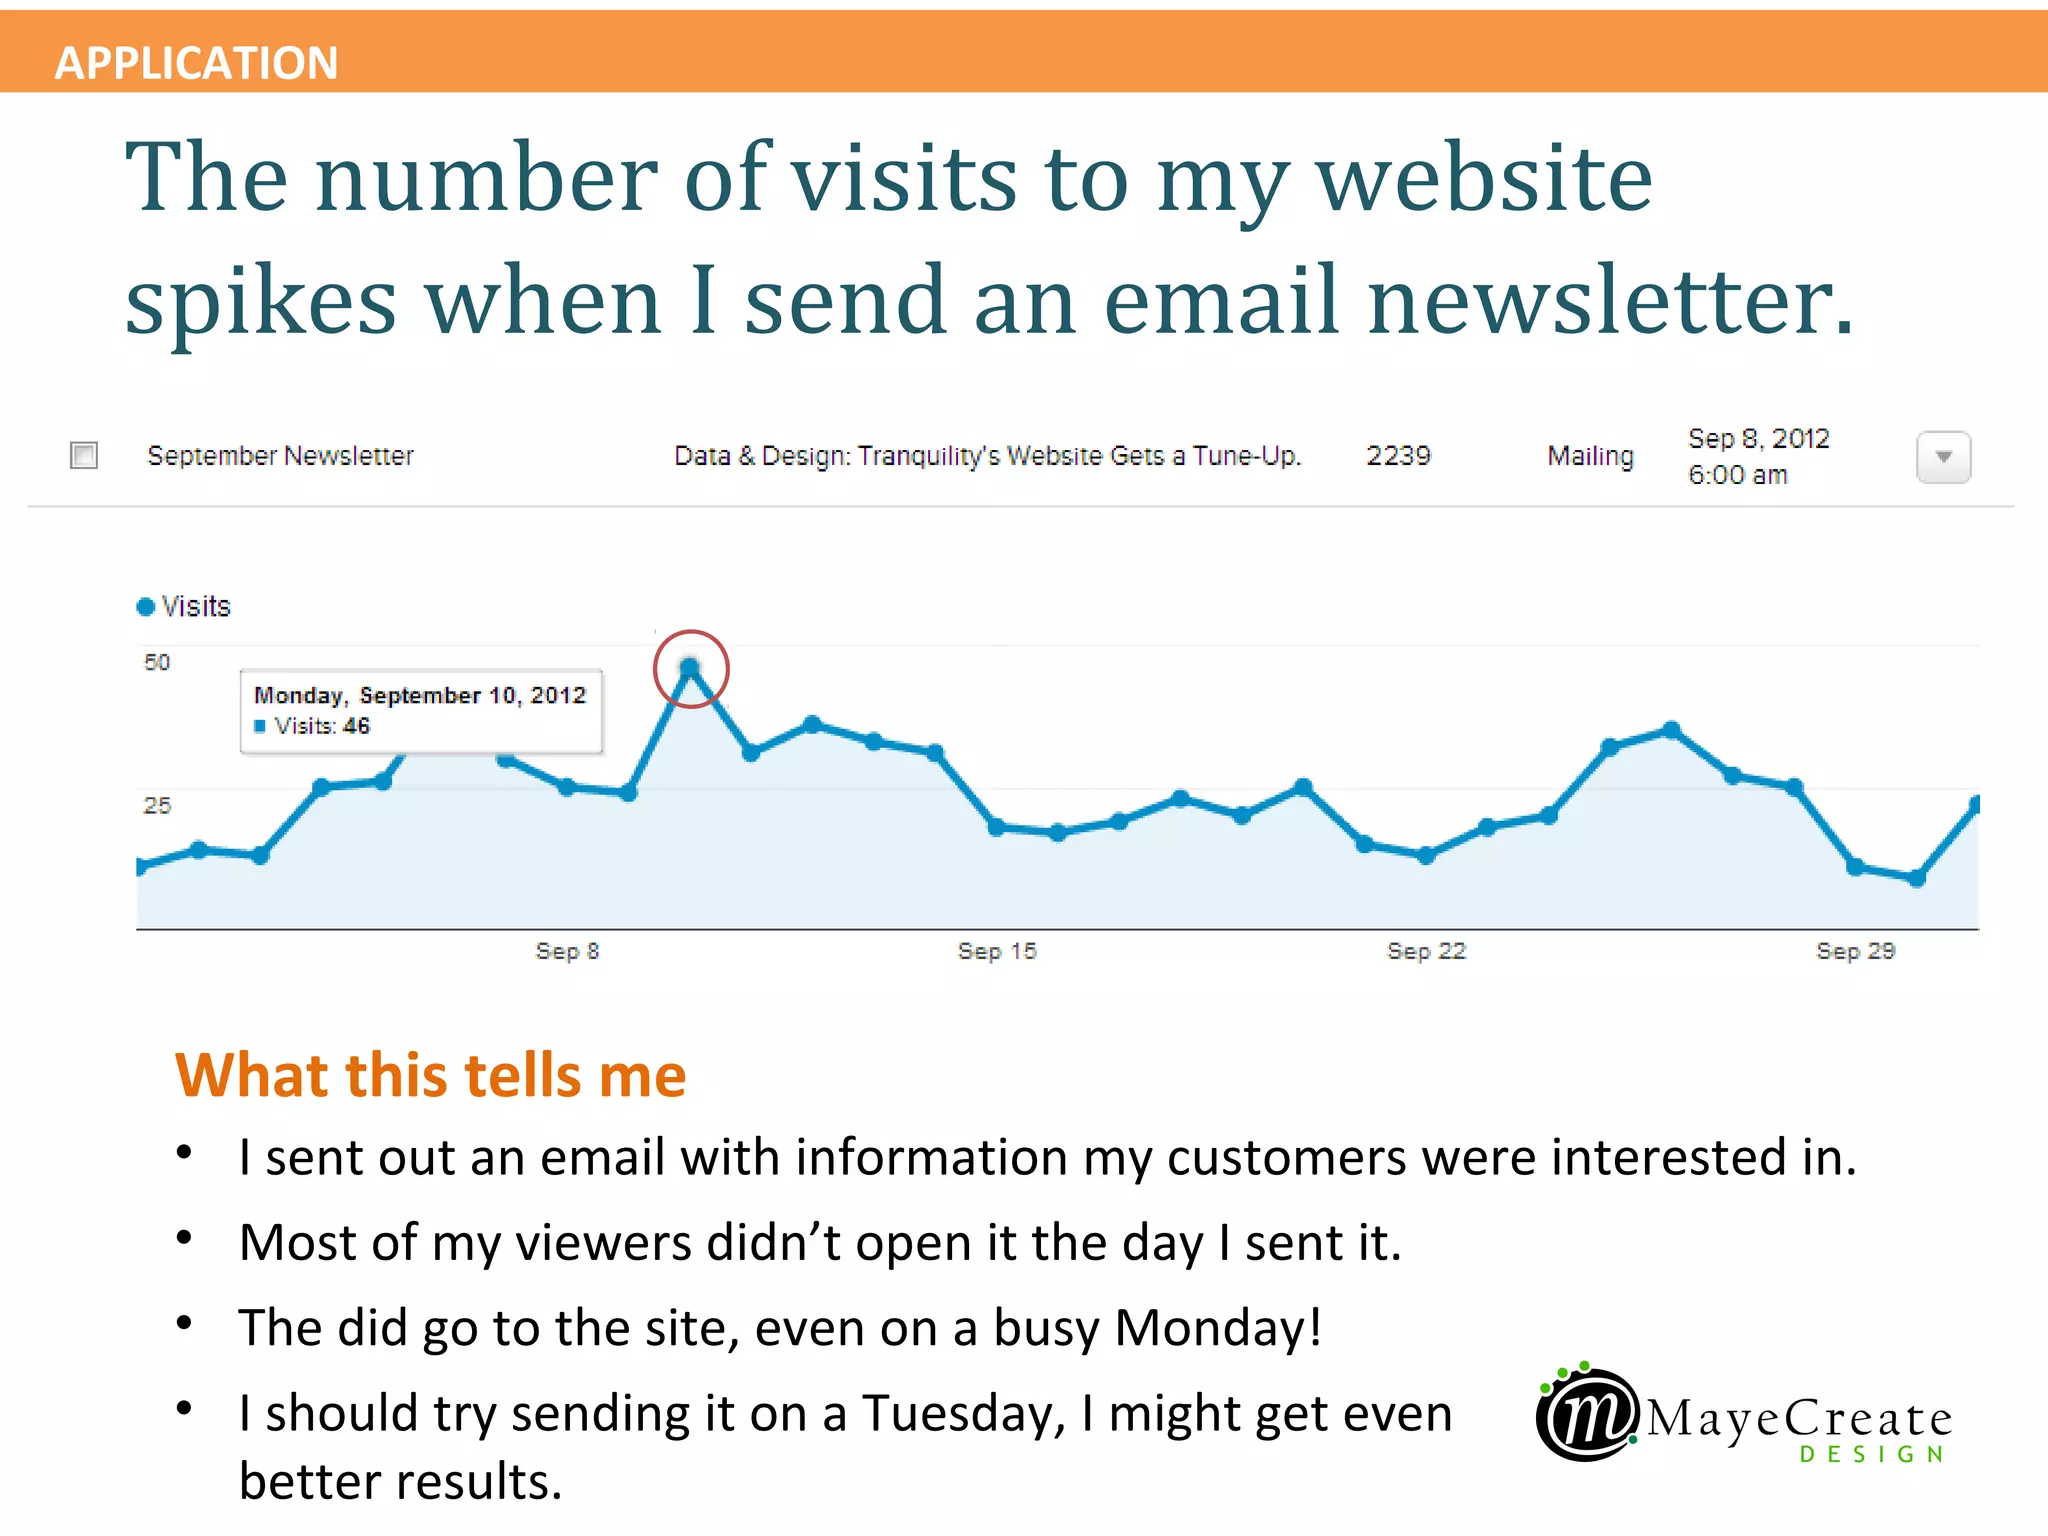
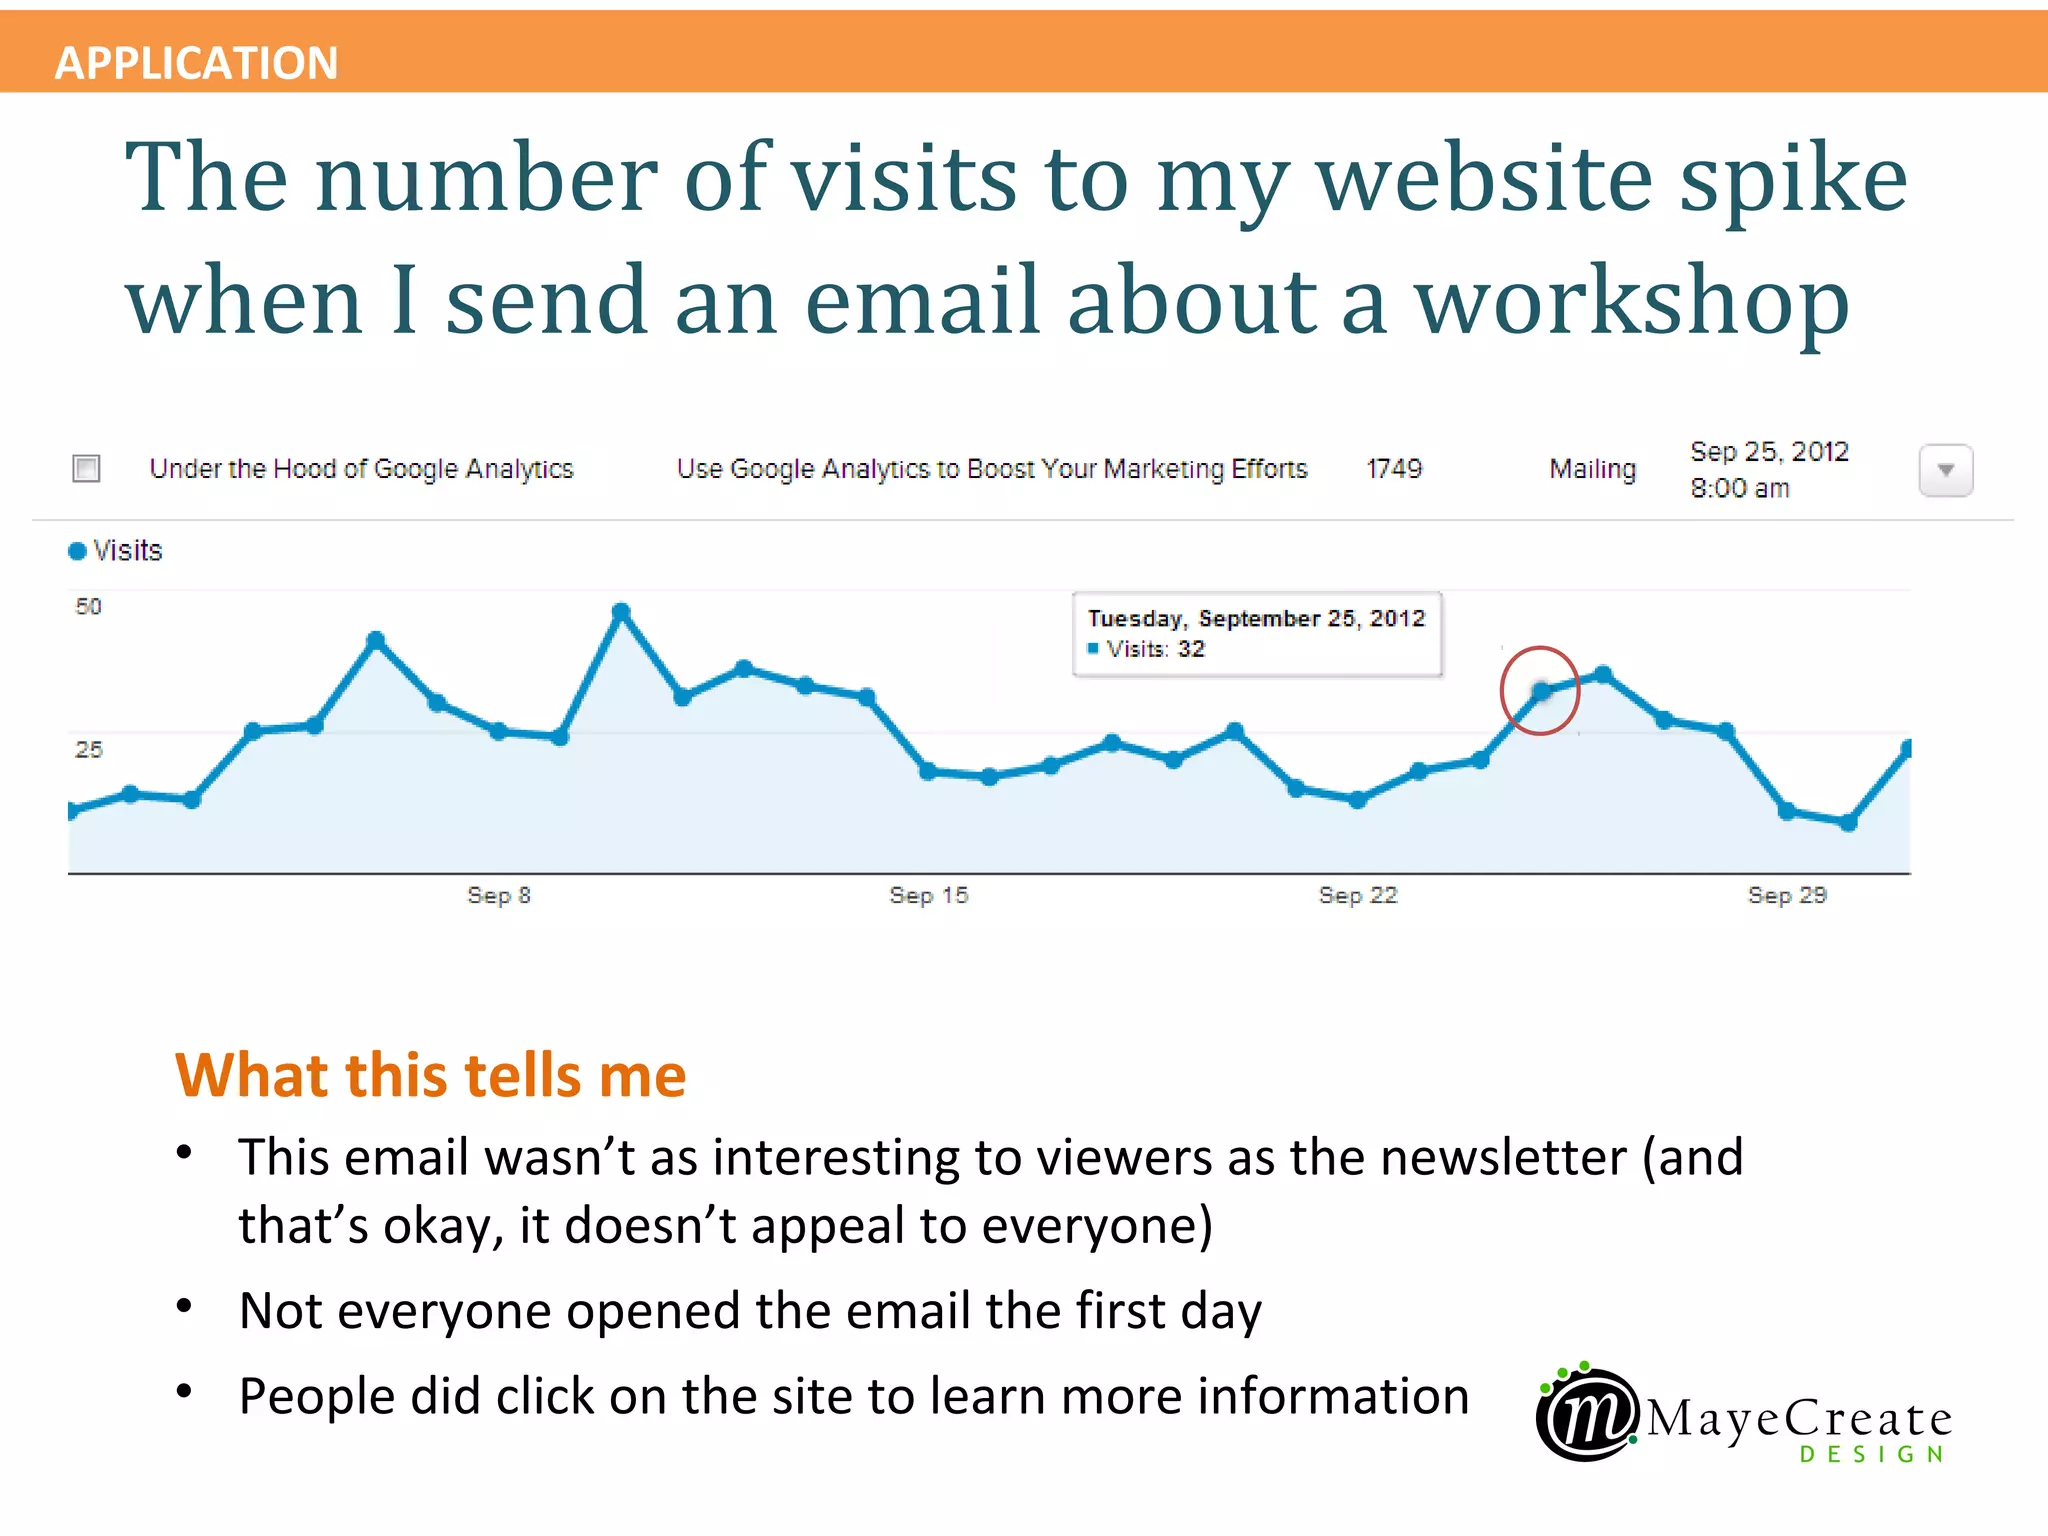
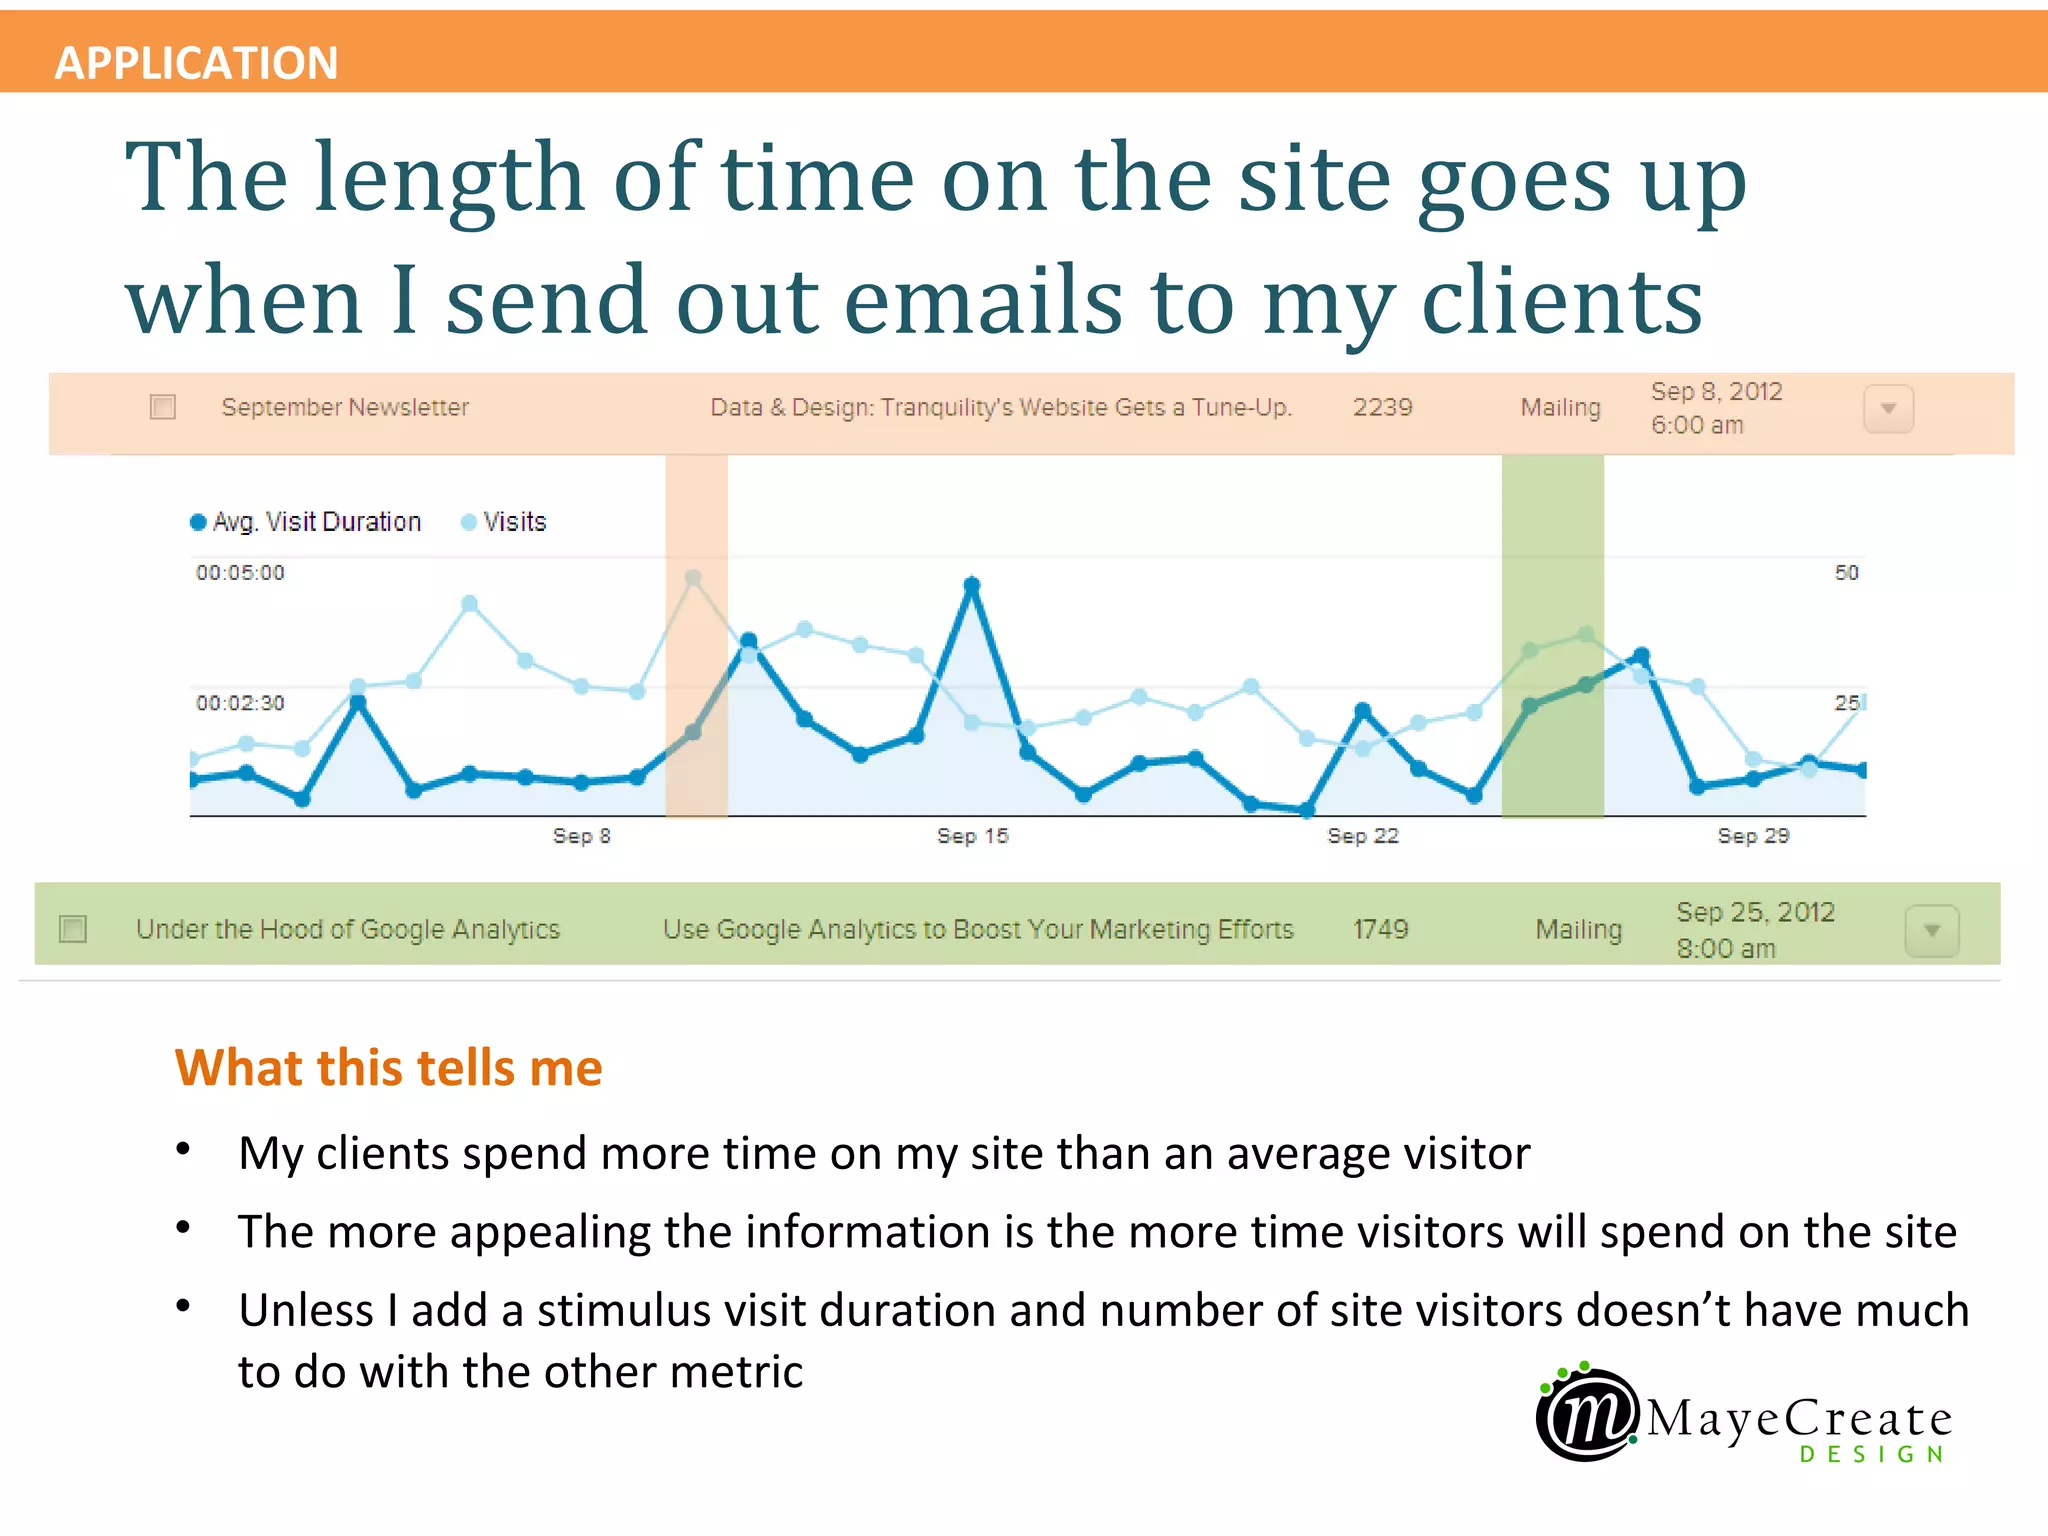


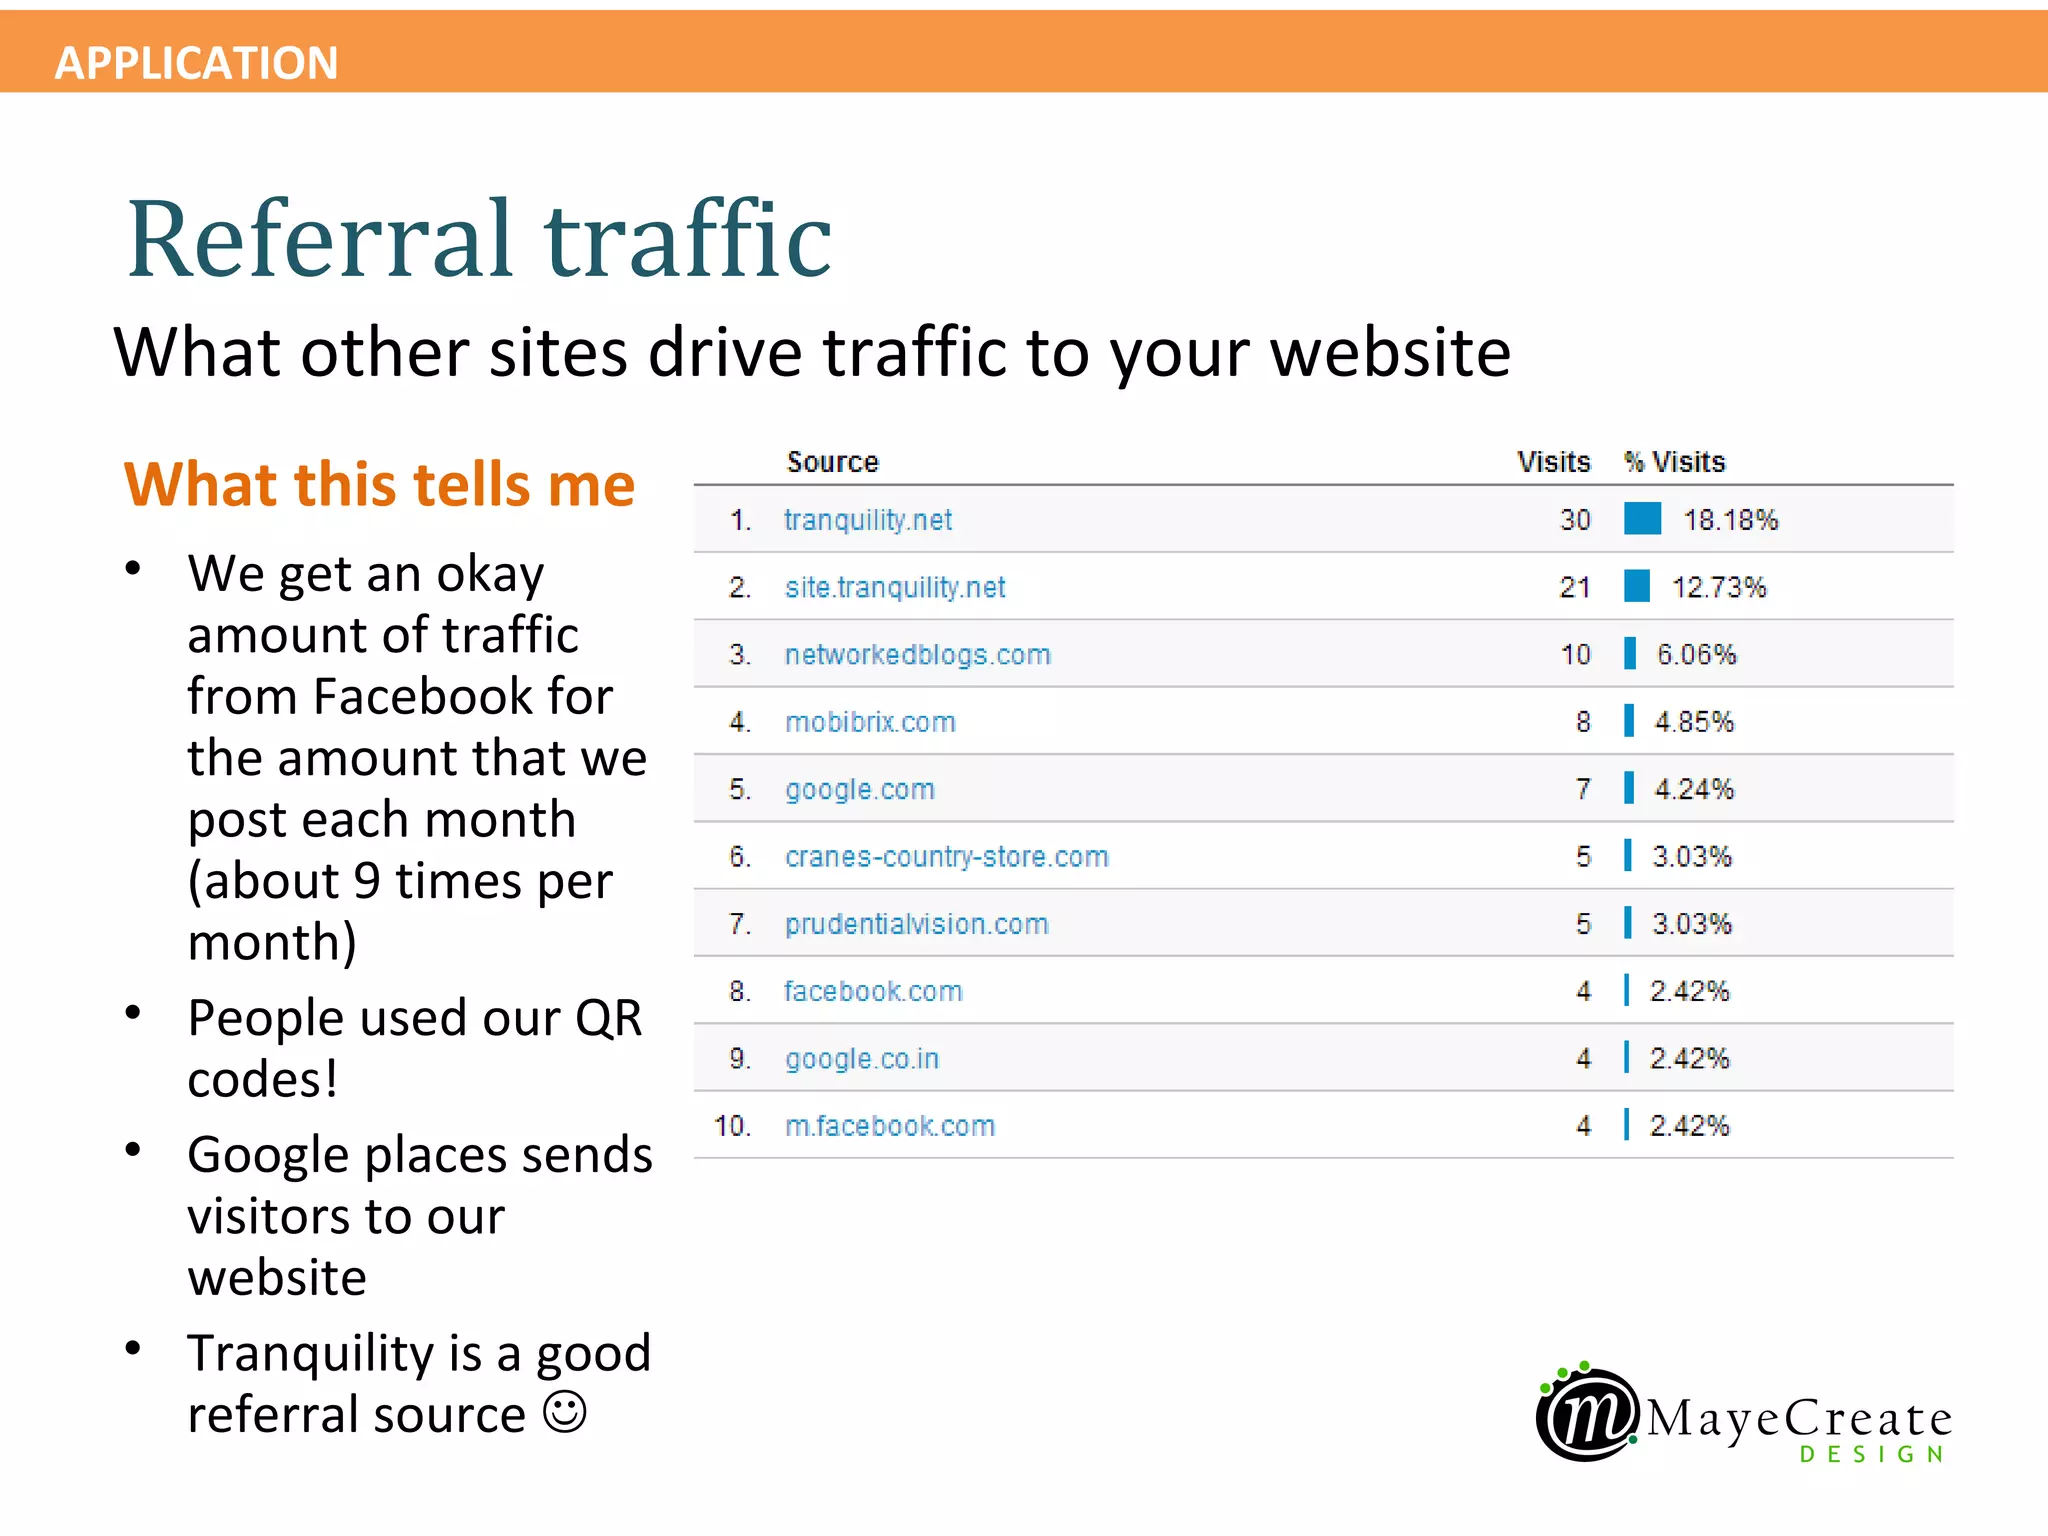
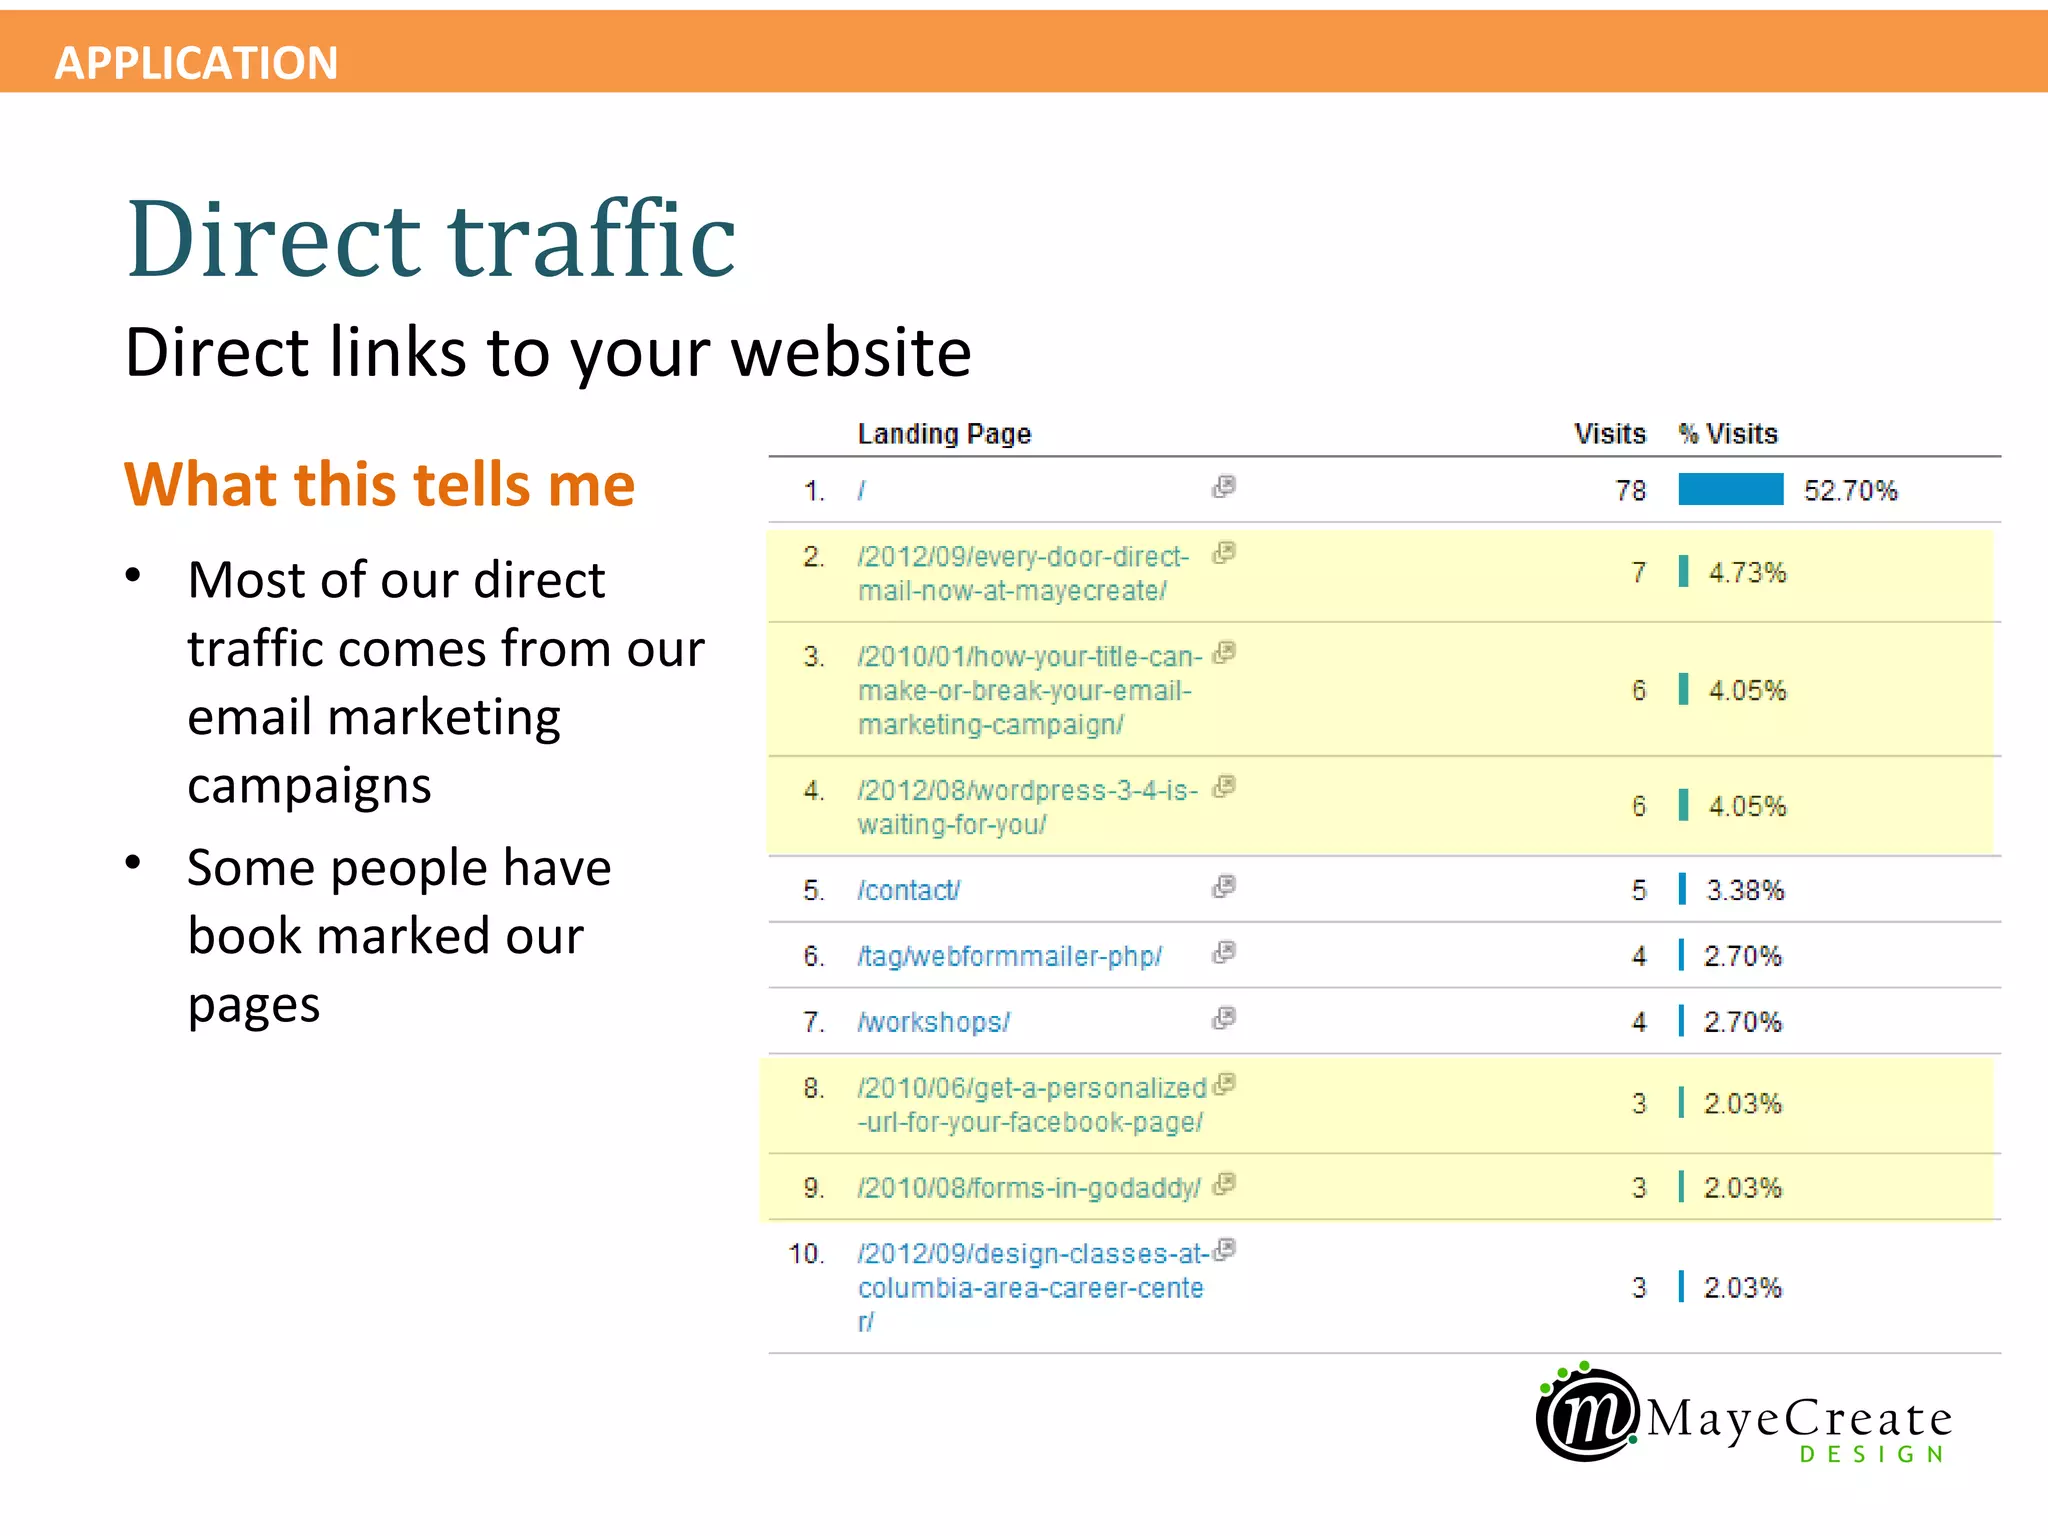
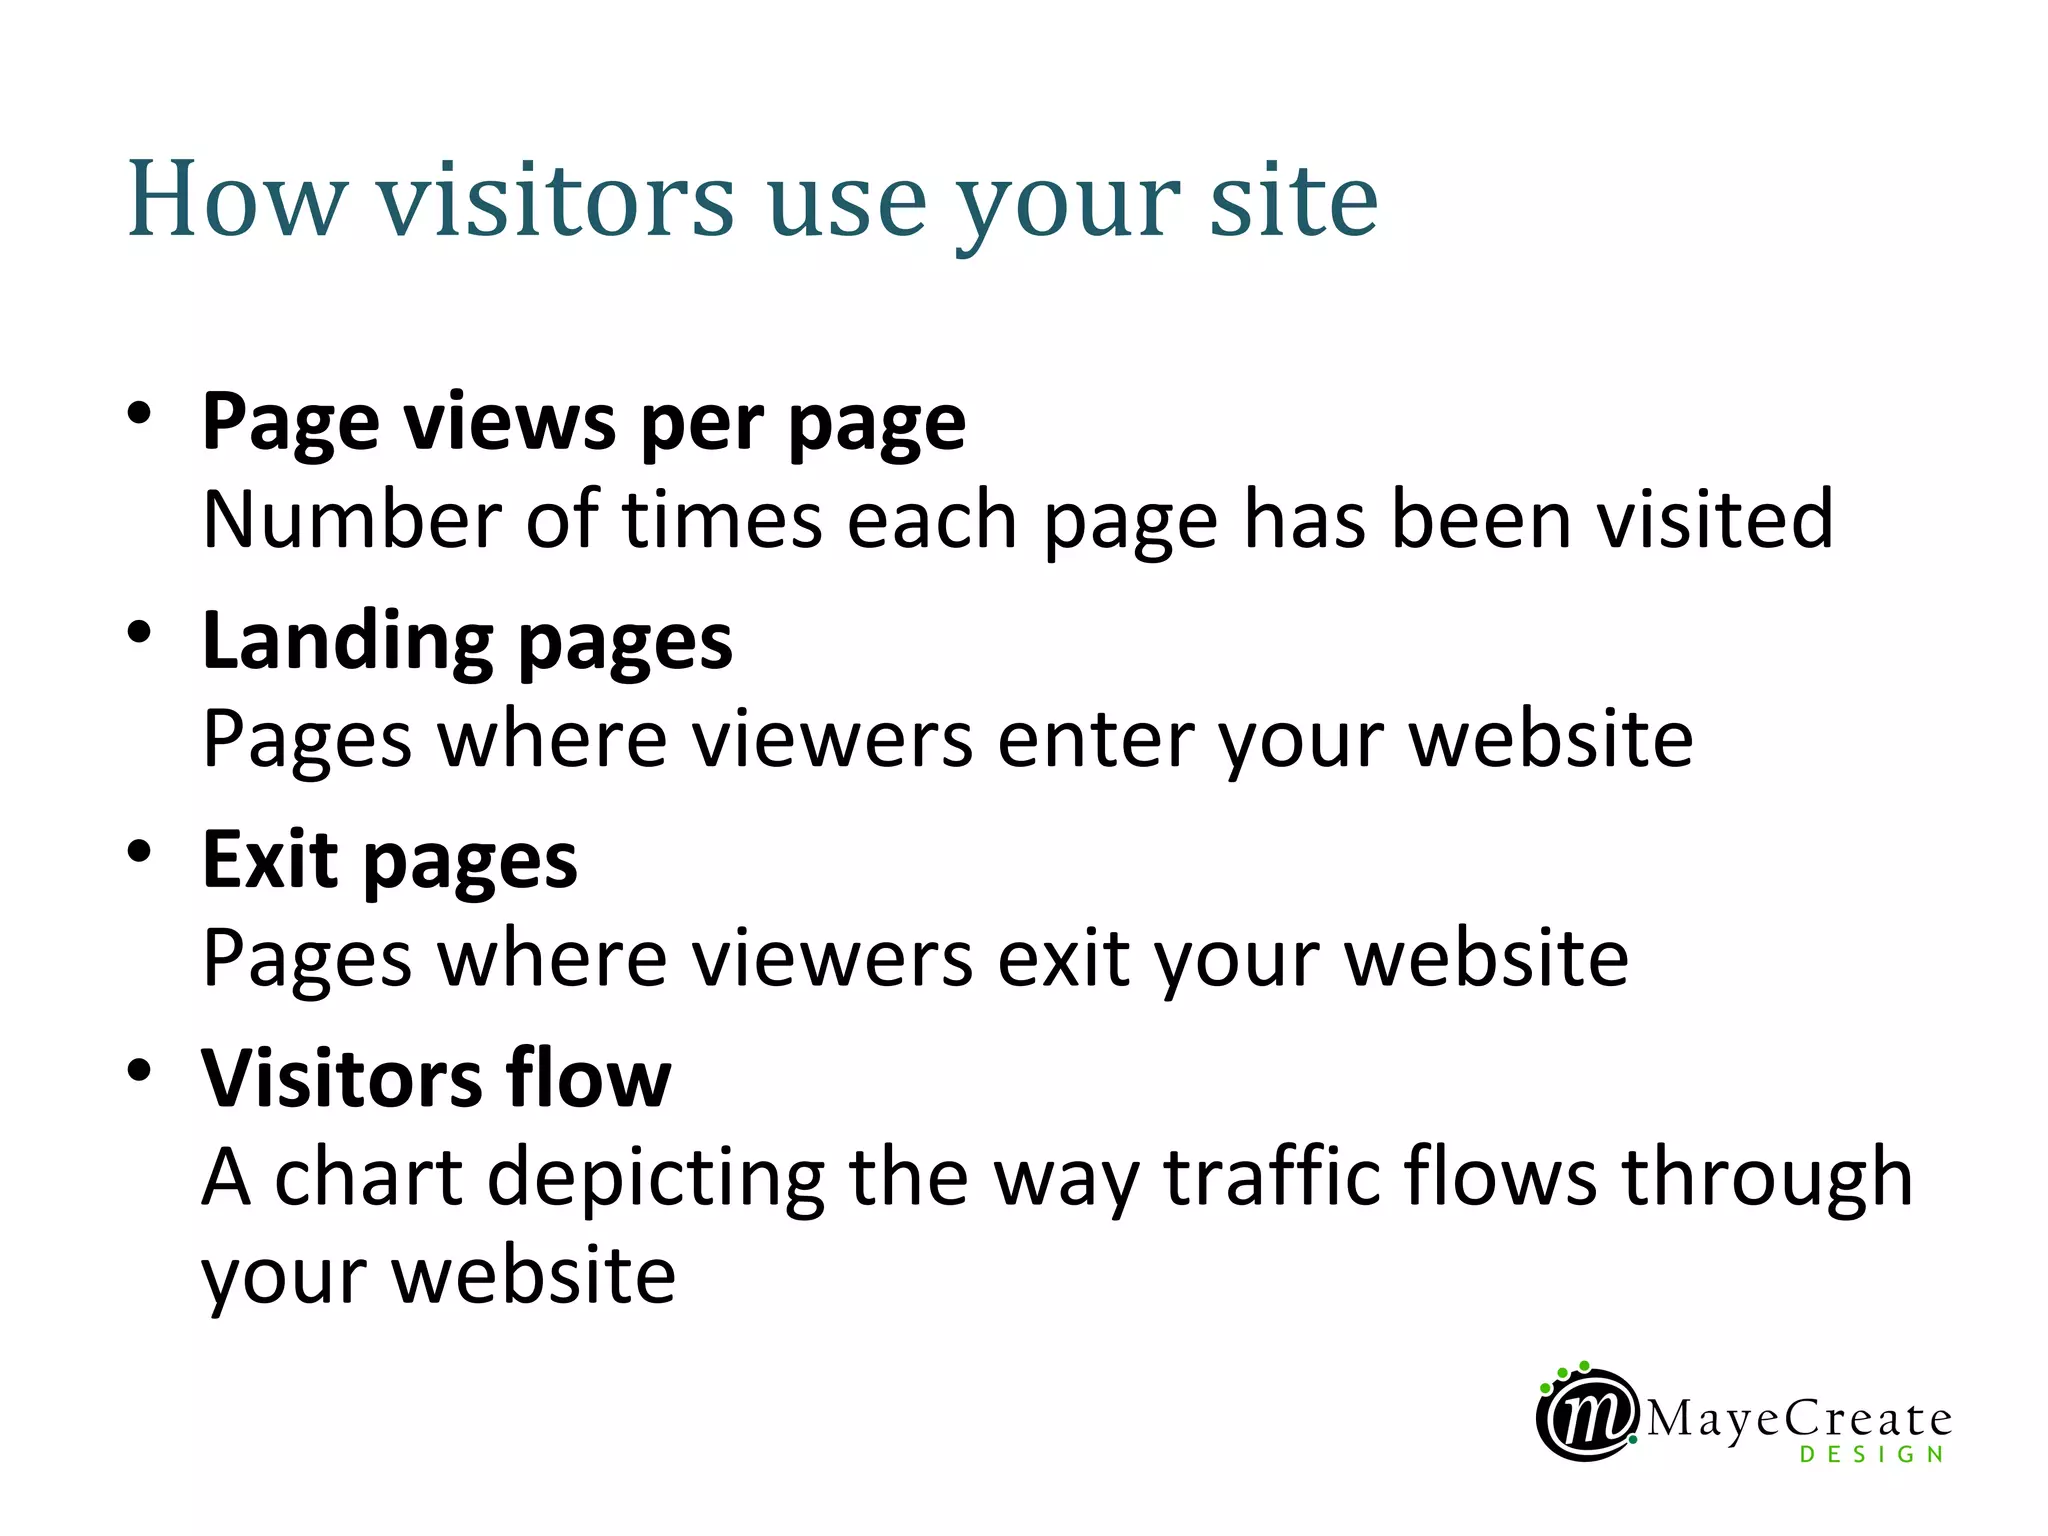


The document provides an overview of web analytics, emphasizing its importance for understanding website visitor metrics and optimizing marketing efforts. It explains how Google Analytics works, detailing key visitor metrics such as unique visitors, pageviews, and bounce rates, along with insights into traffic sources and audience behavior. Furthermore, it discusses strategies for improving website performance based on analytical data to enhance visitor engagement and achieve business goals.


