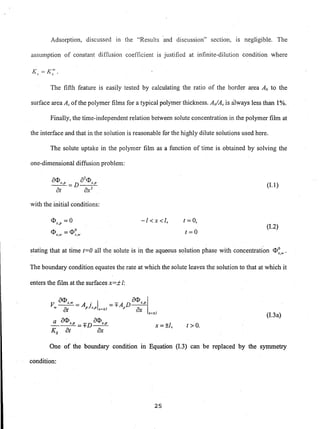
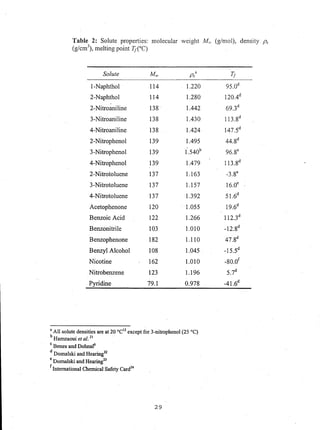
This document reports on an experimental study that measured distribution coefficients and diffusivities for 19 non-volatile solutes in 3 polymers. The study found that:
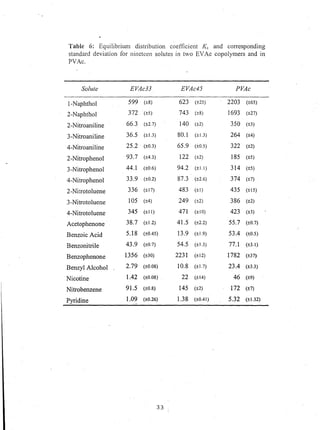
- Distribution coefficients ranged from near unity to several hundred and increased with vinyl acetate content in the polymers.
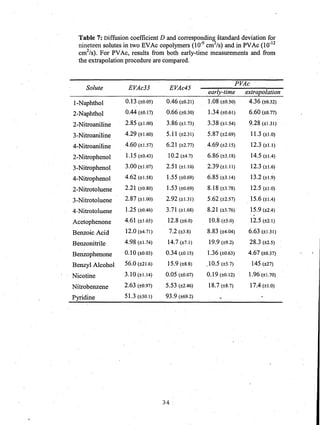
- Diffusion coefficients in EVAc copolymers ranged from 10-10 to 10-8 cm2/sec, much faster than 10-12 cm2/sec in PVAc.
- A long time (over 4-5 weeks) was required to reach equilibrium for solutes in PVAc, so diffusion models were used to calculate equilibrium values.
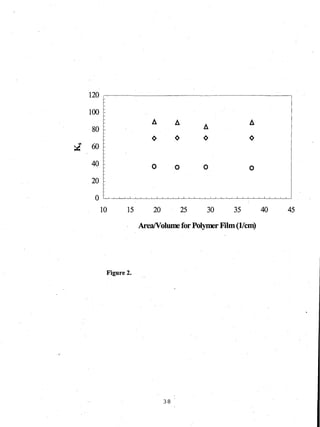
- Surface adsorption effects were found to be negligible.
![LBNL-48573
Preprint
ERNEST ORLANDO LAWRENCE
BERKELEY NATIONAL LABORATORY
Distribution Coefficients
and Diffusivities in Three
Polymers for Nineteen
Aqueous Nonvolatile Solutes
F. Fornasiero, M.M. Olaya, B. Esprester,
V. Nguyen, and ].M. Prausnitz
Chemical Sciences Division
June 2001
Submitted.,to'_.__._....;.-.:.................. ..... "
Journal"oJApplied .'--.
Polymer Science' .](https://image.slidesharecdn.com/e2e033e8-066f-40ba-8a5b-de592948667f-151003214116-lva1-app6892/85/UC-Berkeley-Research-1-320.jpg)
![LBNL-48573
Preprint
ERNEST ORLANDO LAWRENCE
BERKELEY NATIONAL LABORATORY
Distribution Coefficients
and Diffusivities in Three
Polymers for Nineteen
Aqueous Nonvolatile Solutes
F. Fornasiero, M.M. Olaya, B. Esprester,
V. Nguyen, and ].M. Prausnitz
Chemical Sciences Division
June 2001
Submitted.,to'_.__._....;.-.:.................. ..... "
Journal"oJApplied .'--.
Polymer Science' .](https://image.slidesharecdn.com/e2e033e8-066f-40ba-8a5b-de592948667f-151003214116-lva1-app6892/75/UC-Berkeley-Research-1-2048.jpg)
![101
~
- - - - - - - - - -,- - - - - - - - - - -,- - EVAc33
, ,
, ,
~ 1 AI ........... , ~ >':+:.v ;.....'
, ,
o'('r..,;·"",,~.,.~.... ~.,,._ ">""w'-'.'y.~'" I
,
----------~----------~
, ,
99 - - - - - - - - - - - - - - - - - - - _1- __________ 1___________I __________ _
. 'EVAc45'
97 - - - - - - - - 1- - - - - - - - - - -1- - - - - - - - - - -1- - - - - - --:- - - - -I - - - - - - - - - - ..,
-~
95 , "
--------------------------------------~----------~
................
= PVAc.....
93 -------~----------~
91
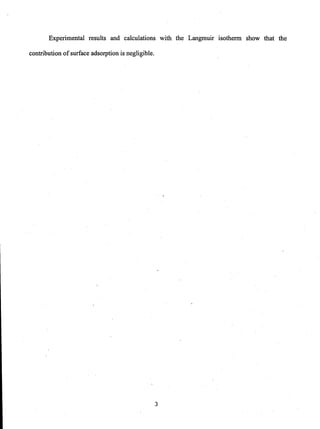
25 75 125 175 225 275
Temperature [ C ]
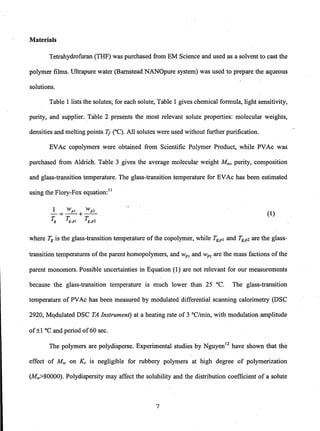
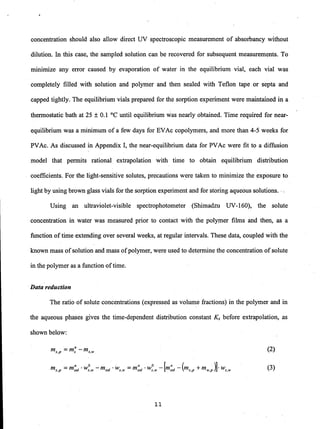
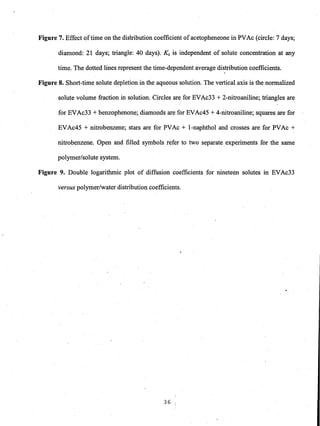
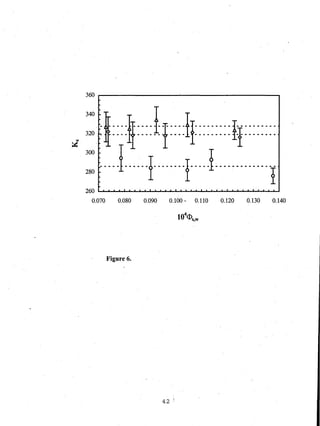
Figure 1.
37](https://image.slidesharecdn.com/e2e033e8-066f-40ba-8a5b-de592948667f-151003214116-lva1-app6892/85/UC-Berkeley-Research-40-320.jpg)
![1.0
~
- ~~A
- ~ ~~ Ai'
0.9
.~'~A :I:
.. ~ ., A t
~ i-
A ±rii
~ *'
..0
A ·t
a' of,
~
0.8 - !!!I
.. +~ .. :I:'rii
cP·a %
c
0.7 - o~ ~
ec ~
- 01;1 :K
o ' . . ~.
0.6 • . . .
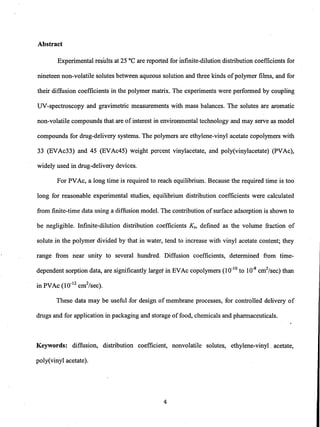
0 5 10 15 20 25
t1!2 [min1!2]
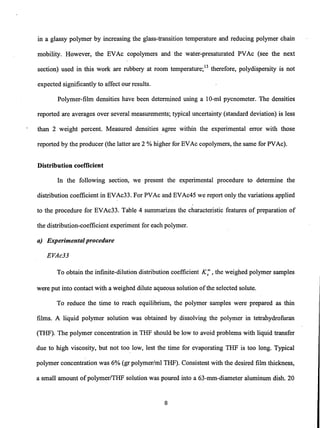
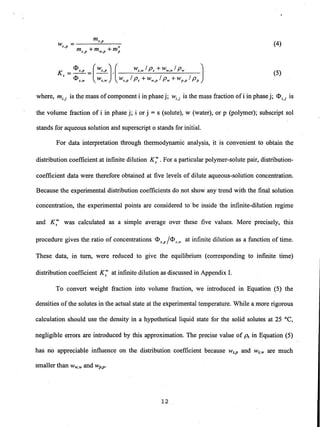
Figure 8.
44](https://image.slidesharecdn.com/e2e033e8-066f-40ba-8a5b-de592948667f-151003214116-lva1-app6892/85/UC-Berkeley-Research-47-320.jpg)