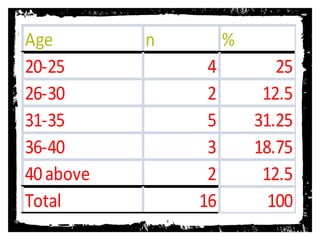
This chart shows the age distribution of 16 people broken into 5-year age brackets from 20-25 to 40 and above. The largest age group is 31-35, making up 31.25% of the total, while the smallest is 26-30 at 12.5%. The total number of people surveyed is 16.