Download to read offline

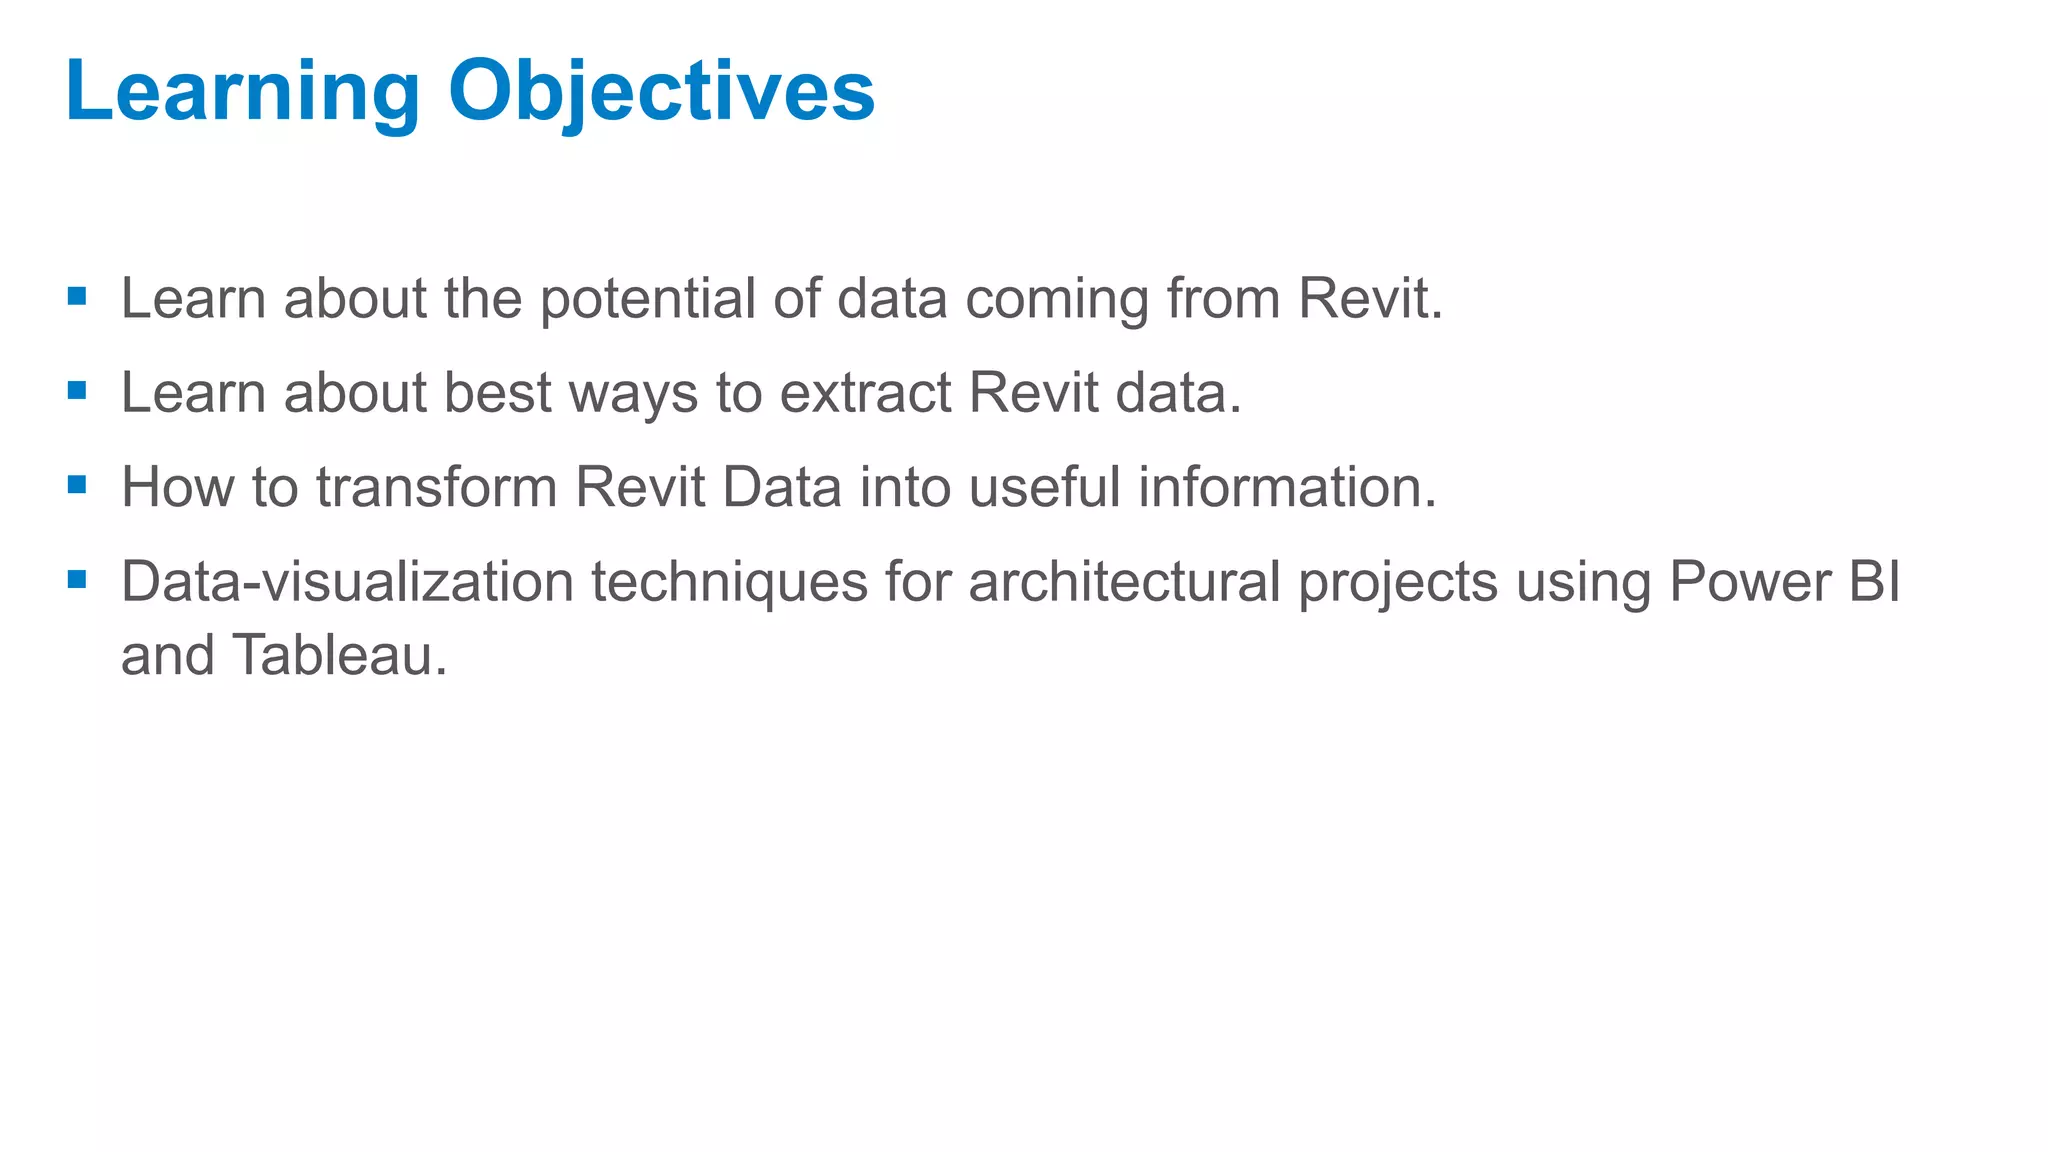
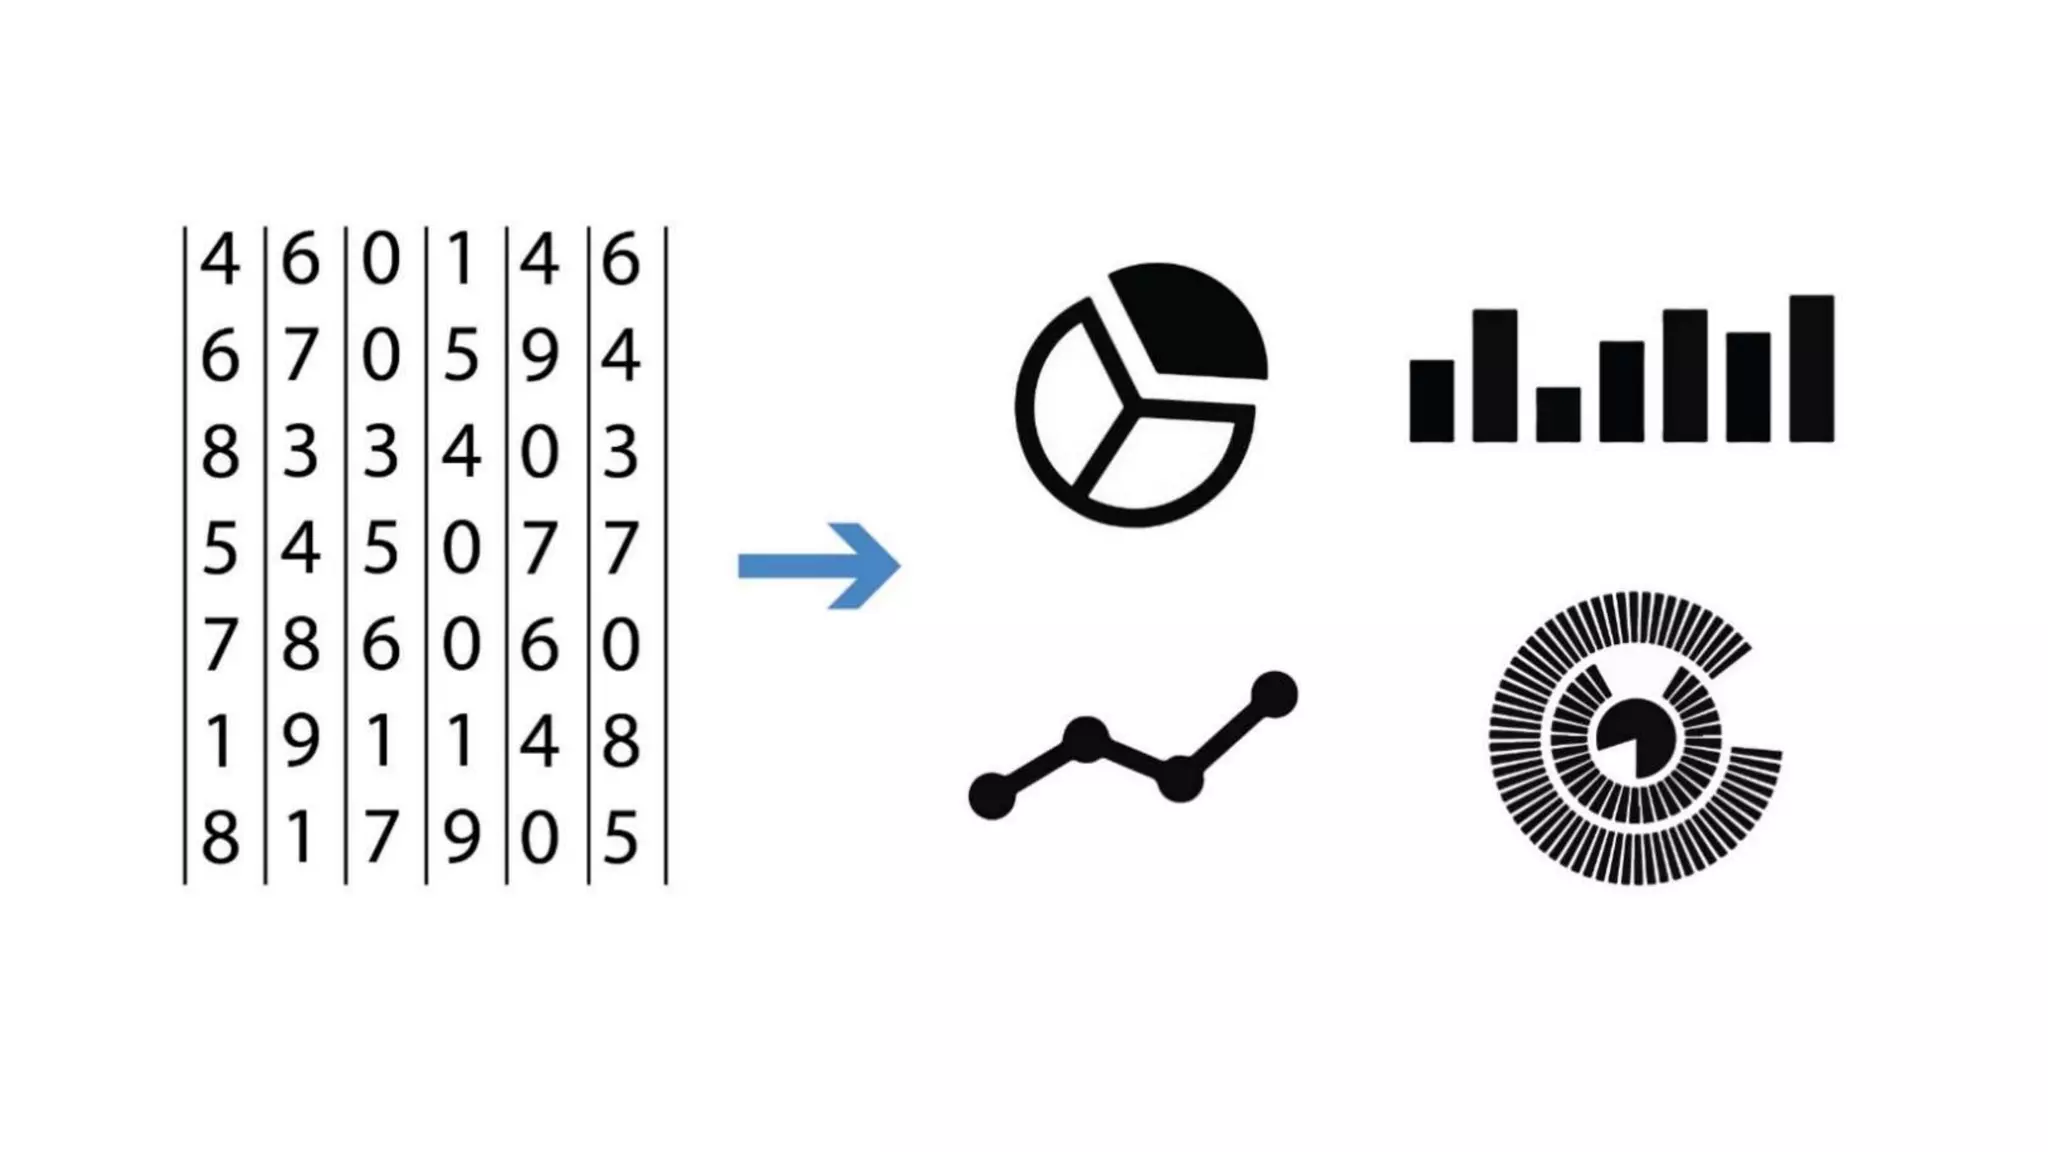
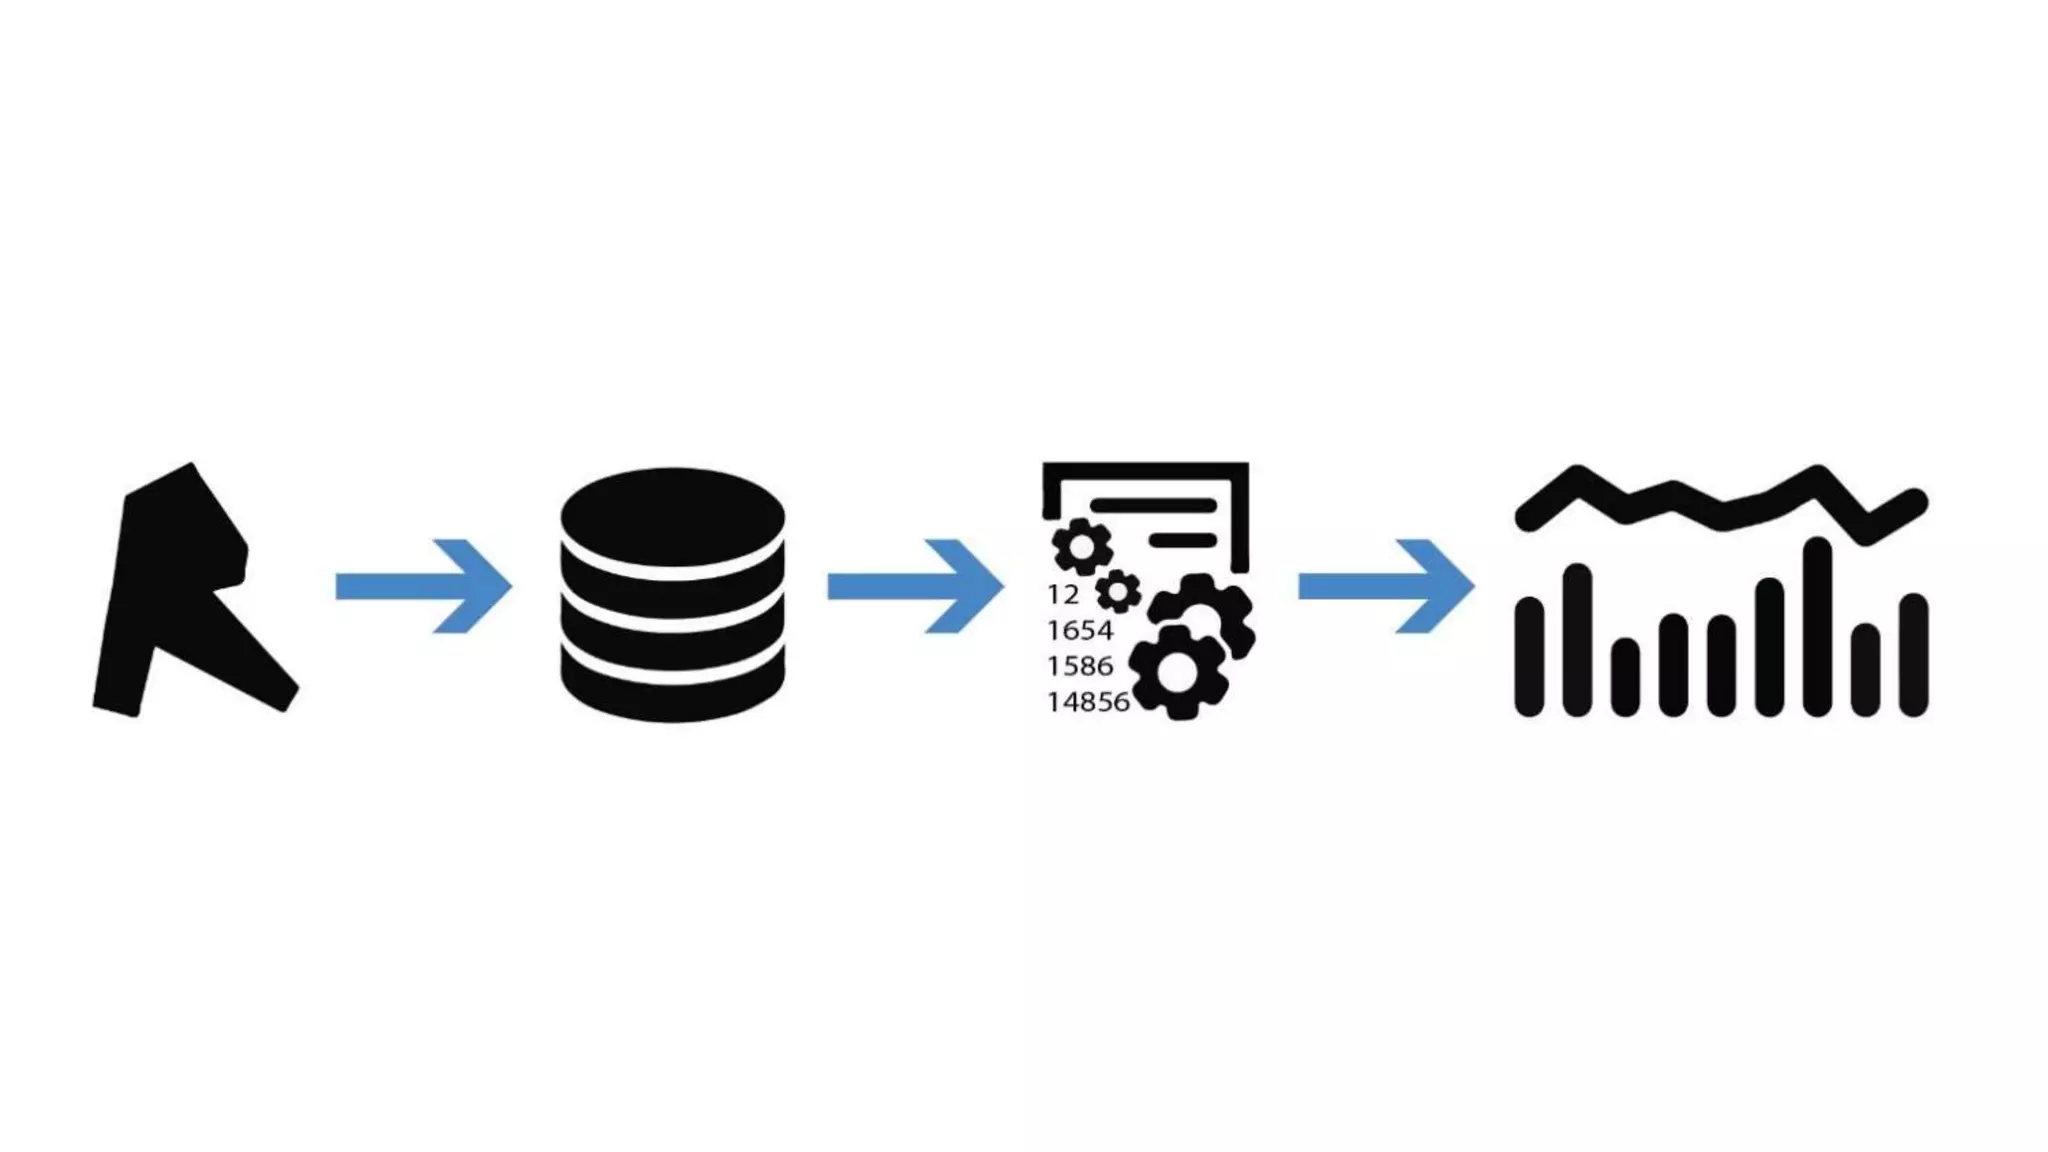
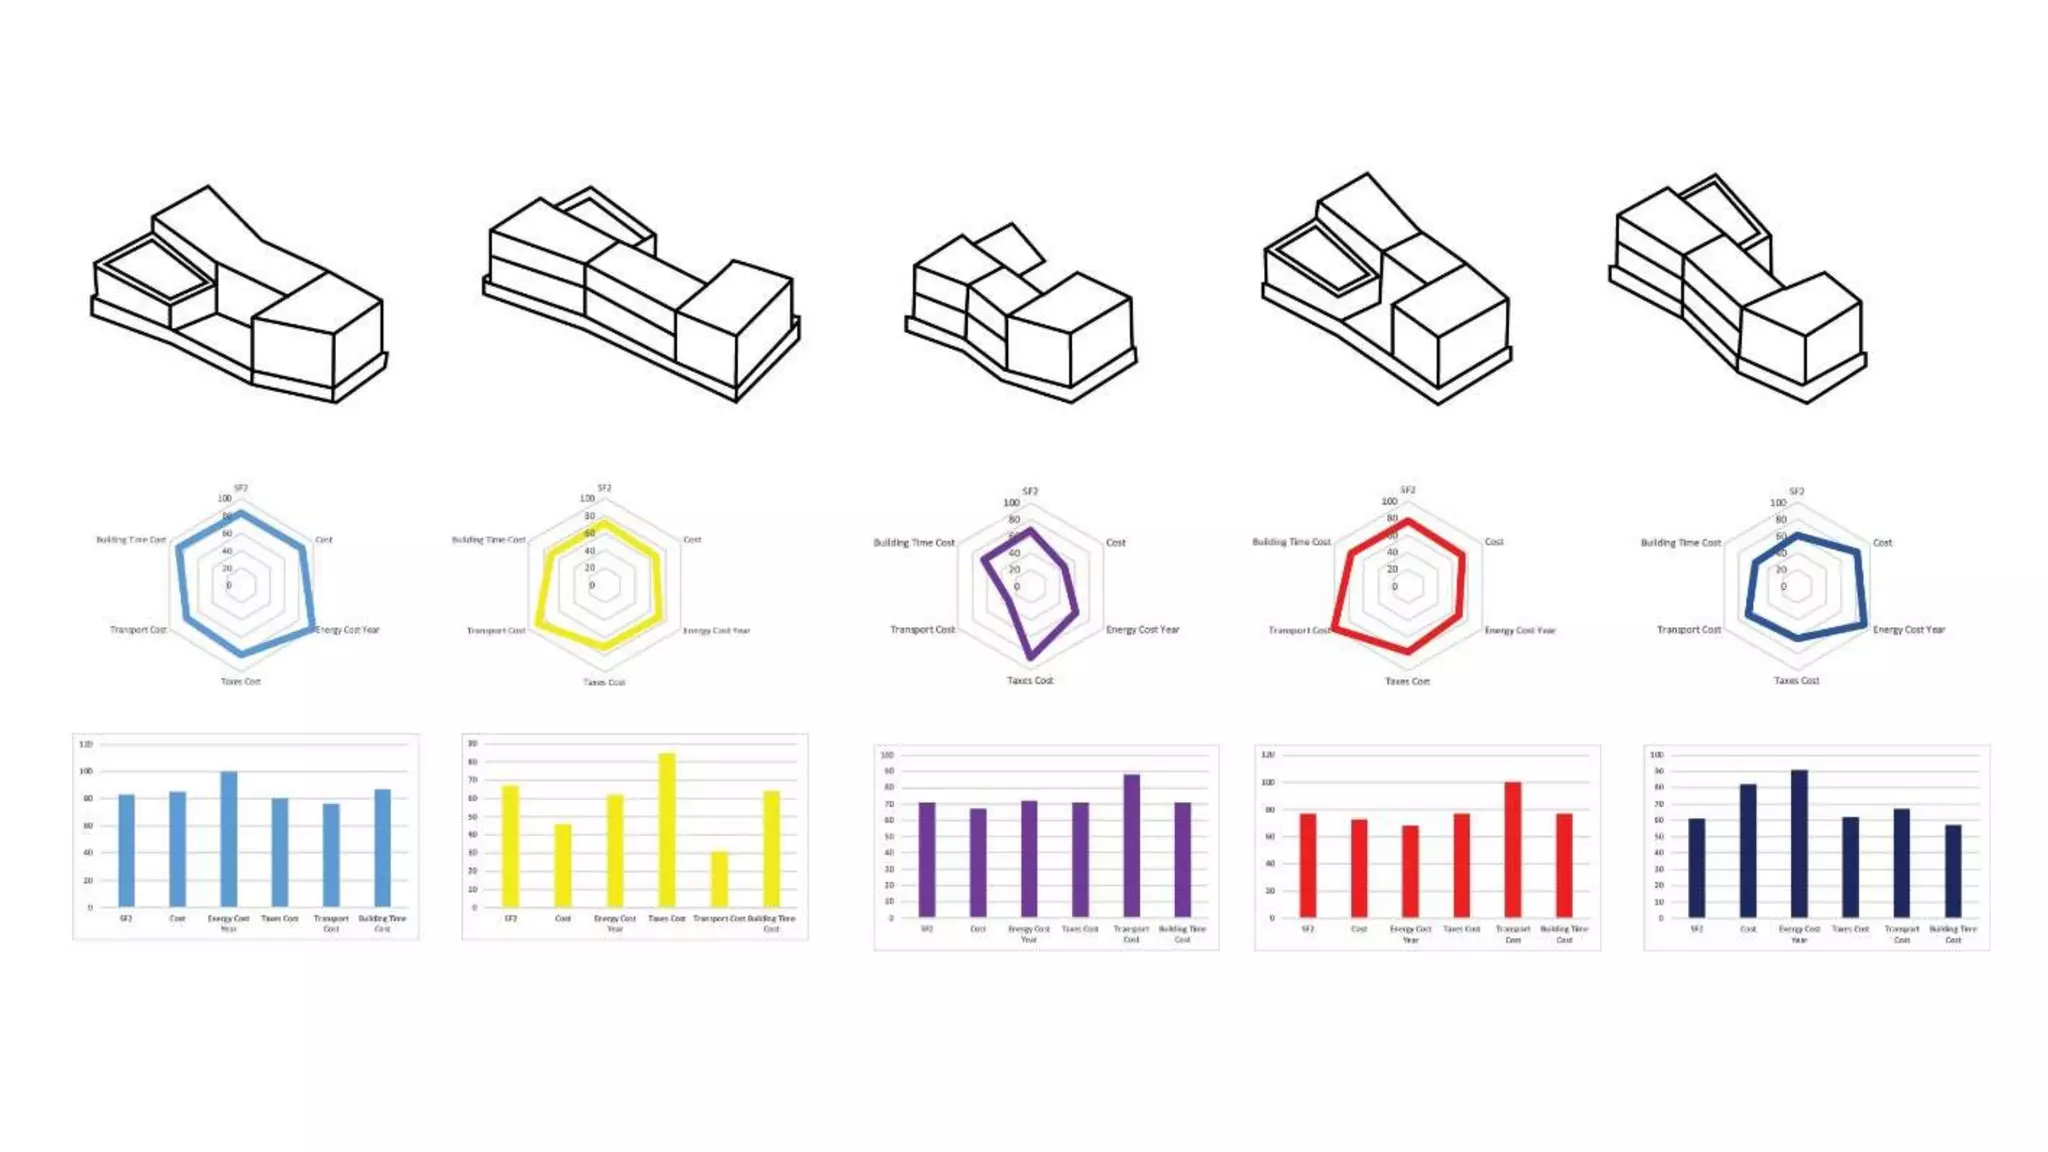

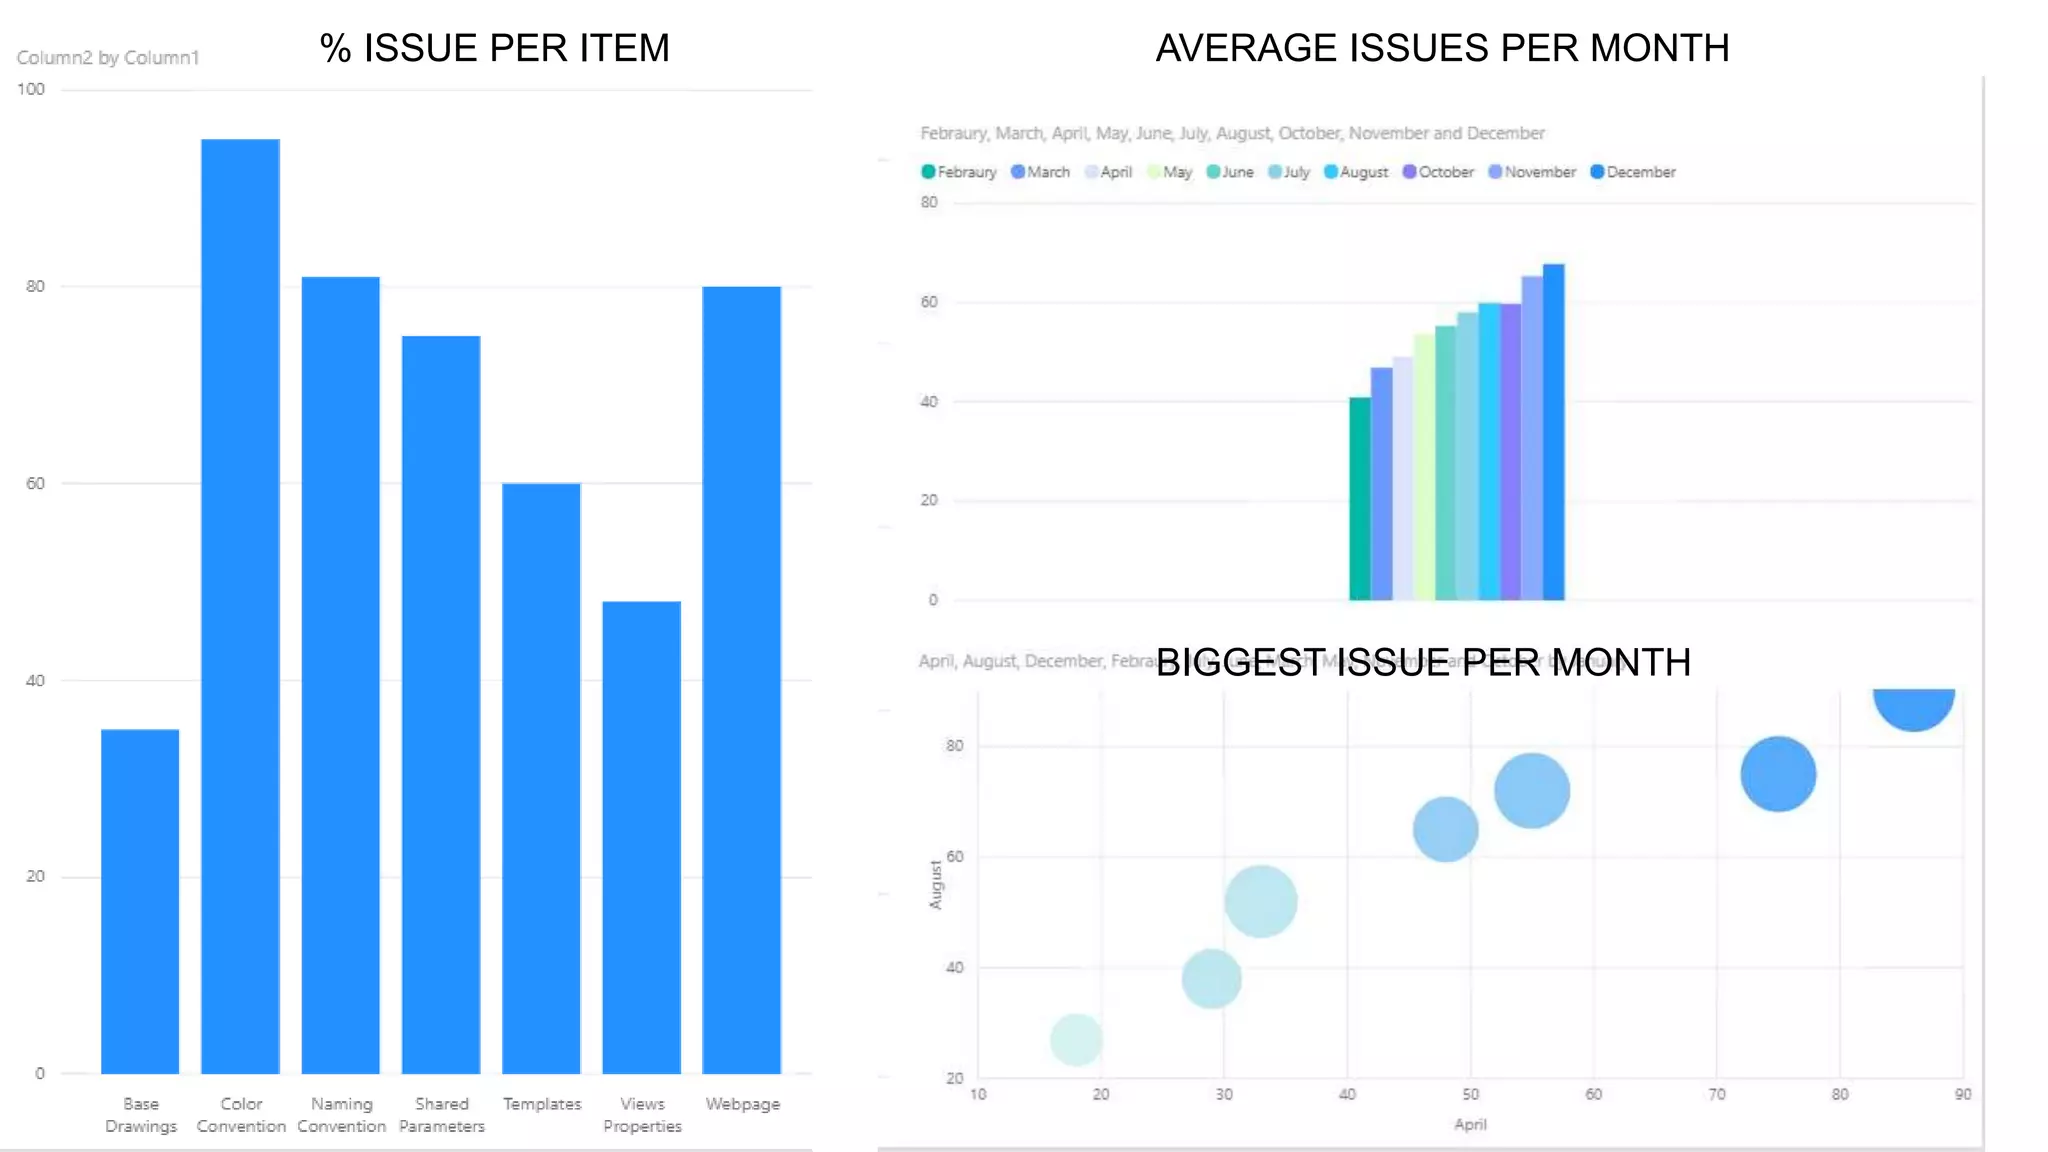

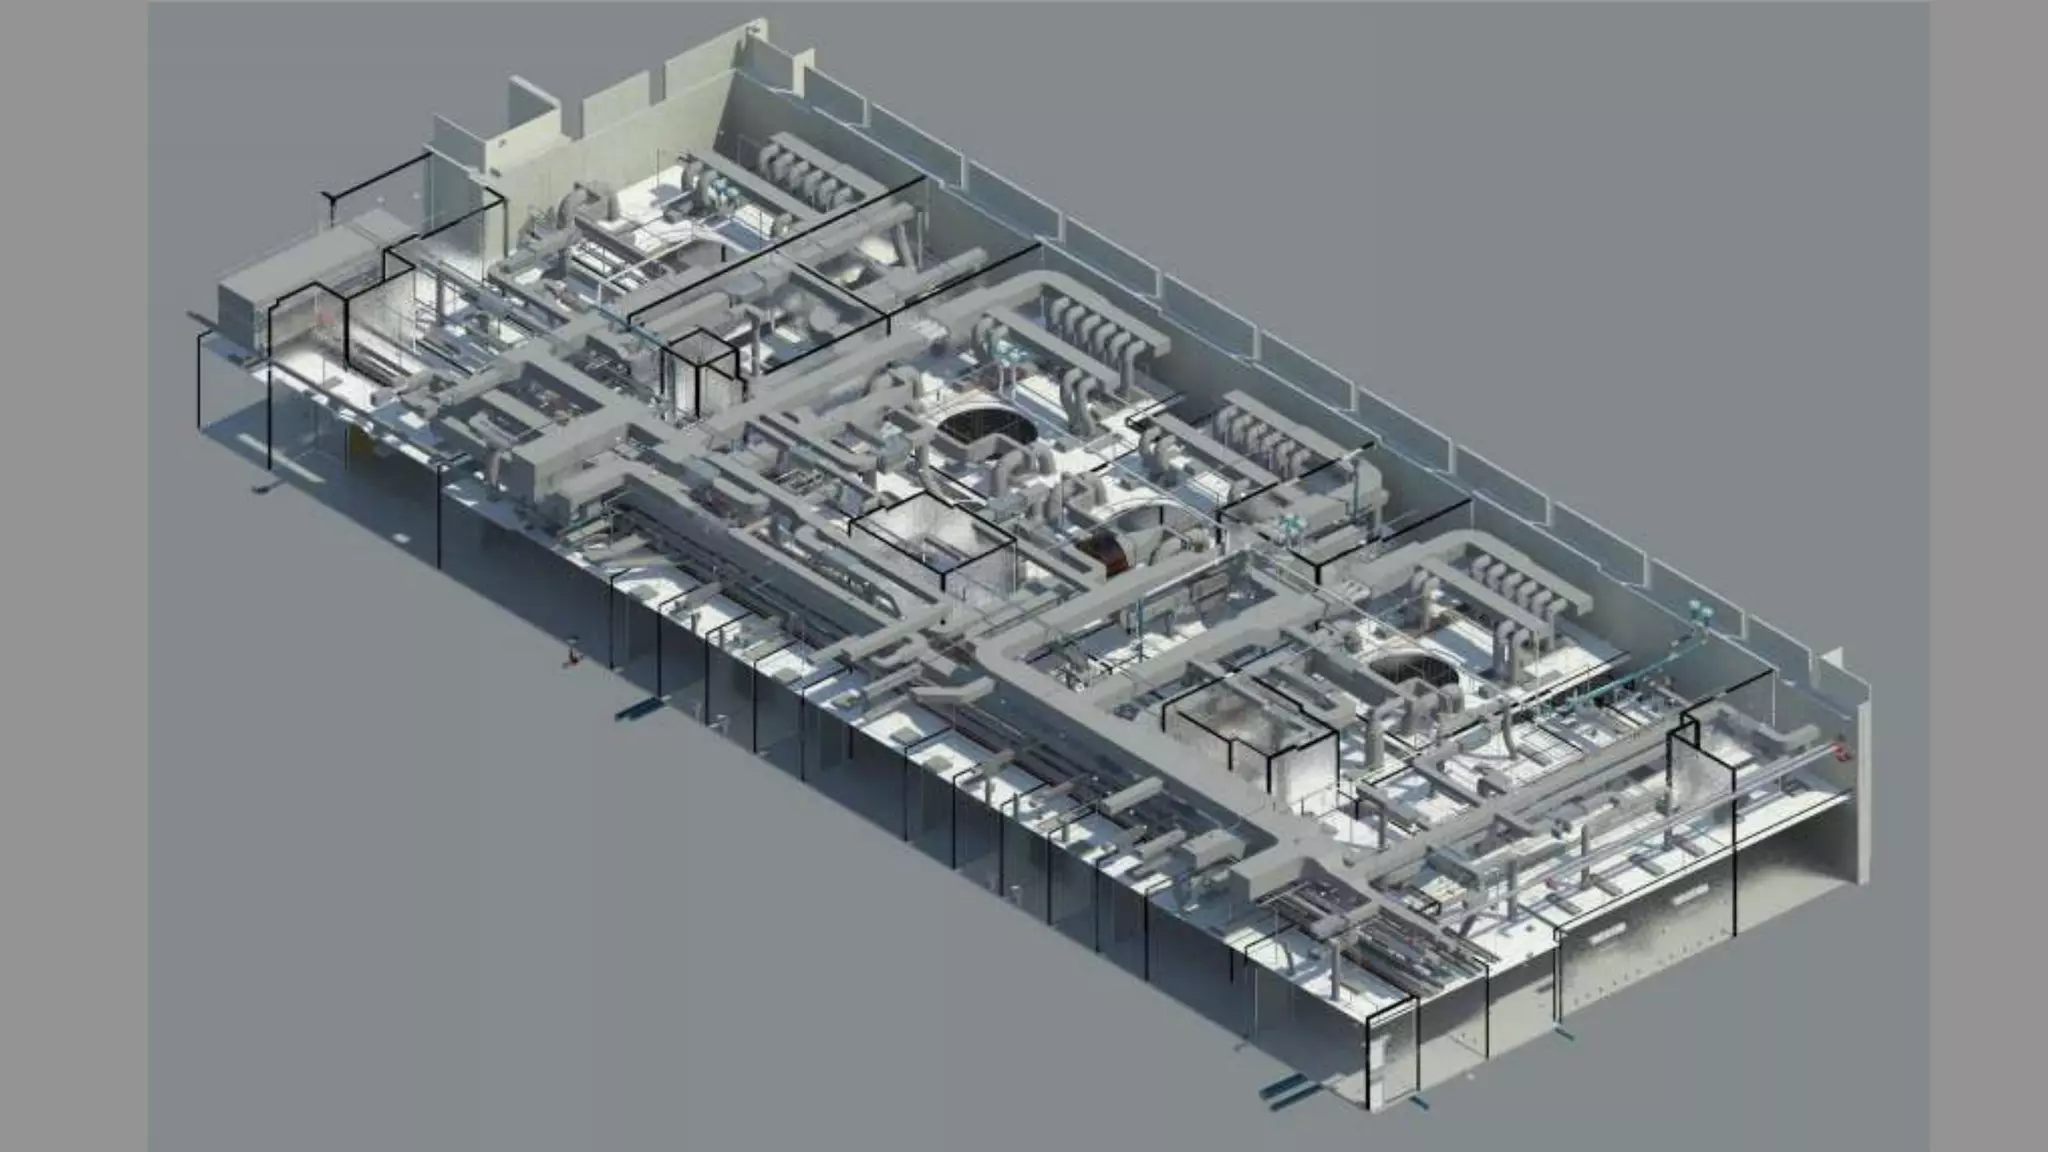

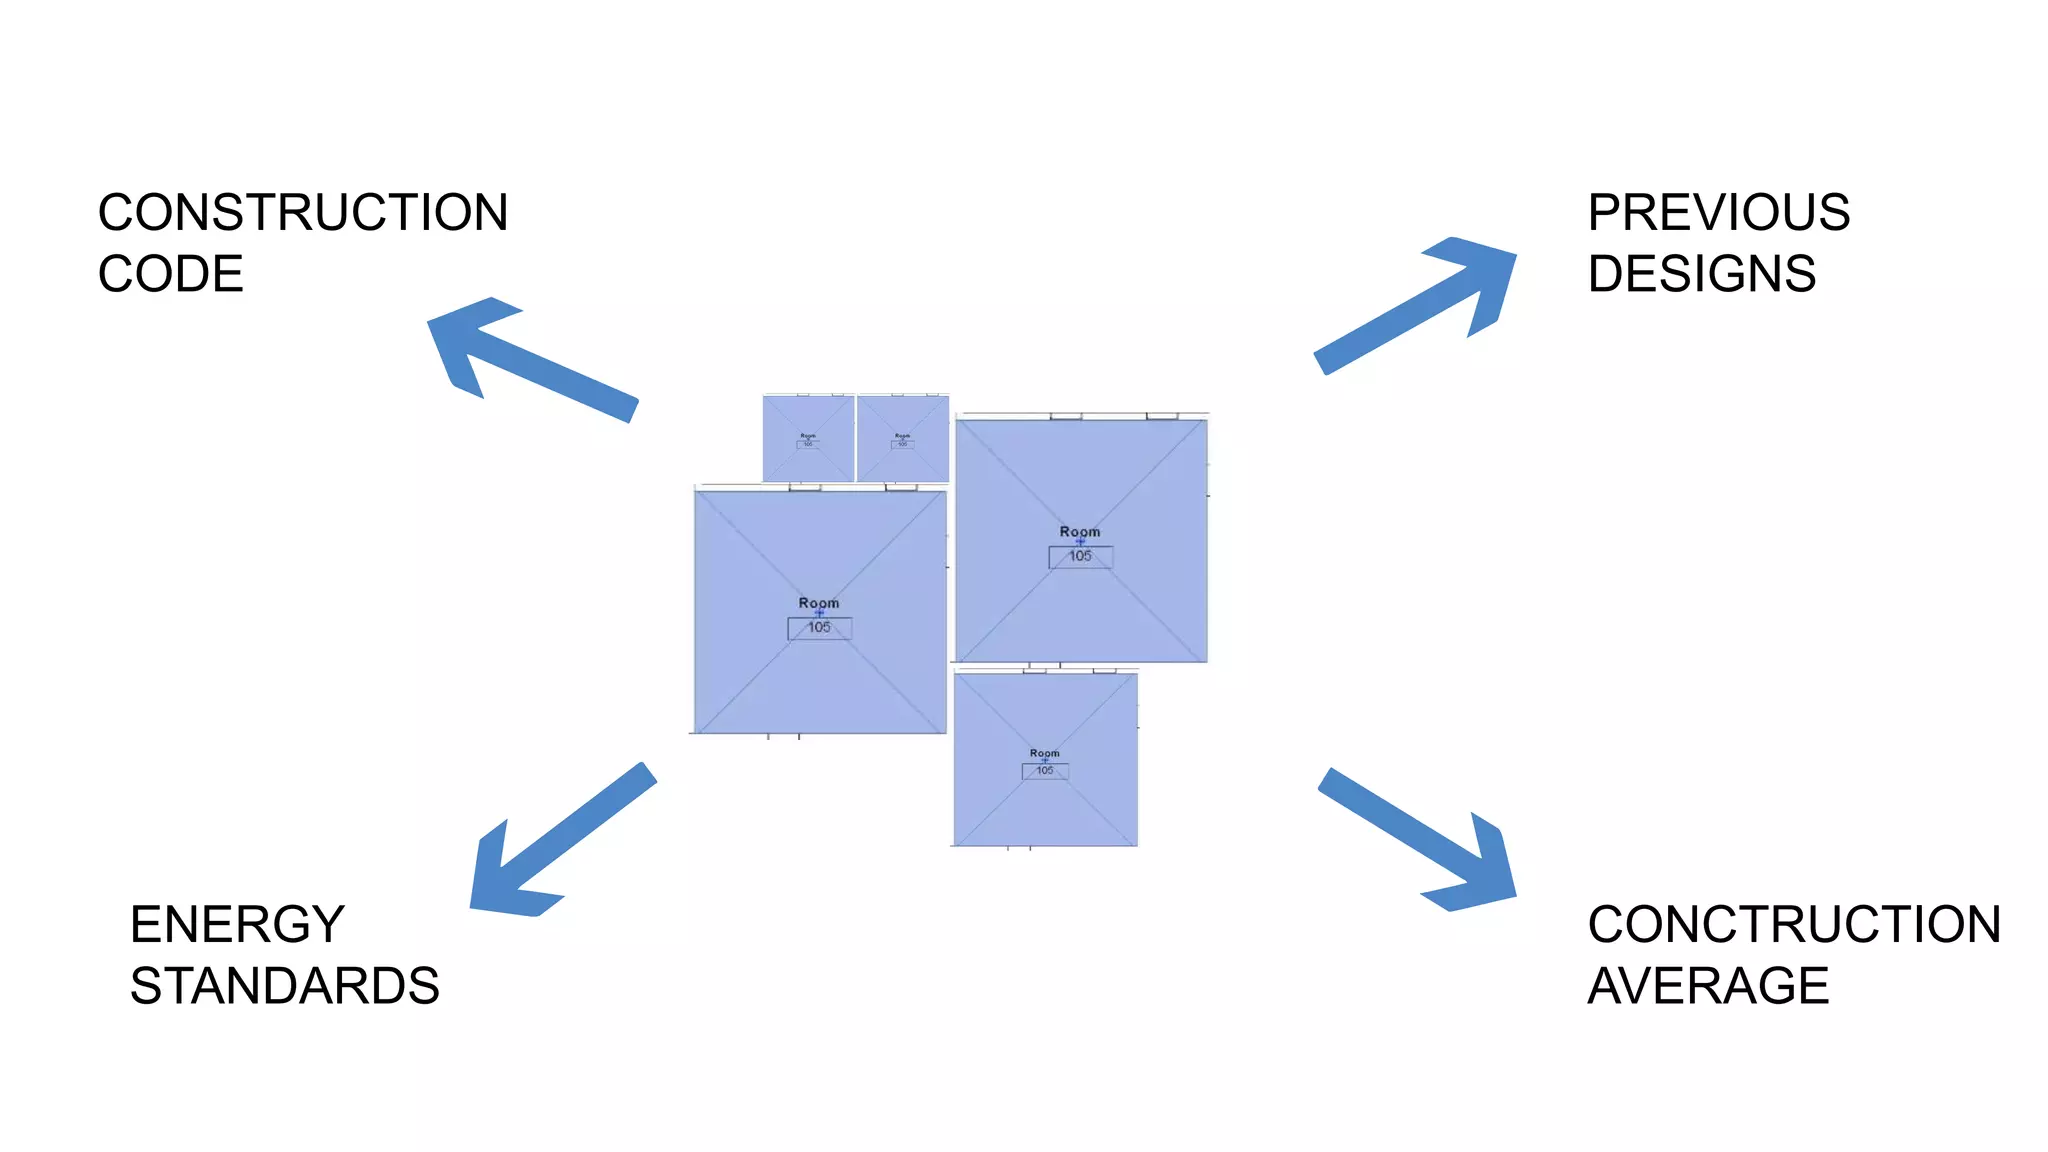
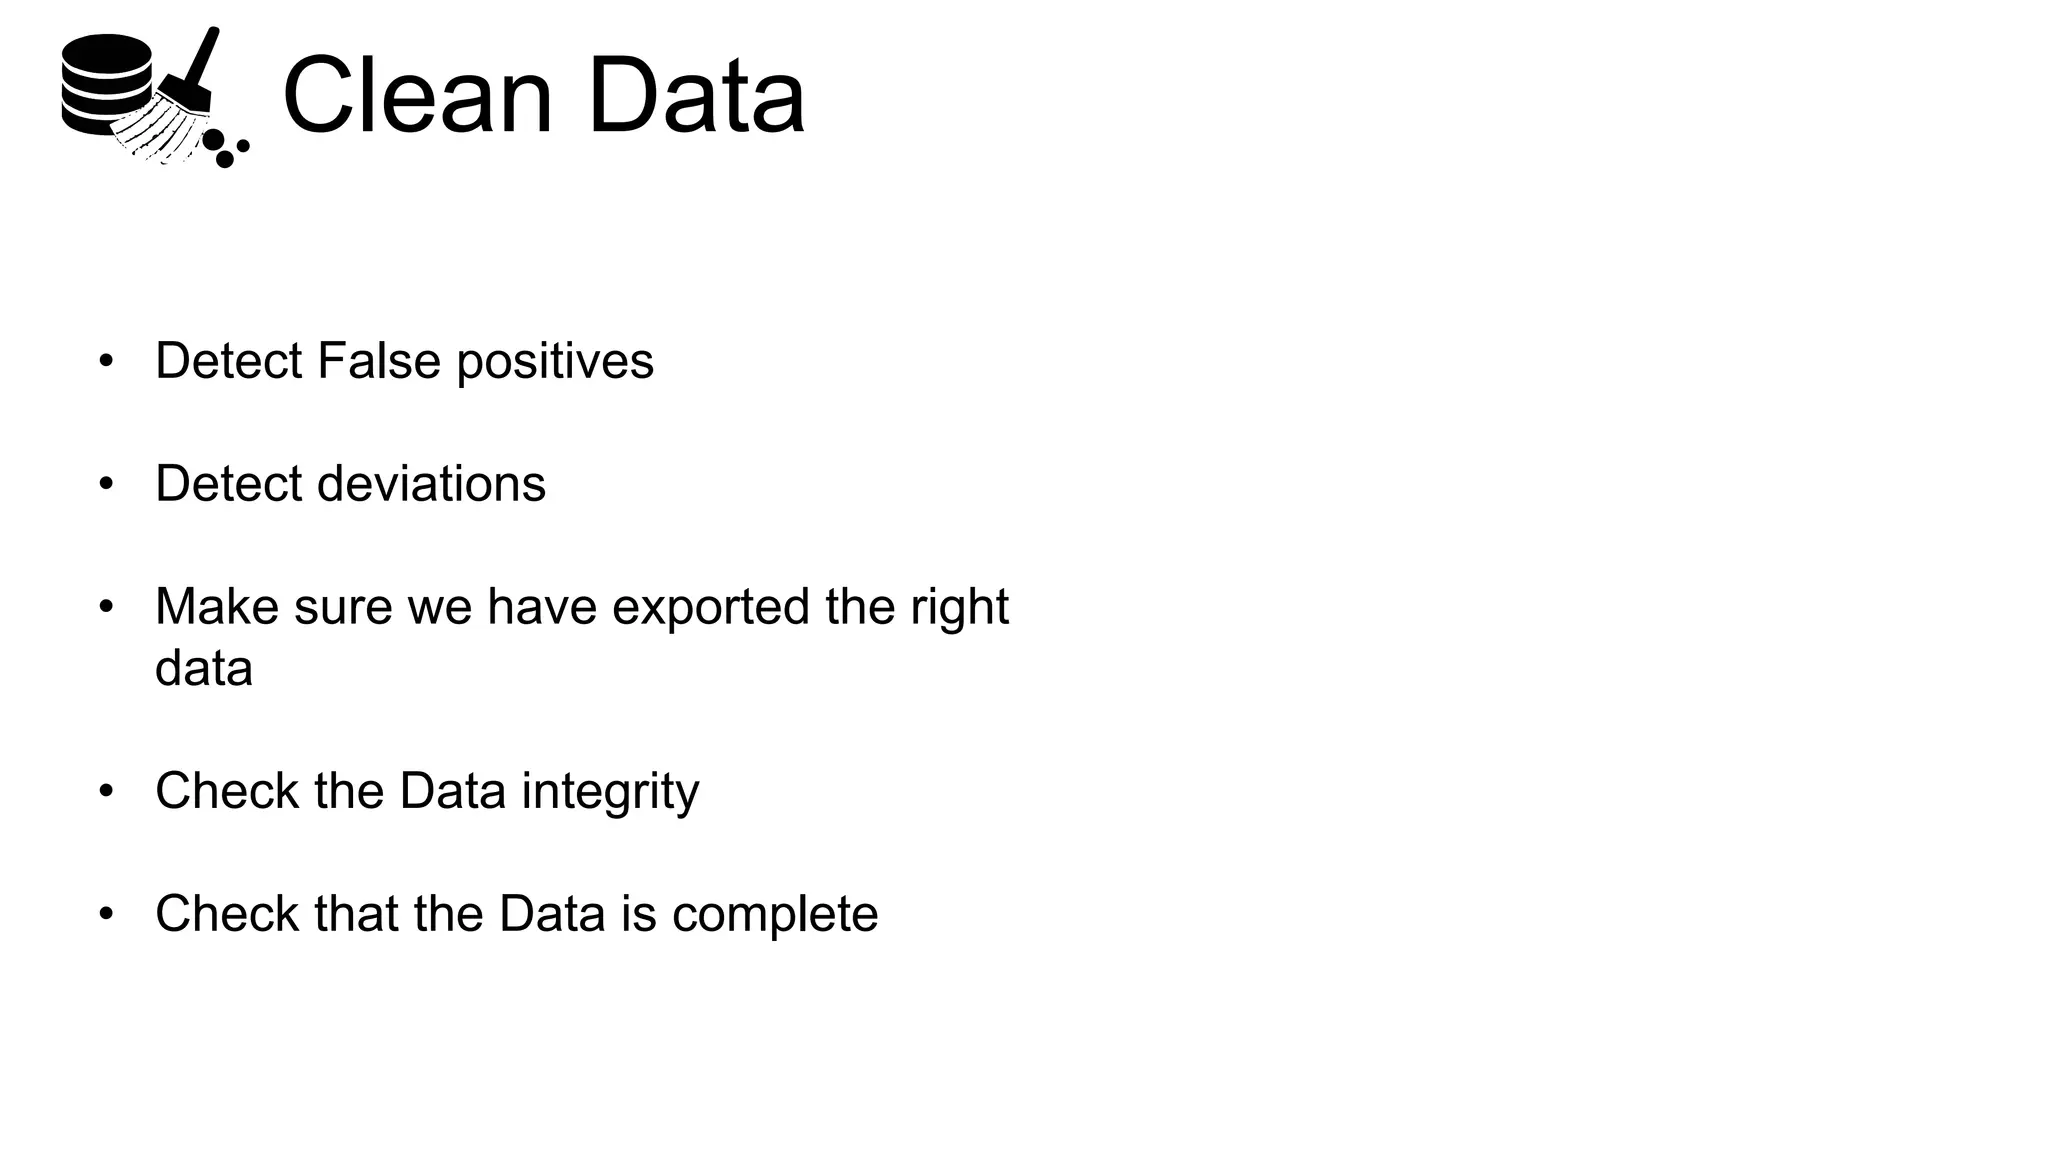
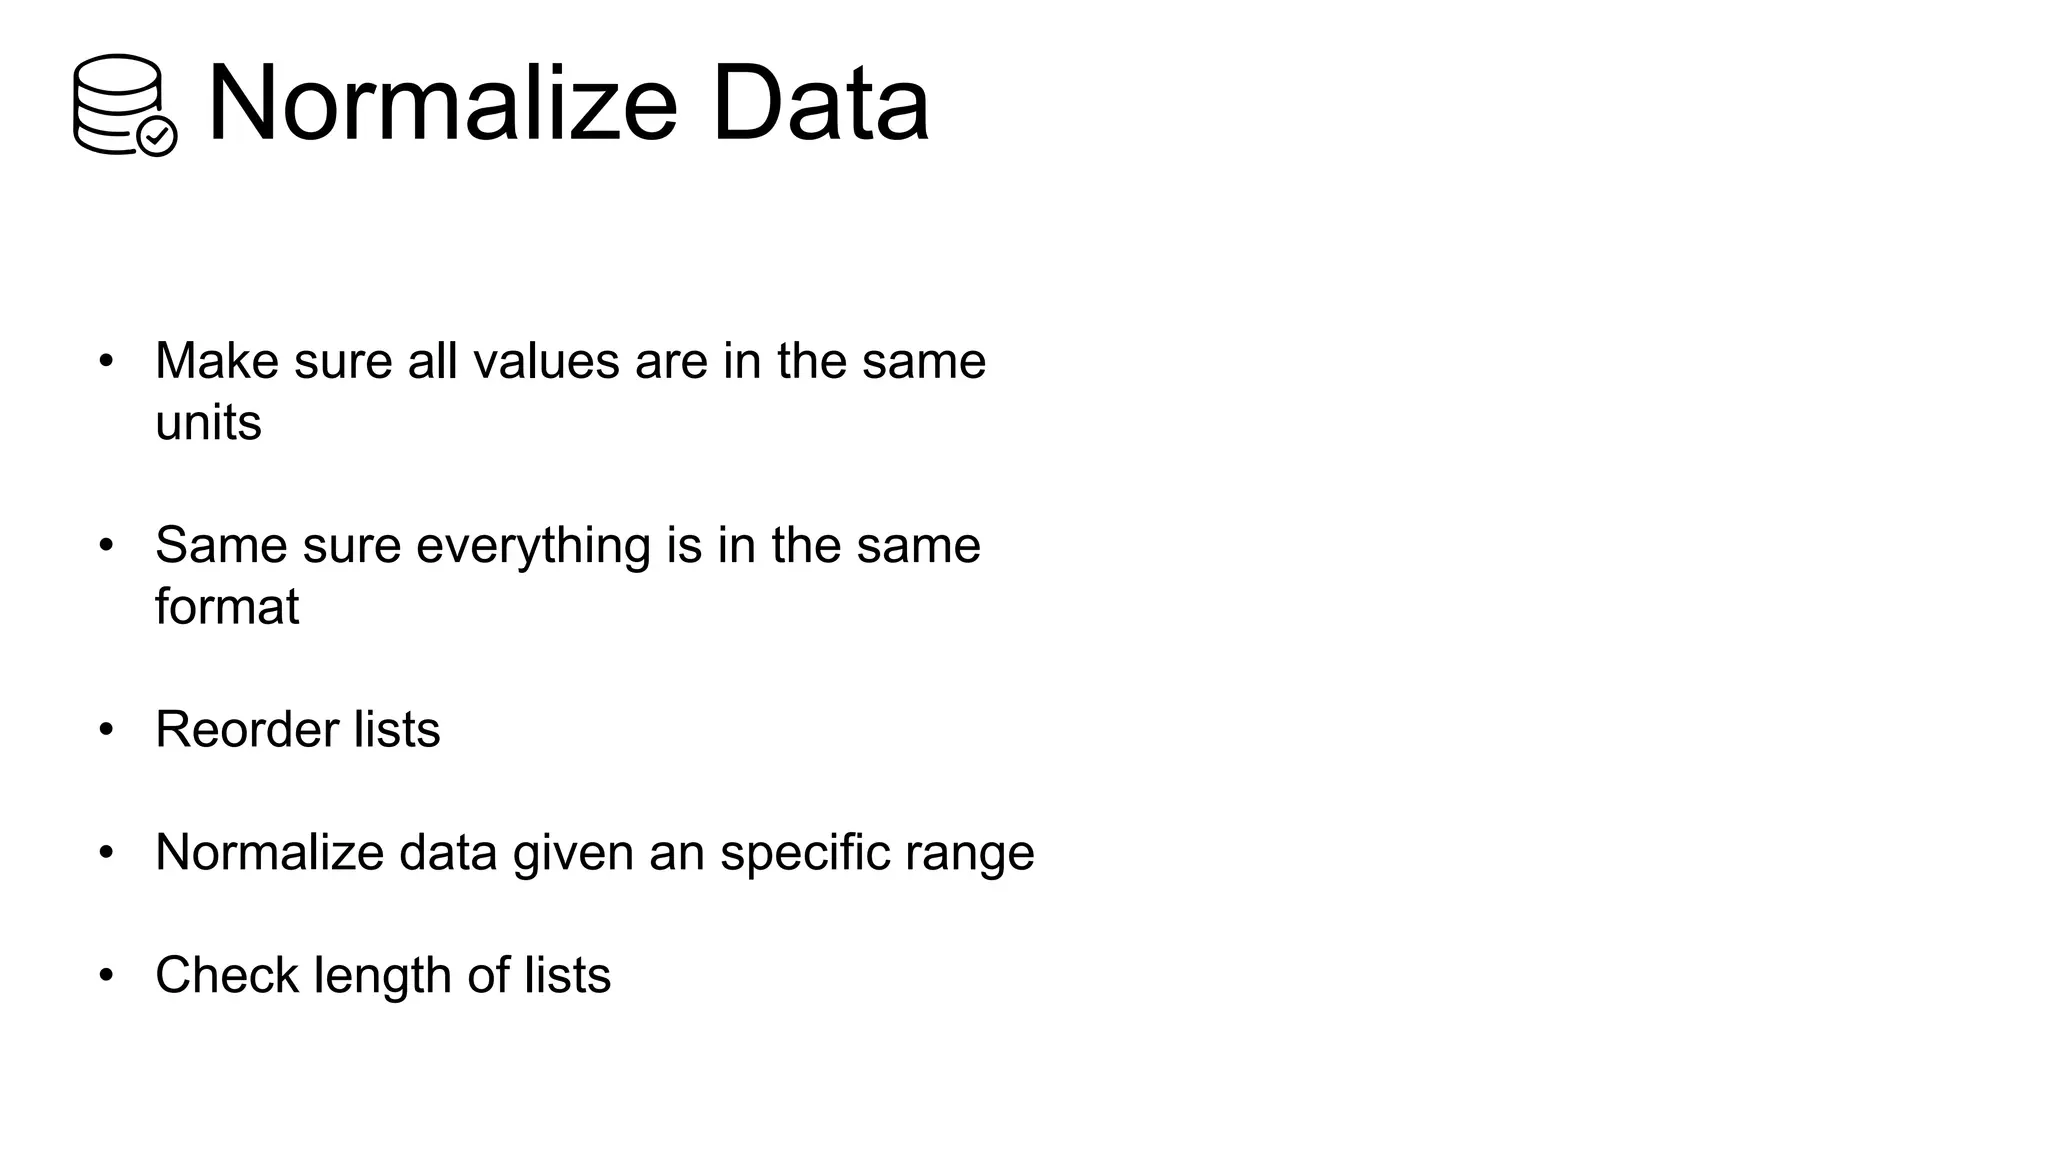
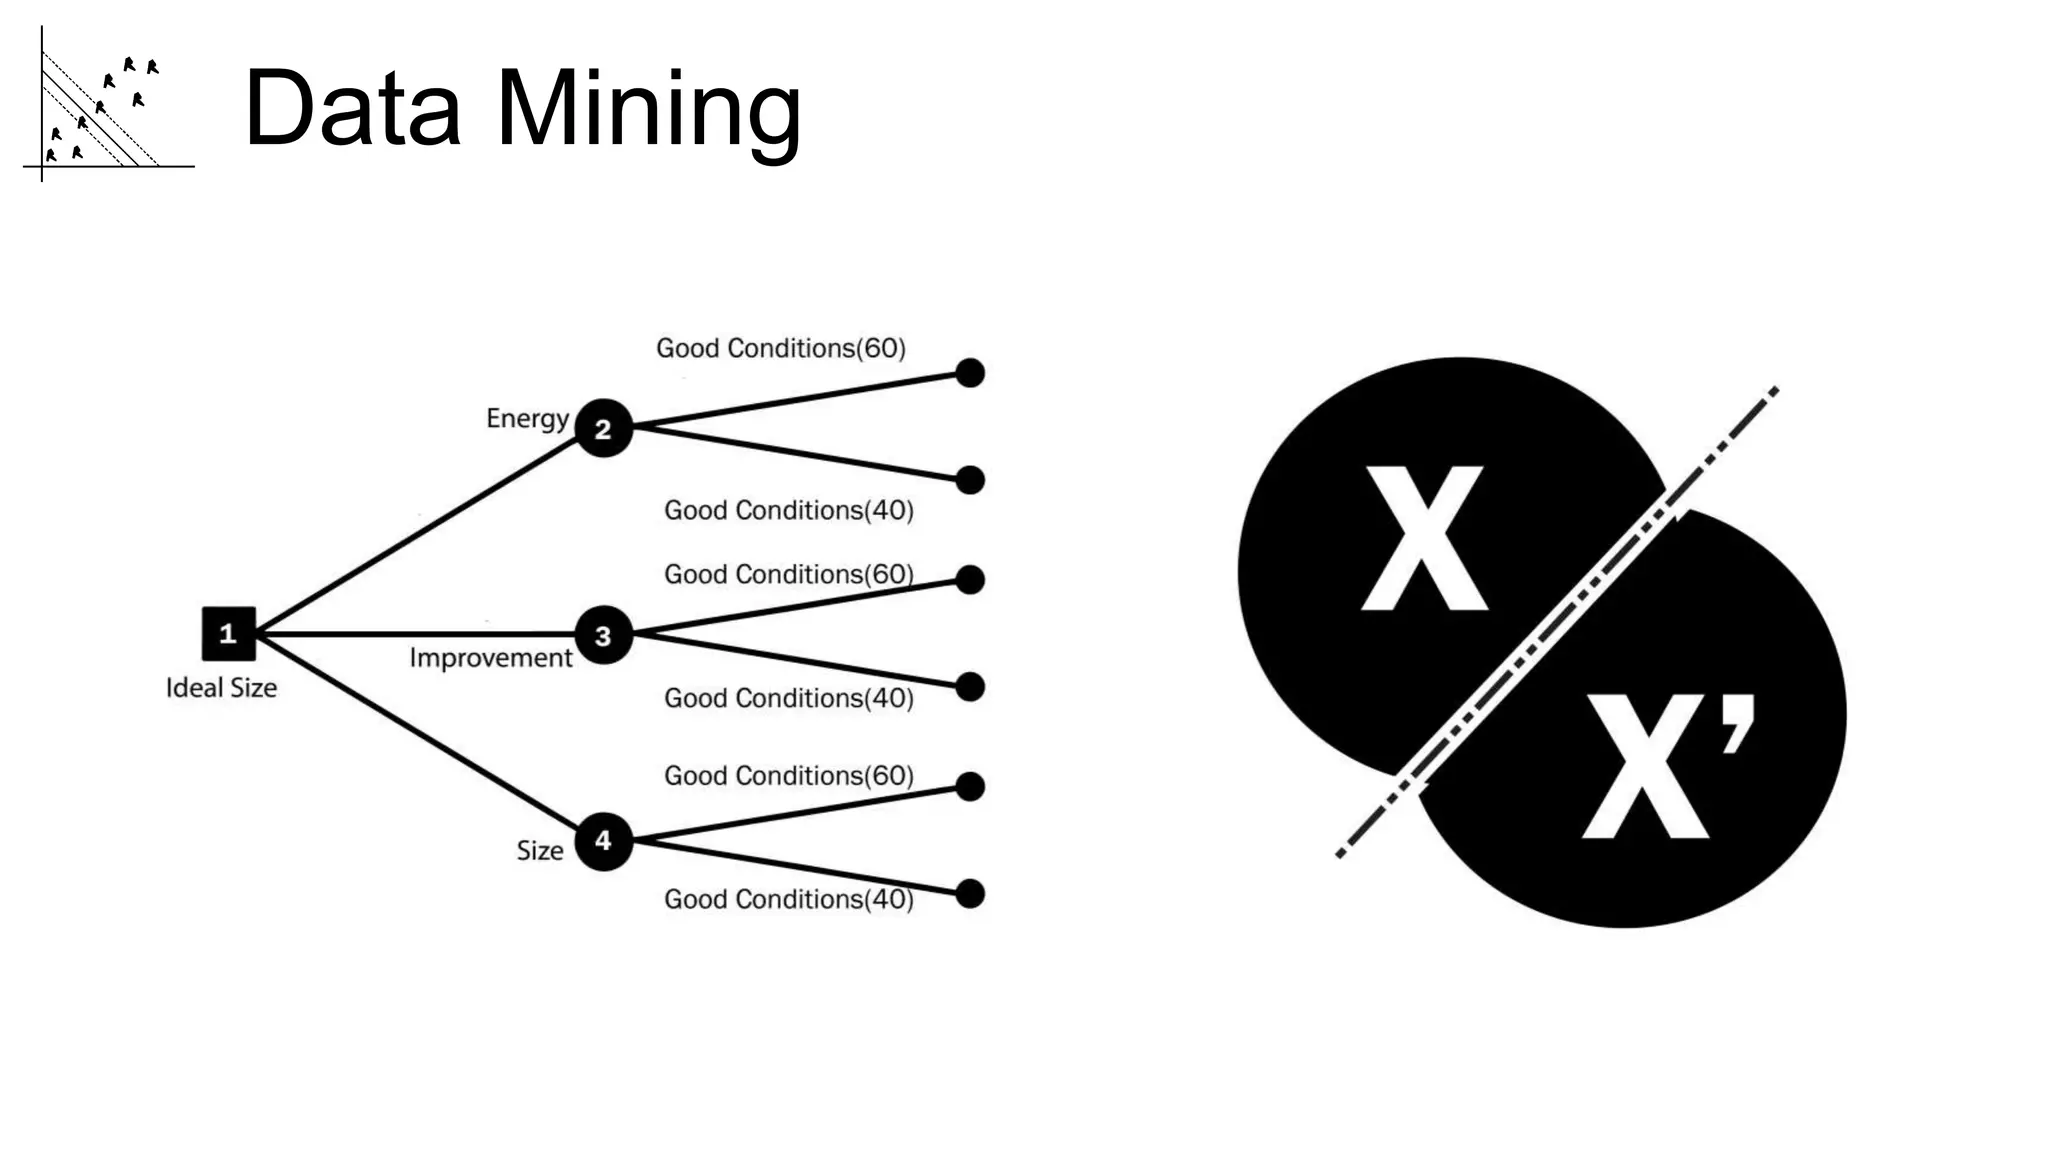
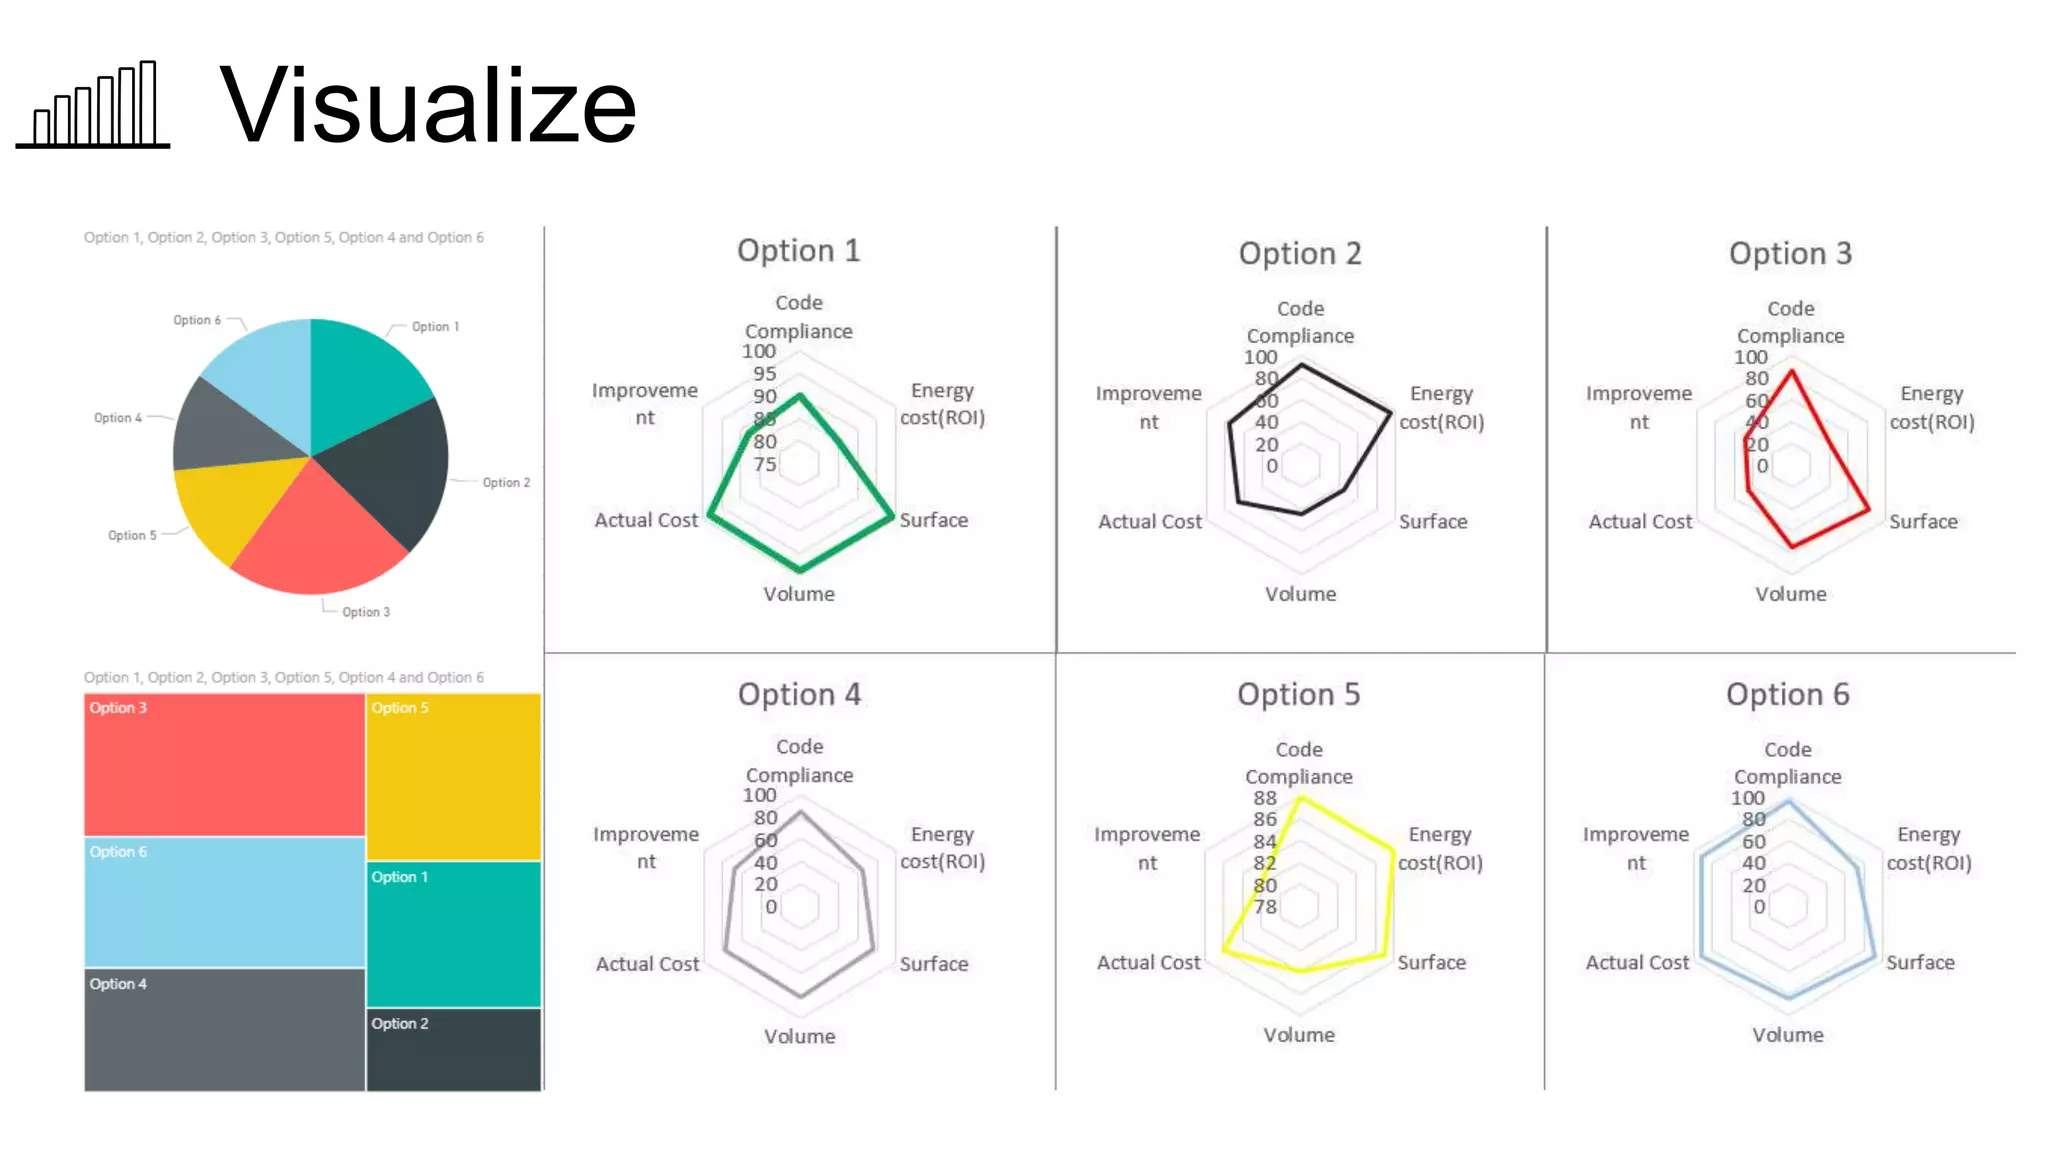

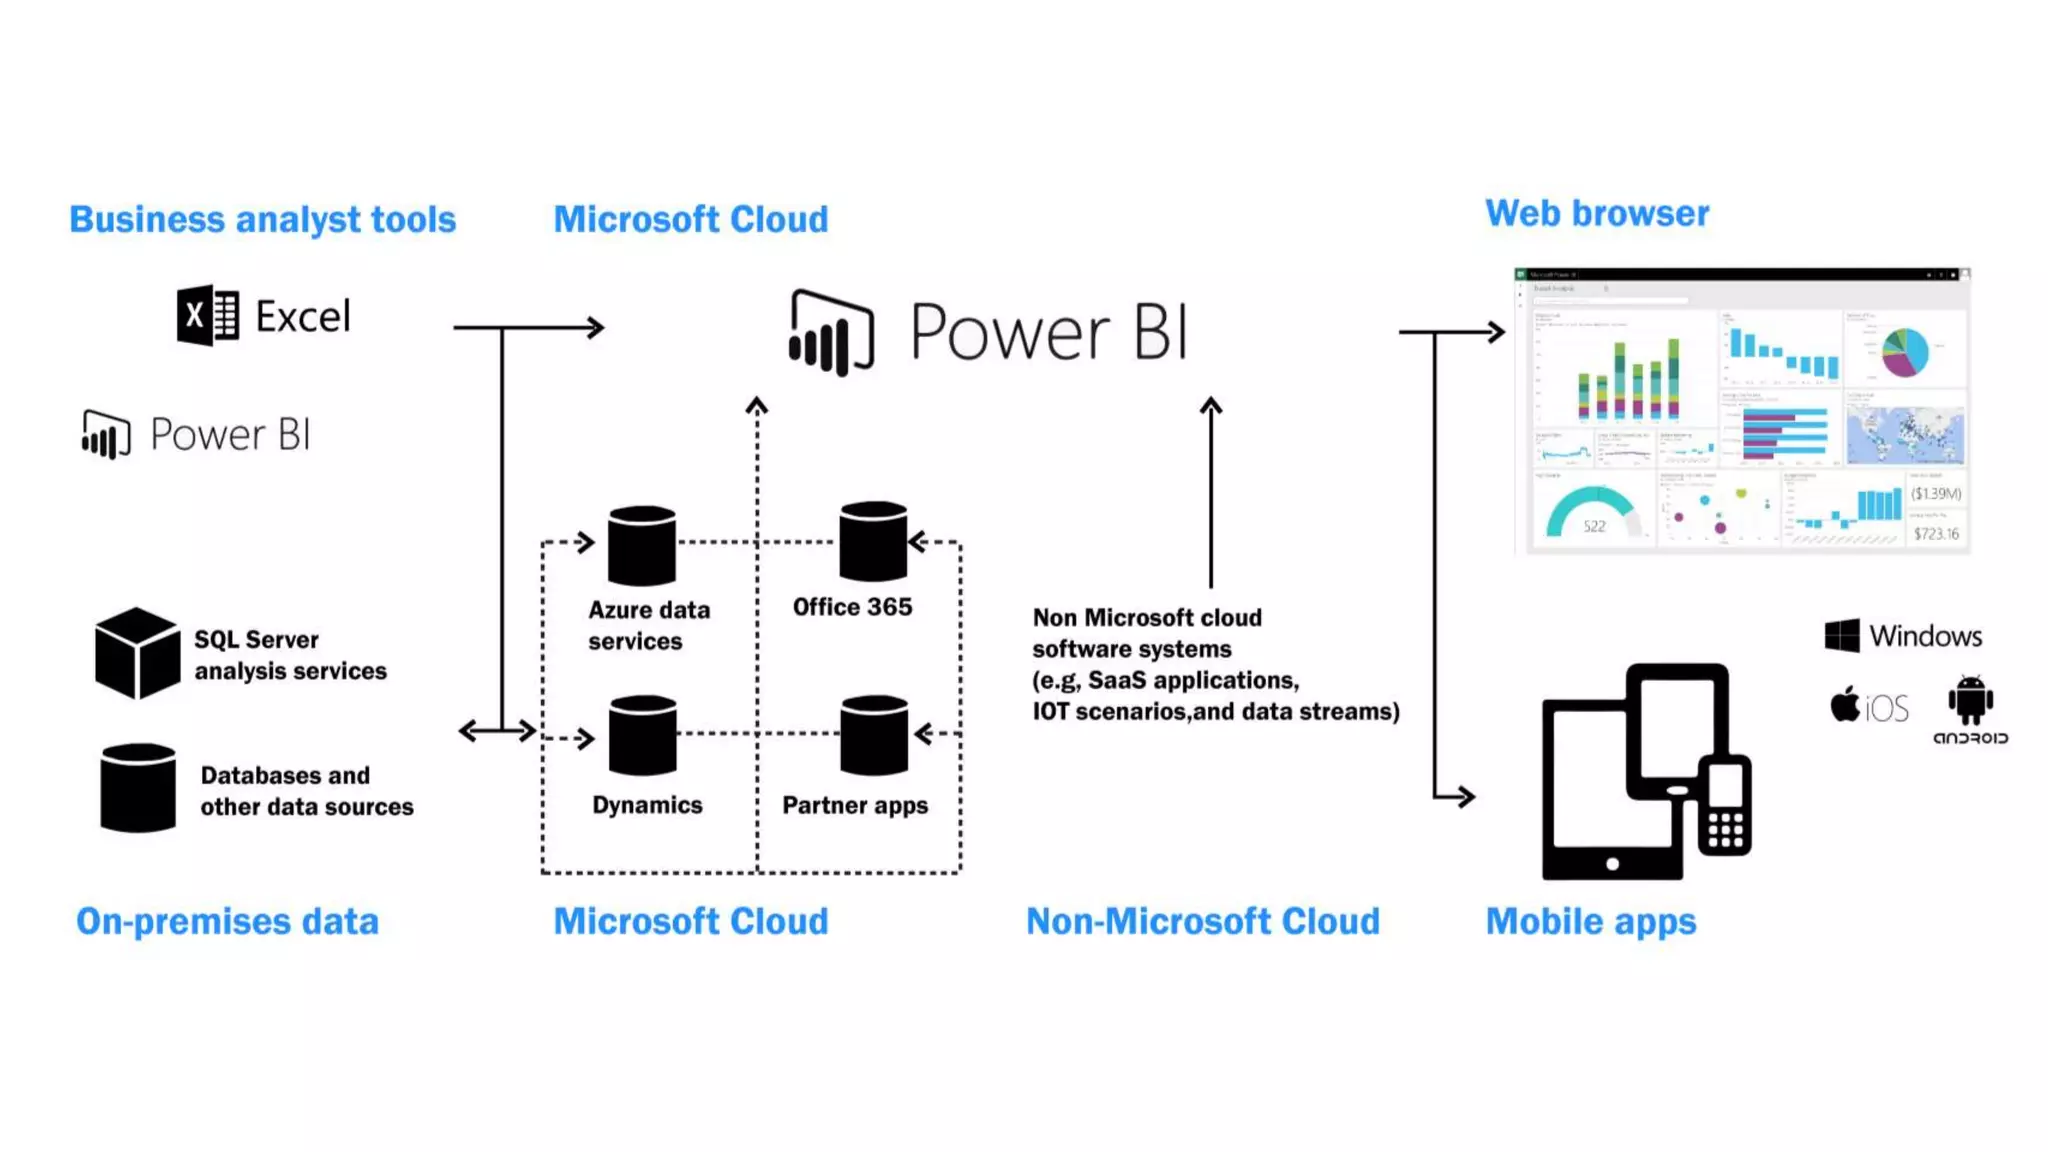
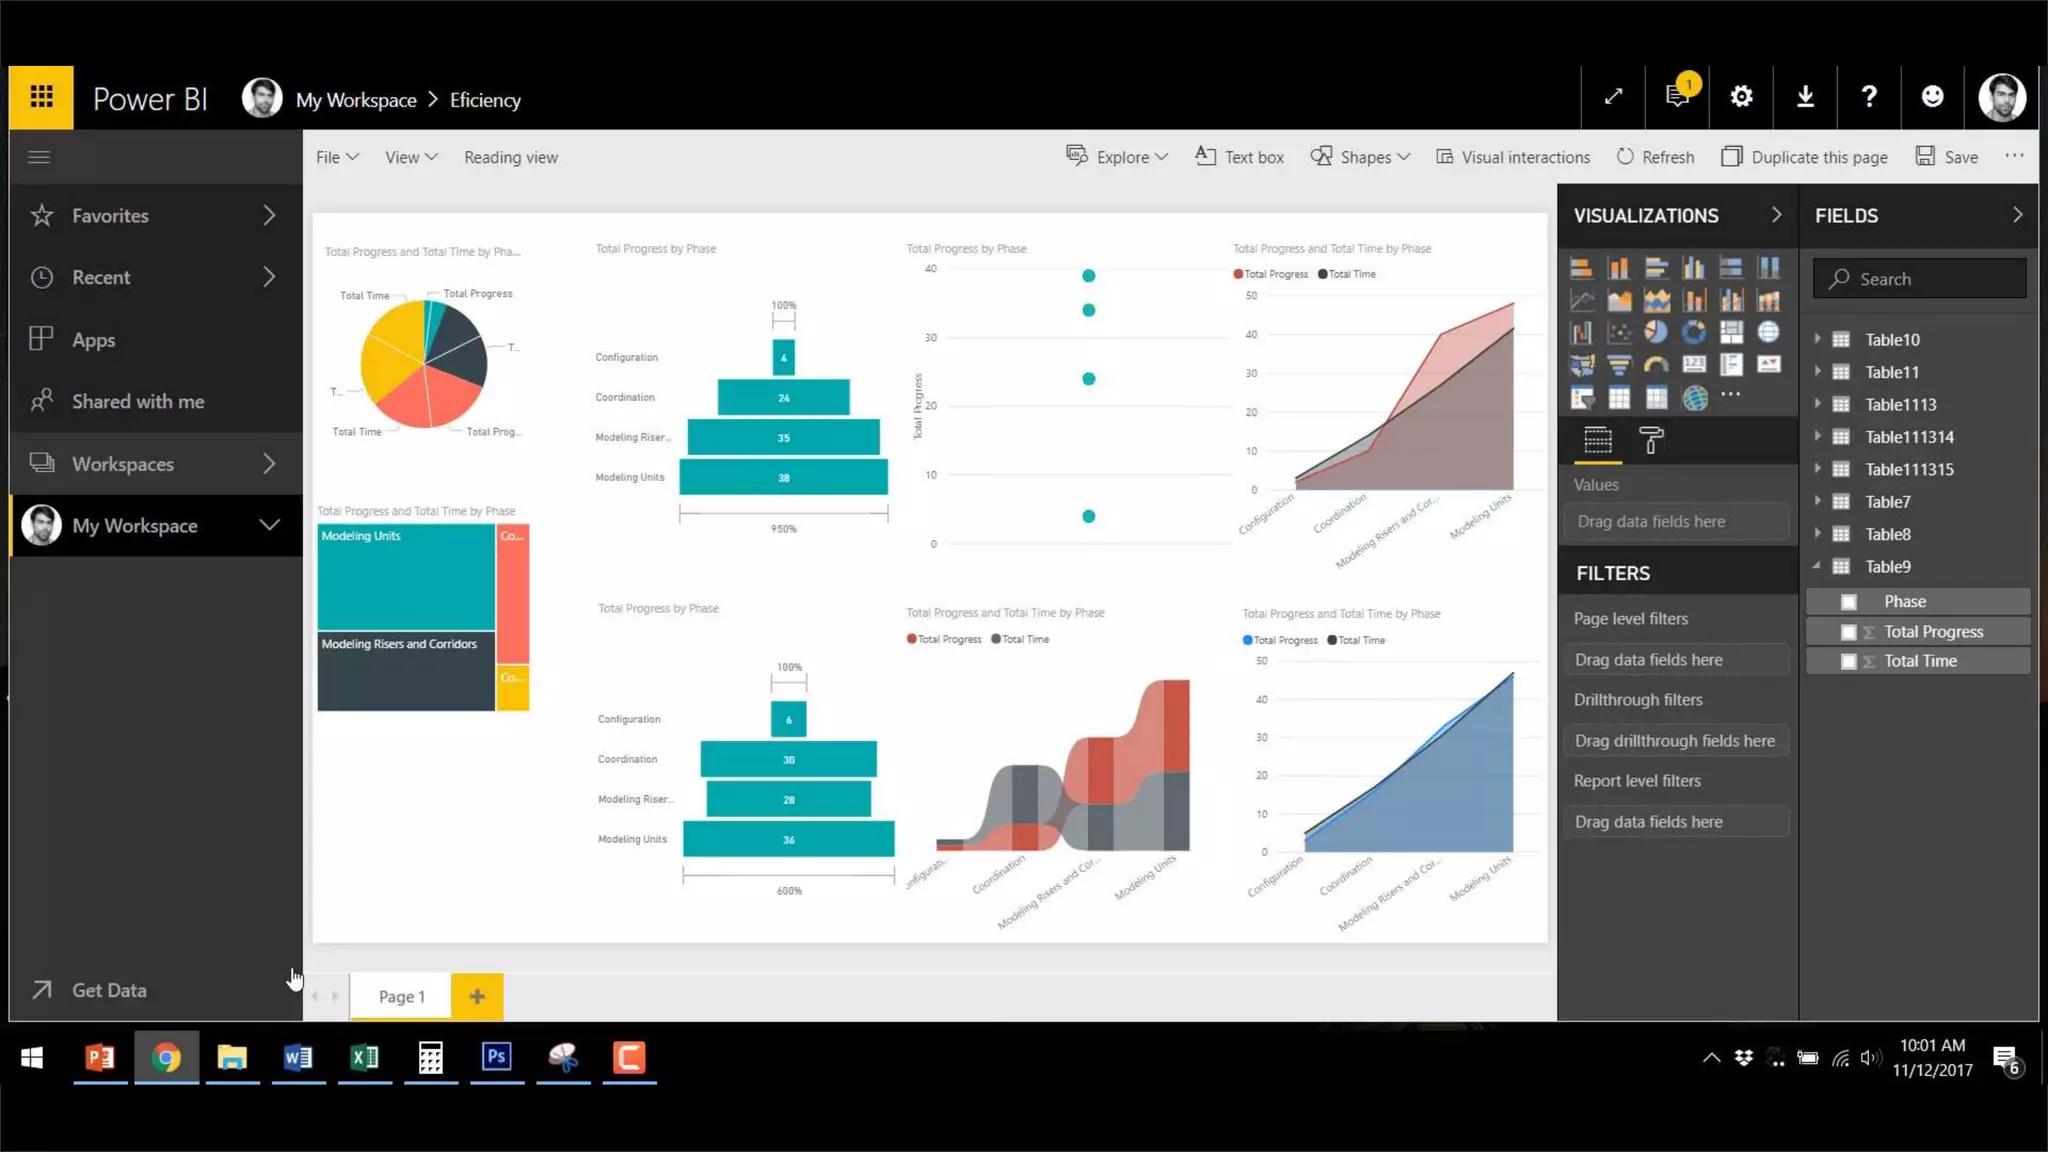

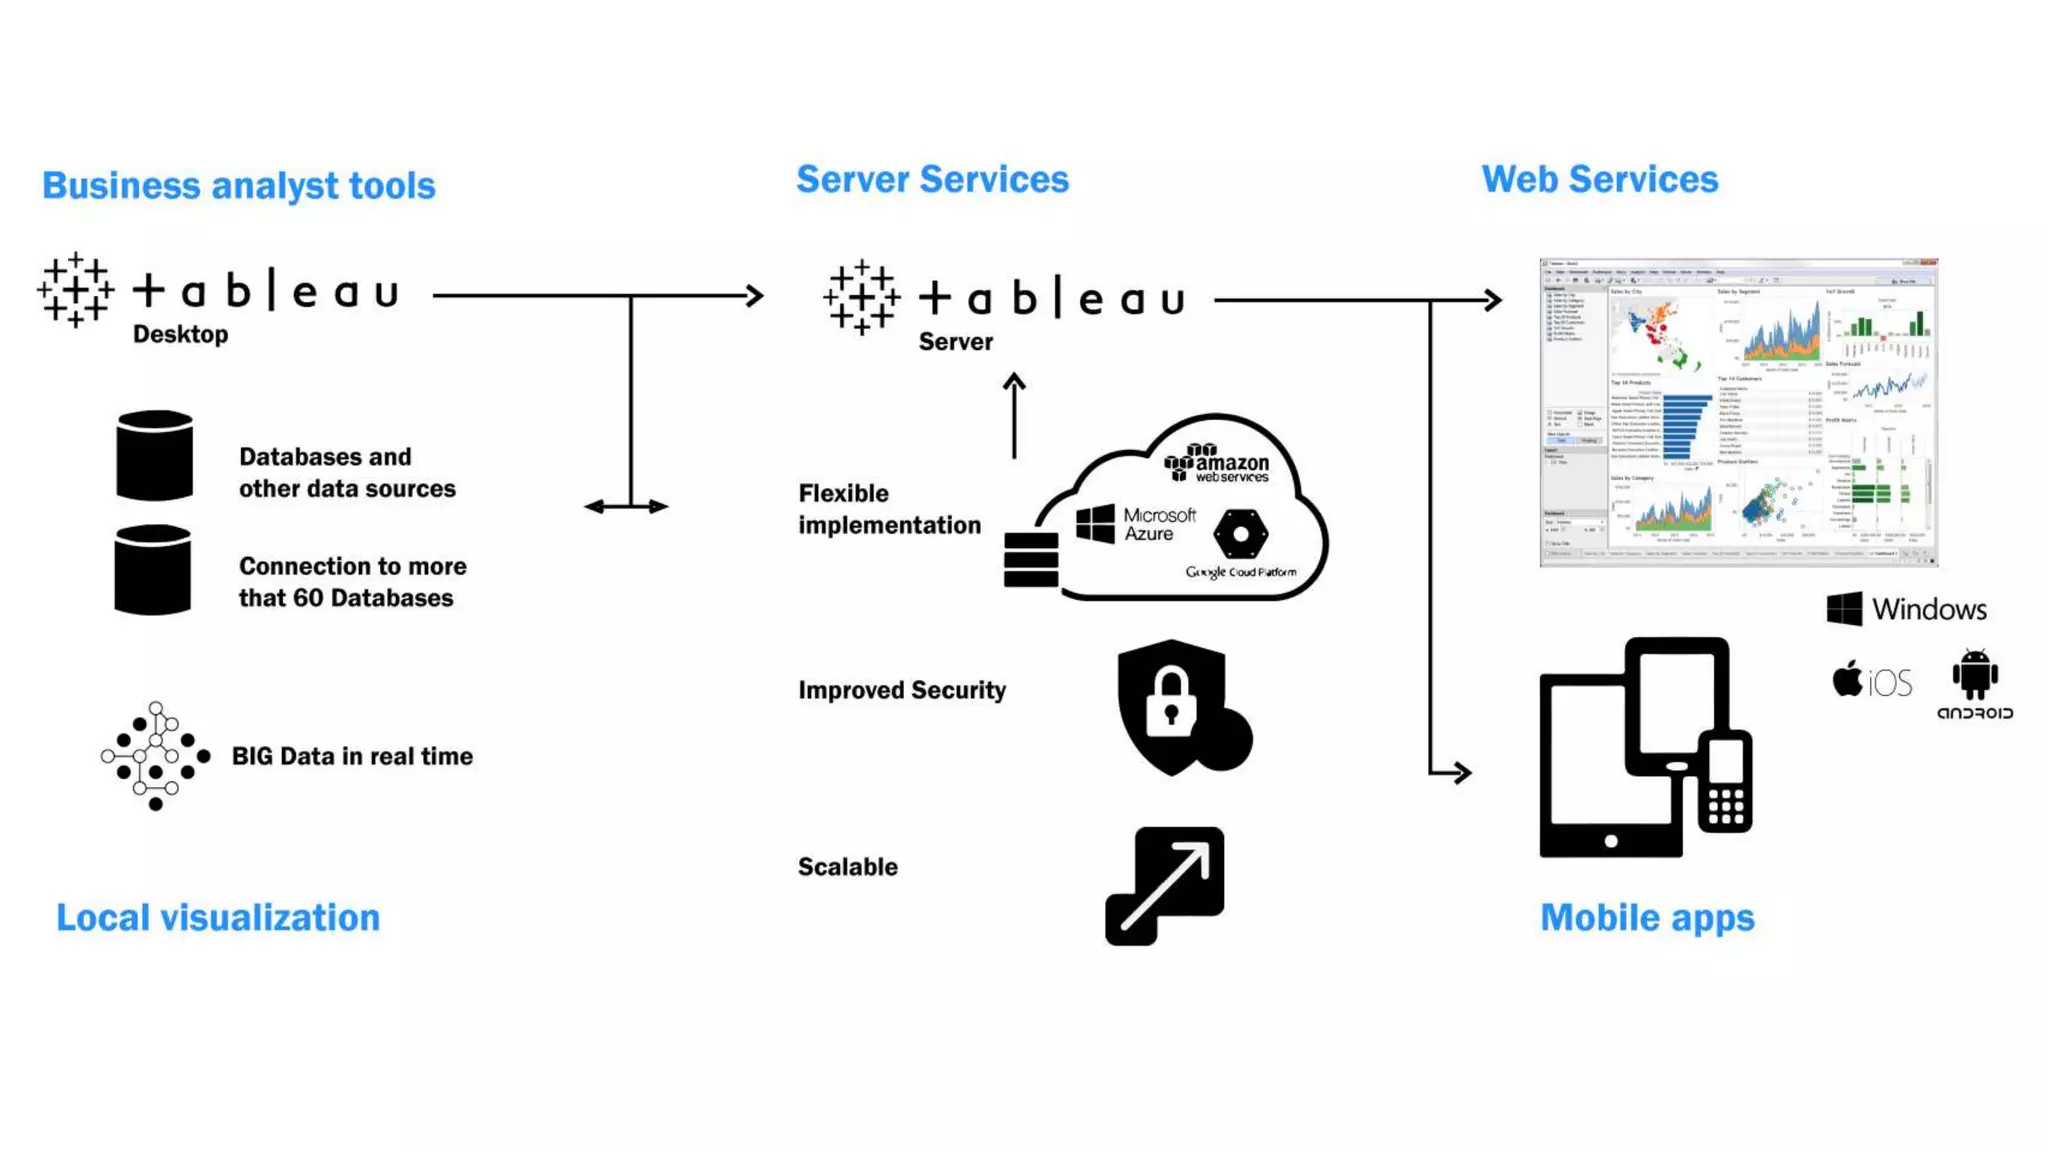
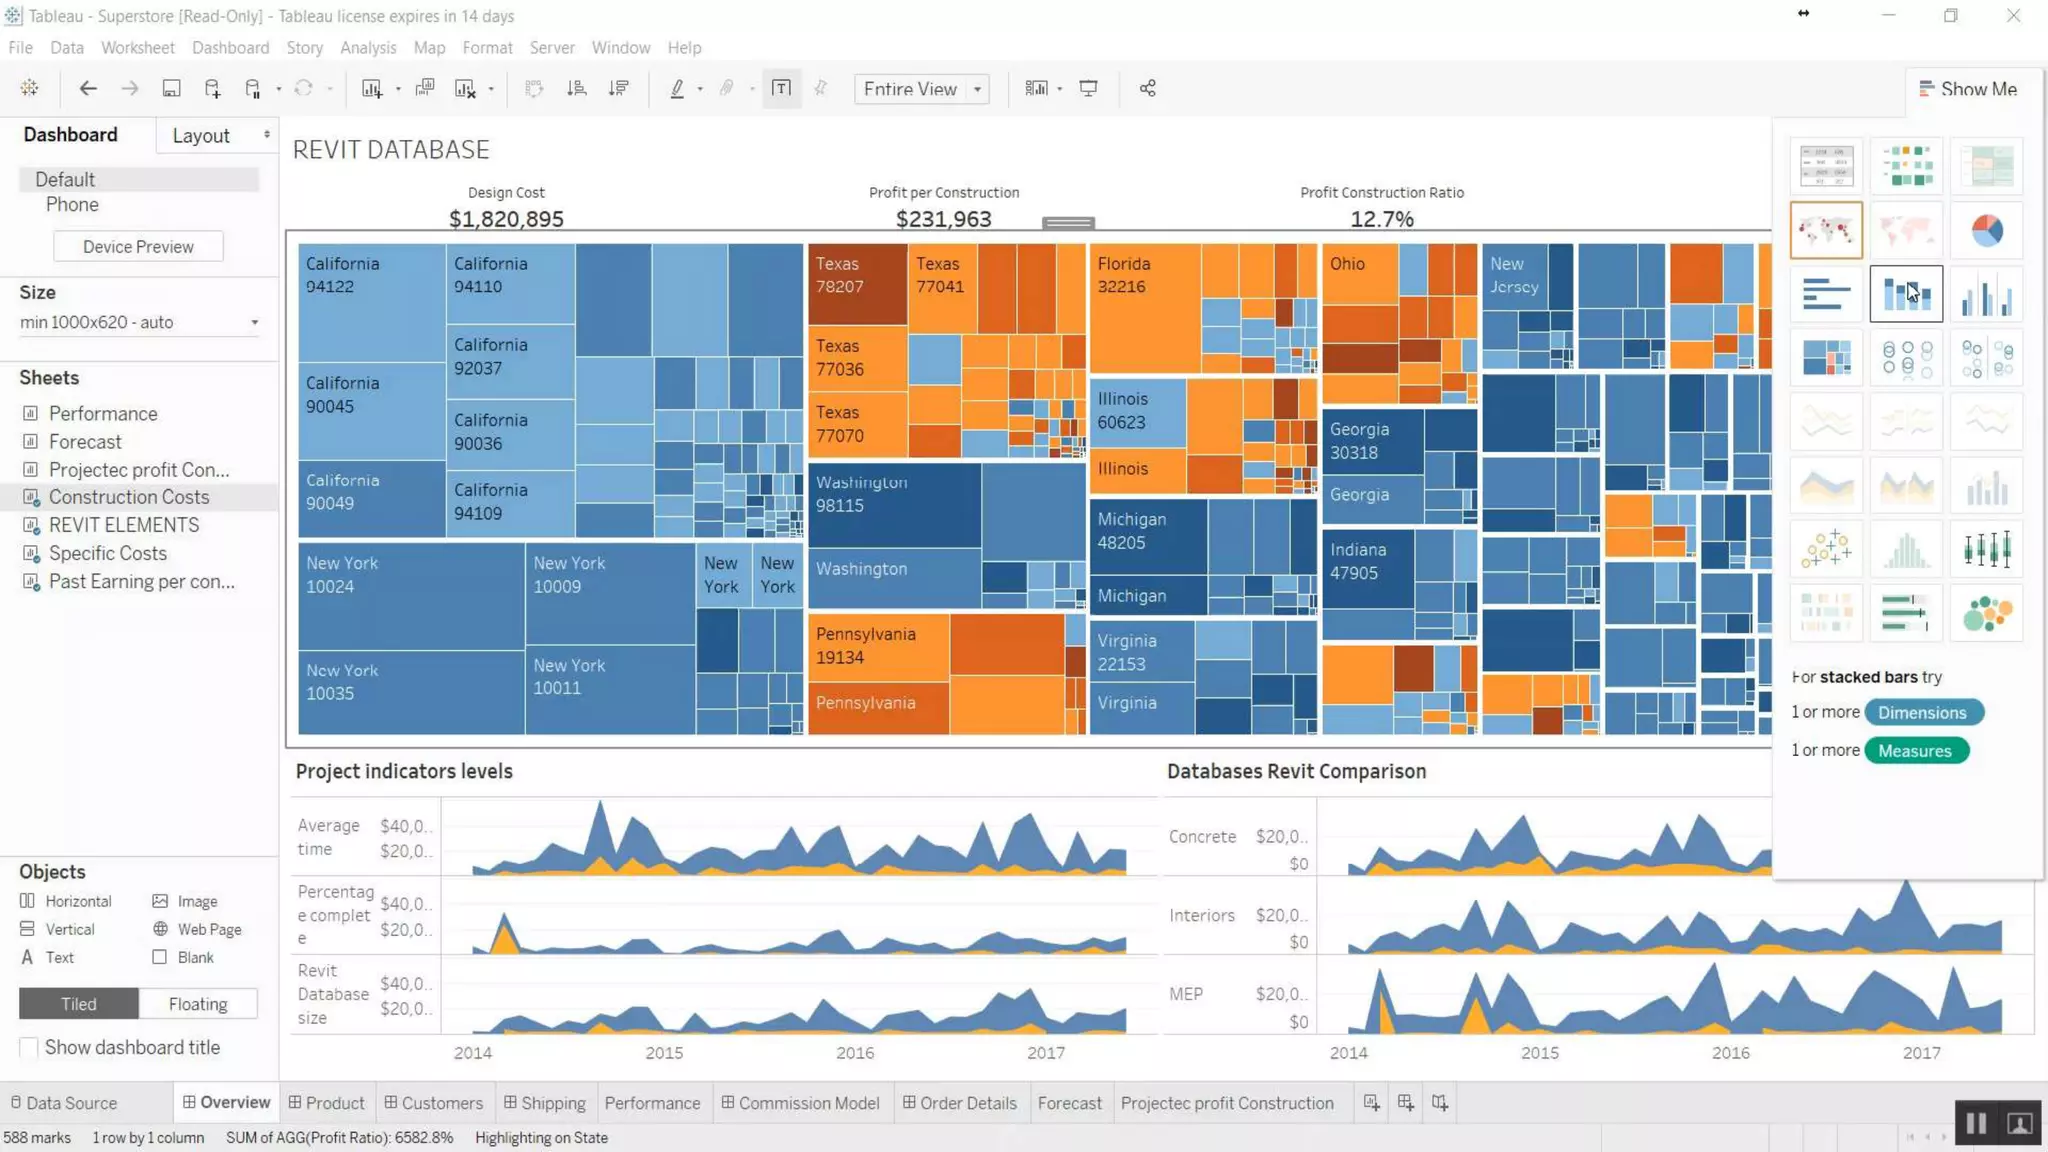
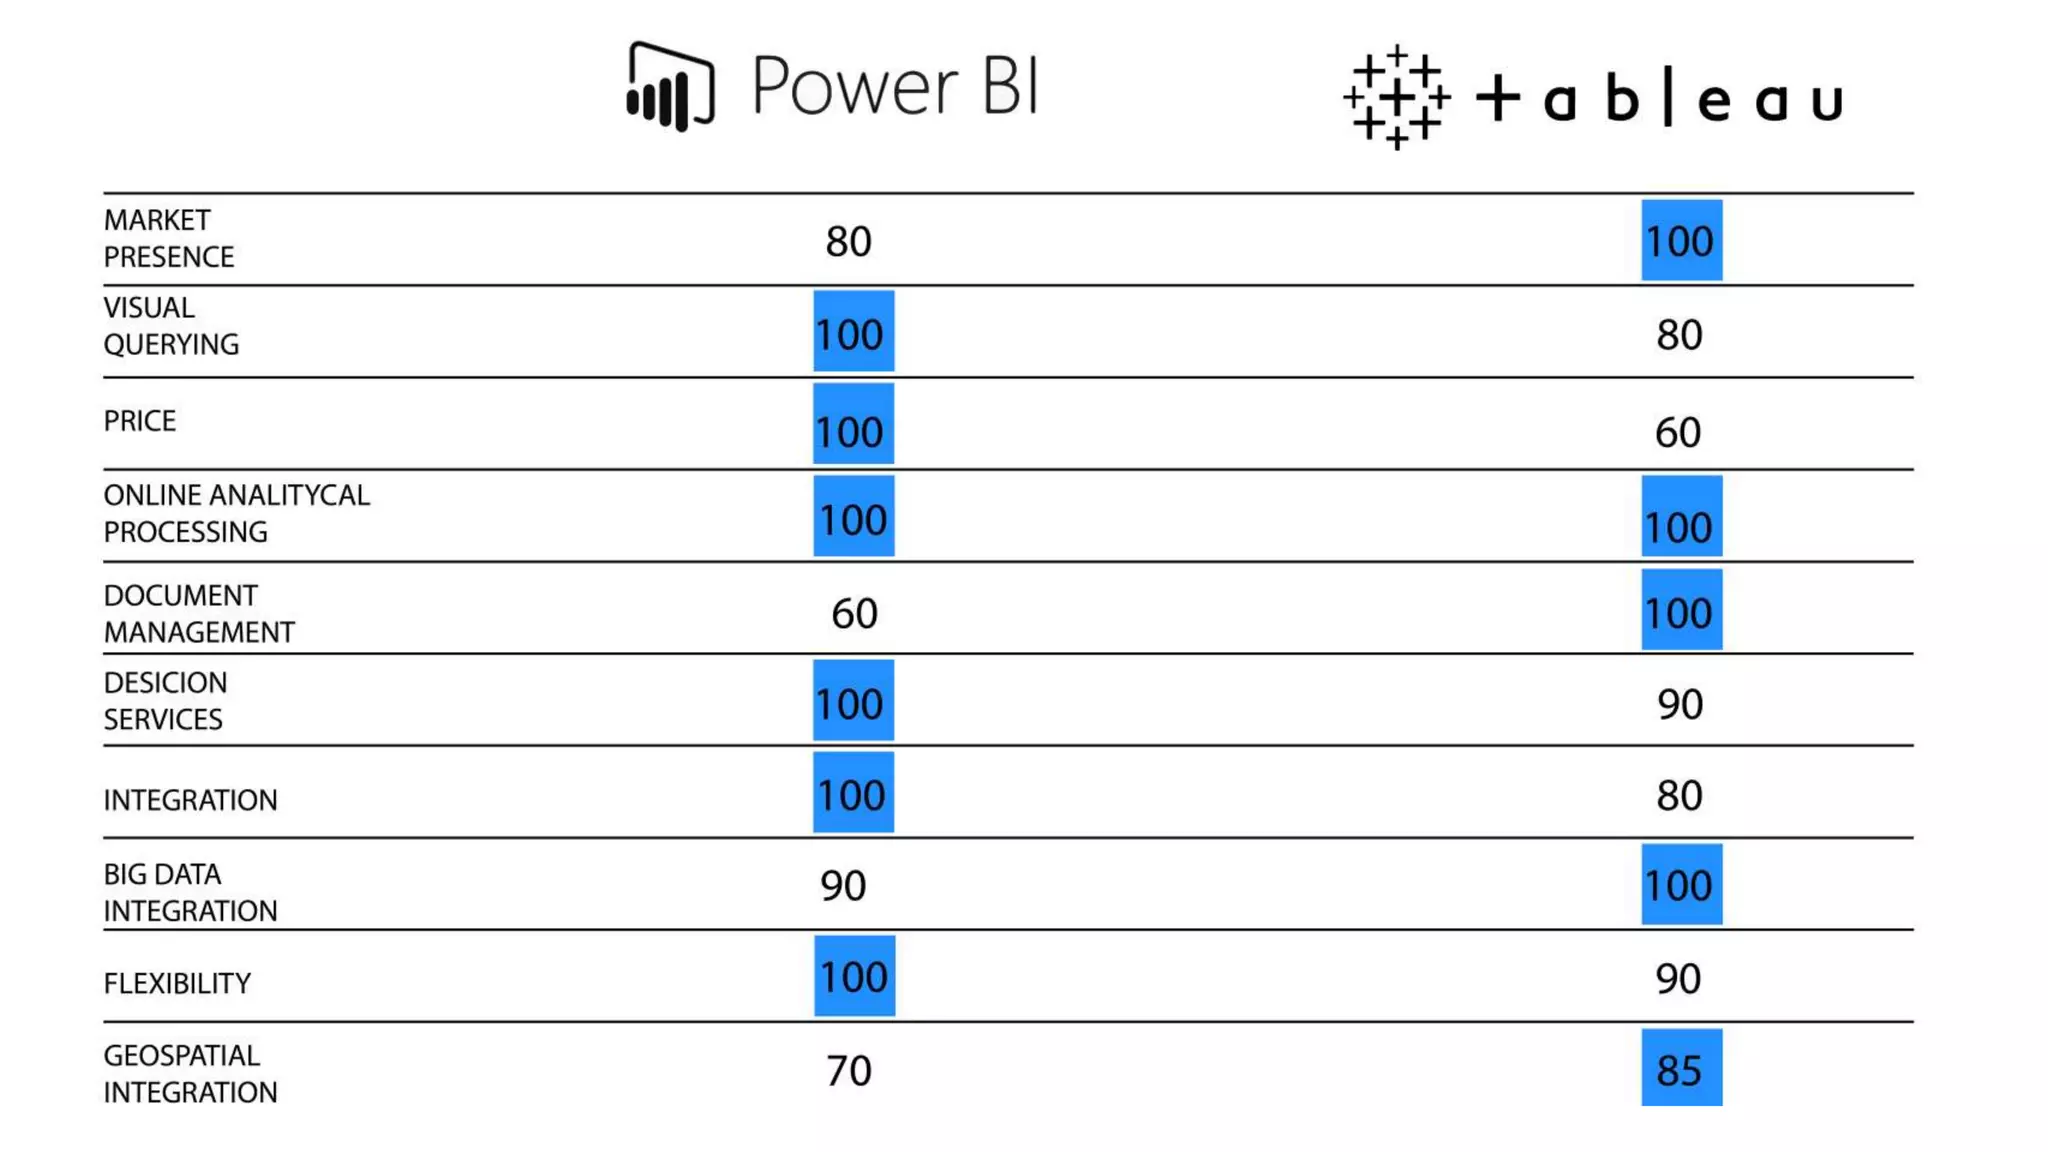
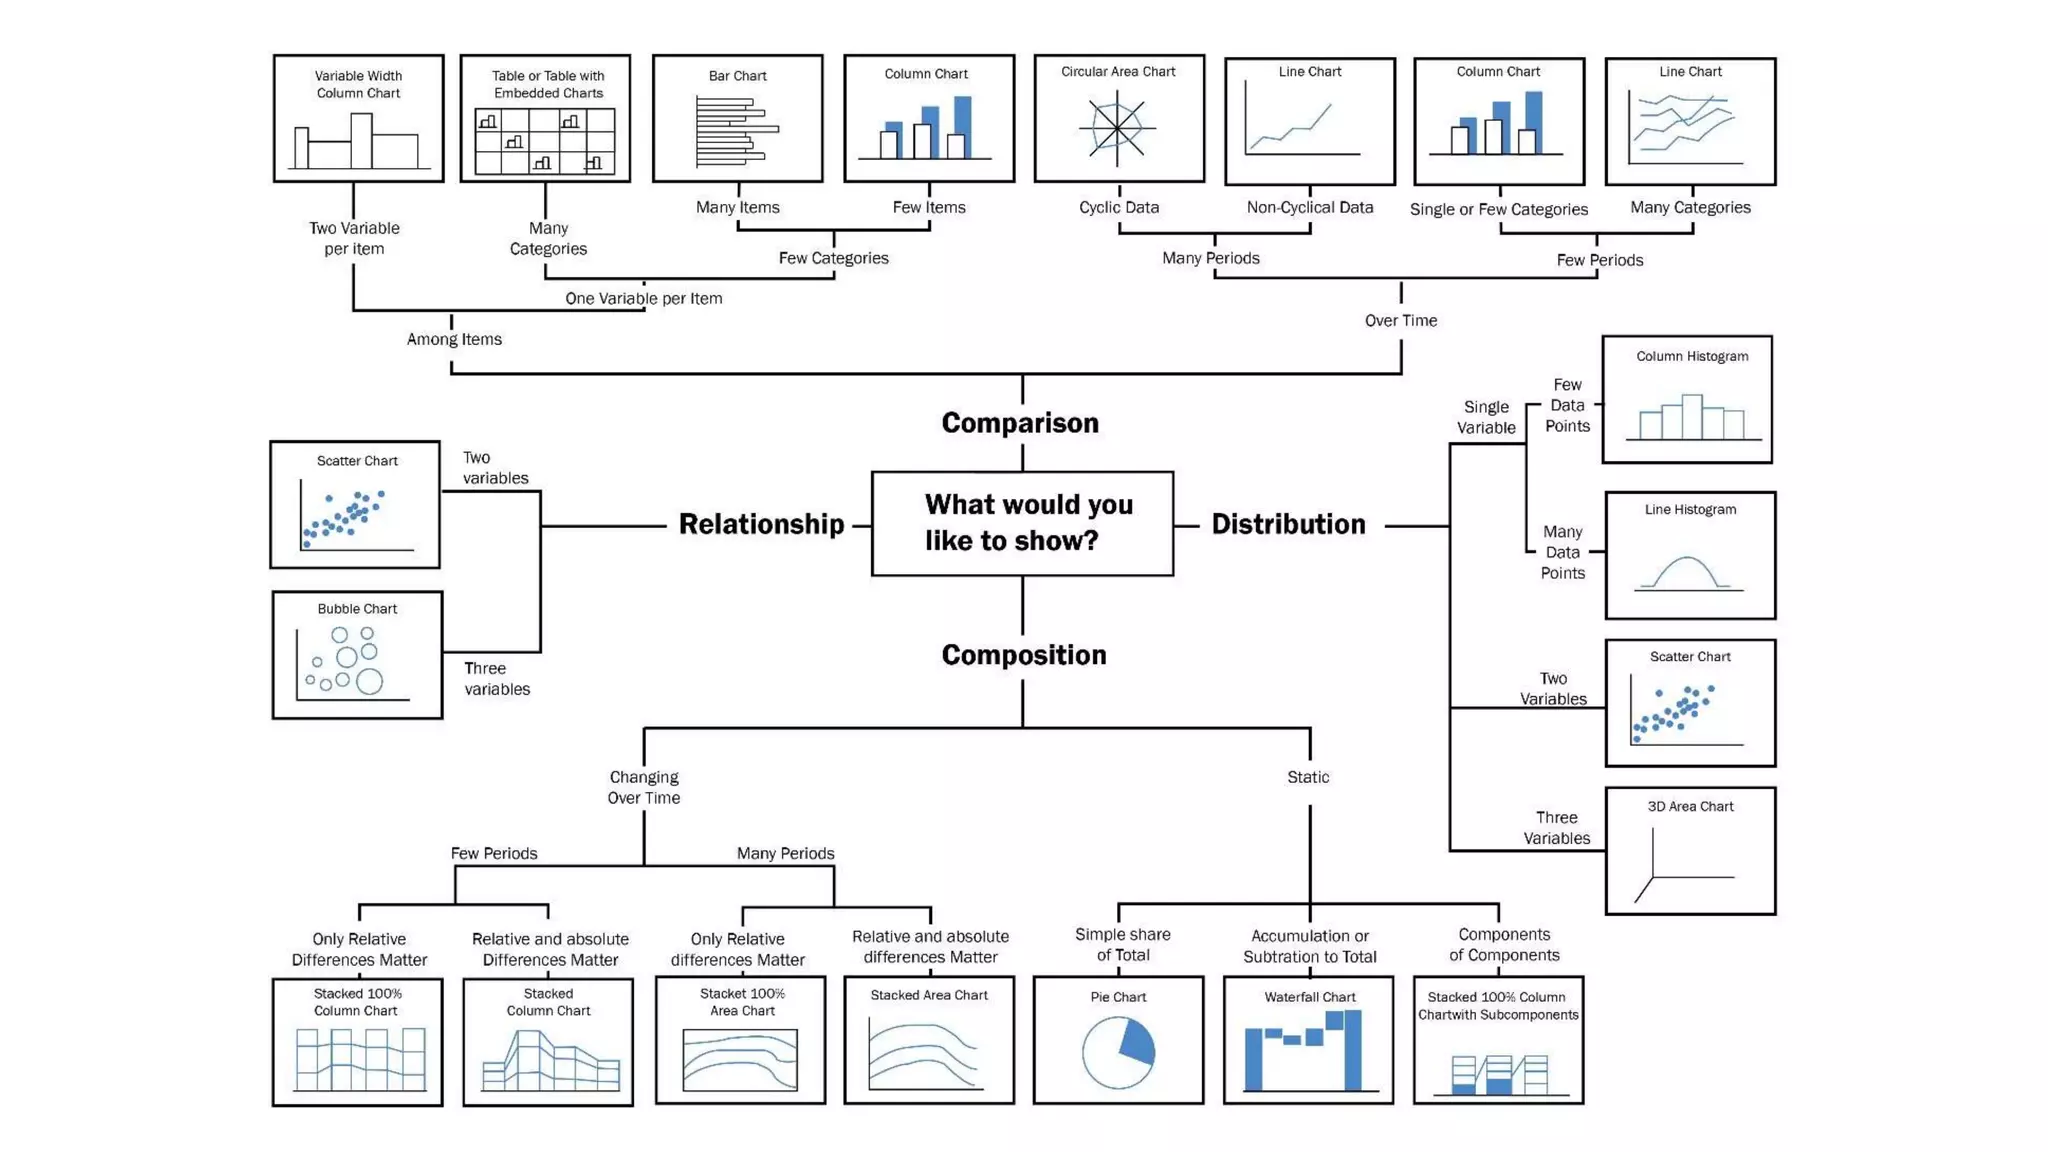


Valentin Noves, a BIM project manager at Engworks, discusses leveraging Revit data through visualization techniques and workflows aimed at enhancing architectural projects. The document outlines objectives for understanding and transforming Revit data using tools like Power BI and Tableau, along with methods for ensuring data integrity and effective visualization. It highlights Noves's extensive experience in BIM, emphasizing the importance of automation and data normalization in current design practices.