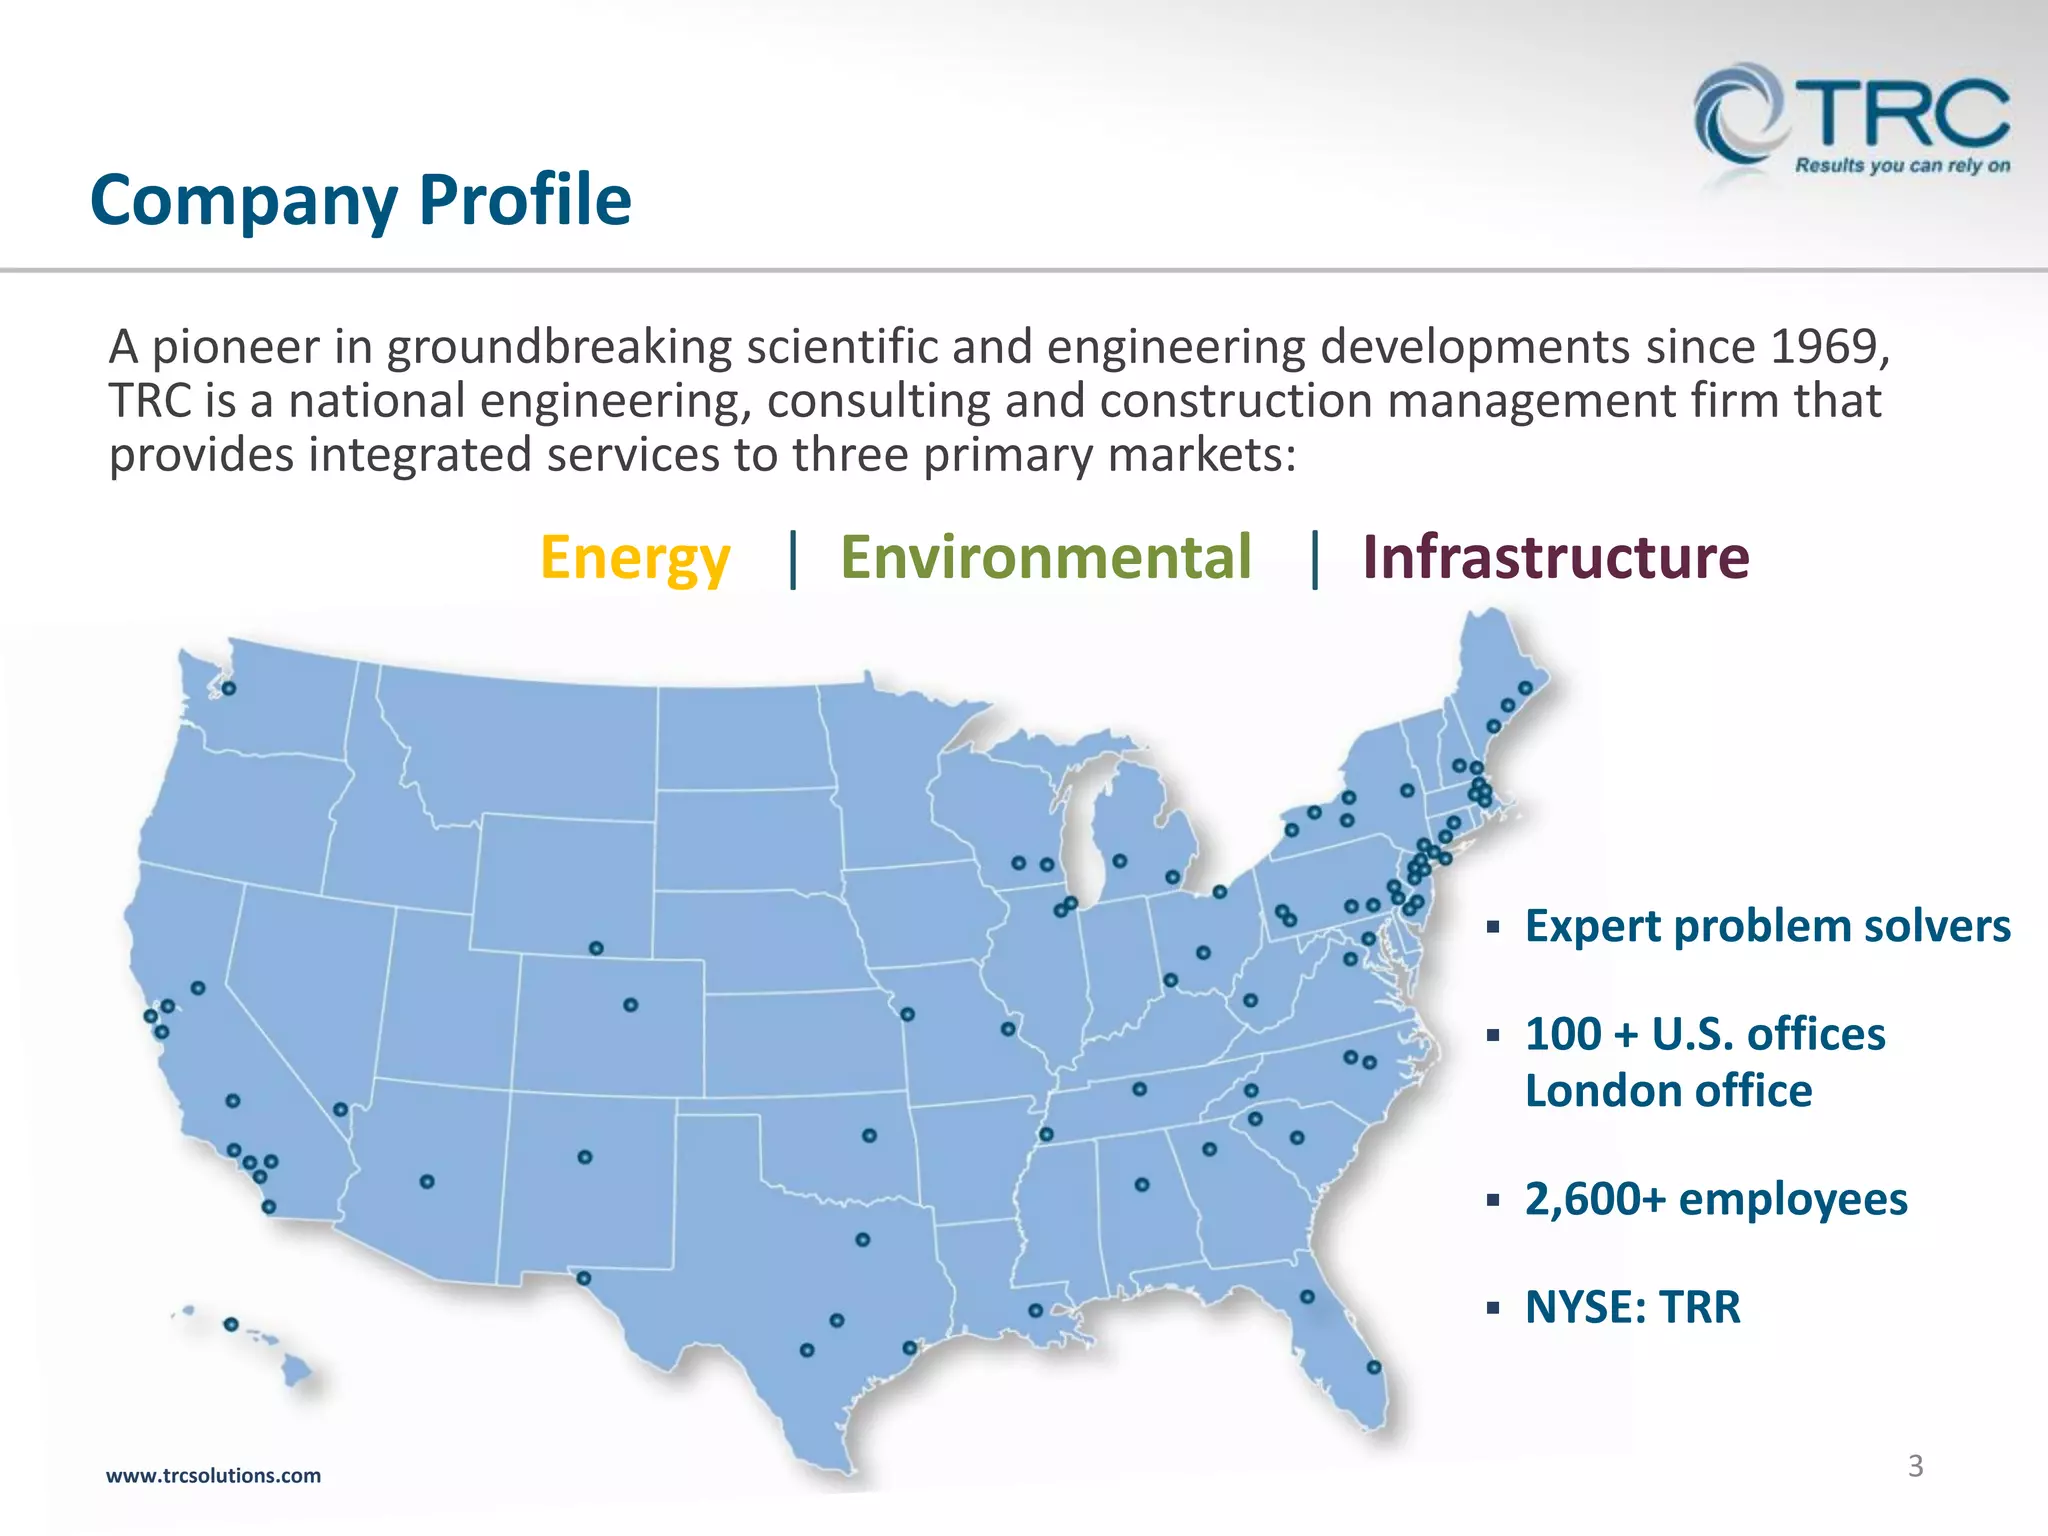
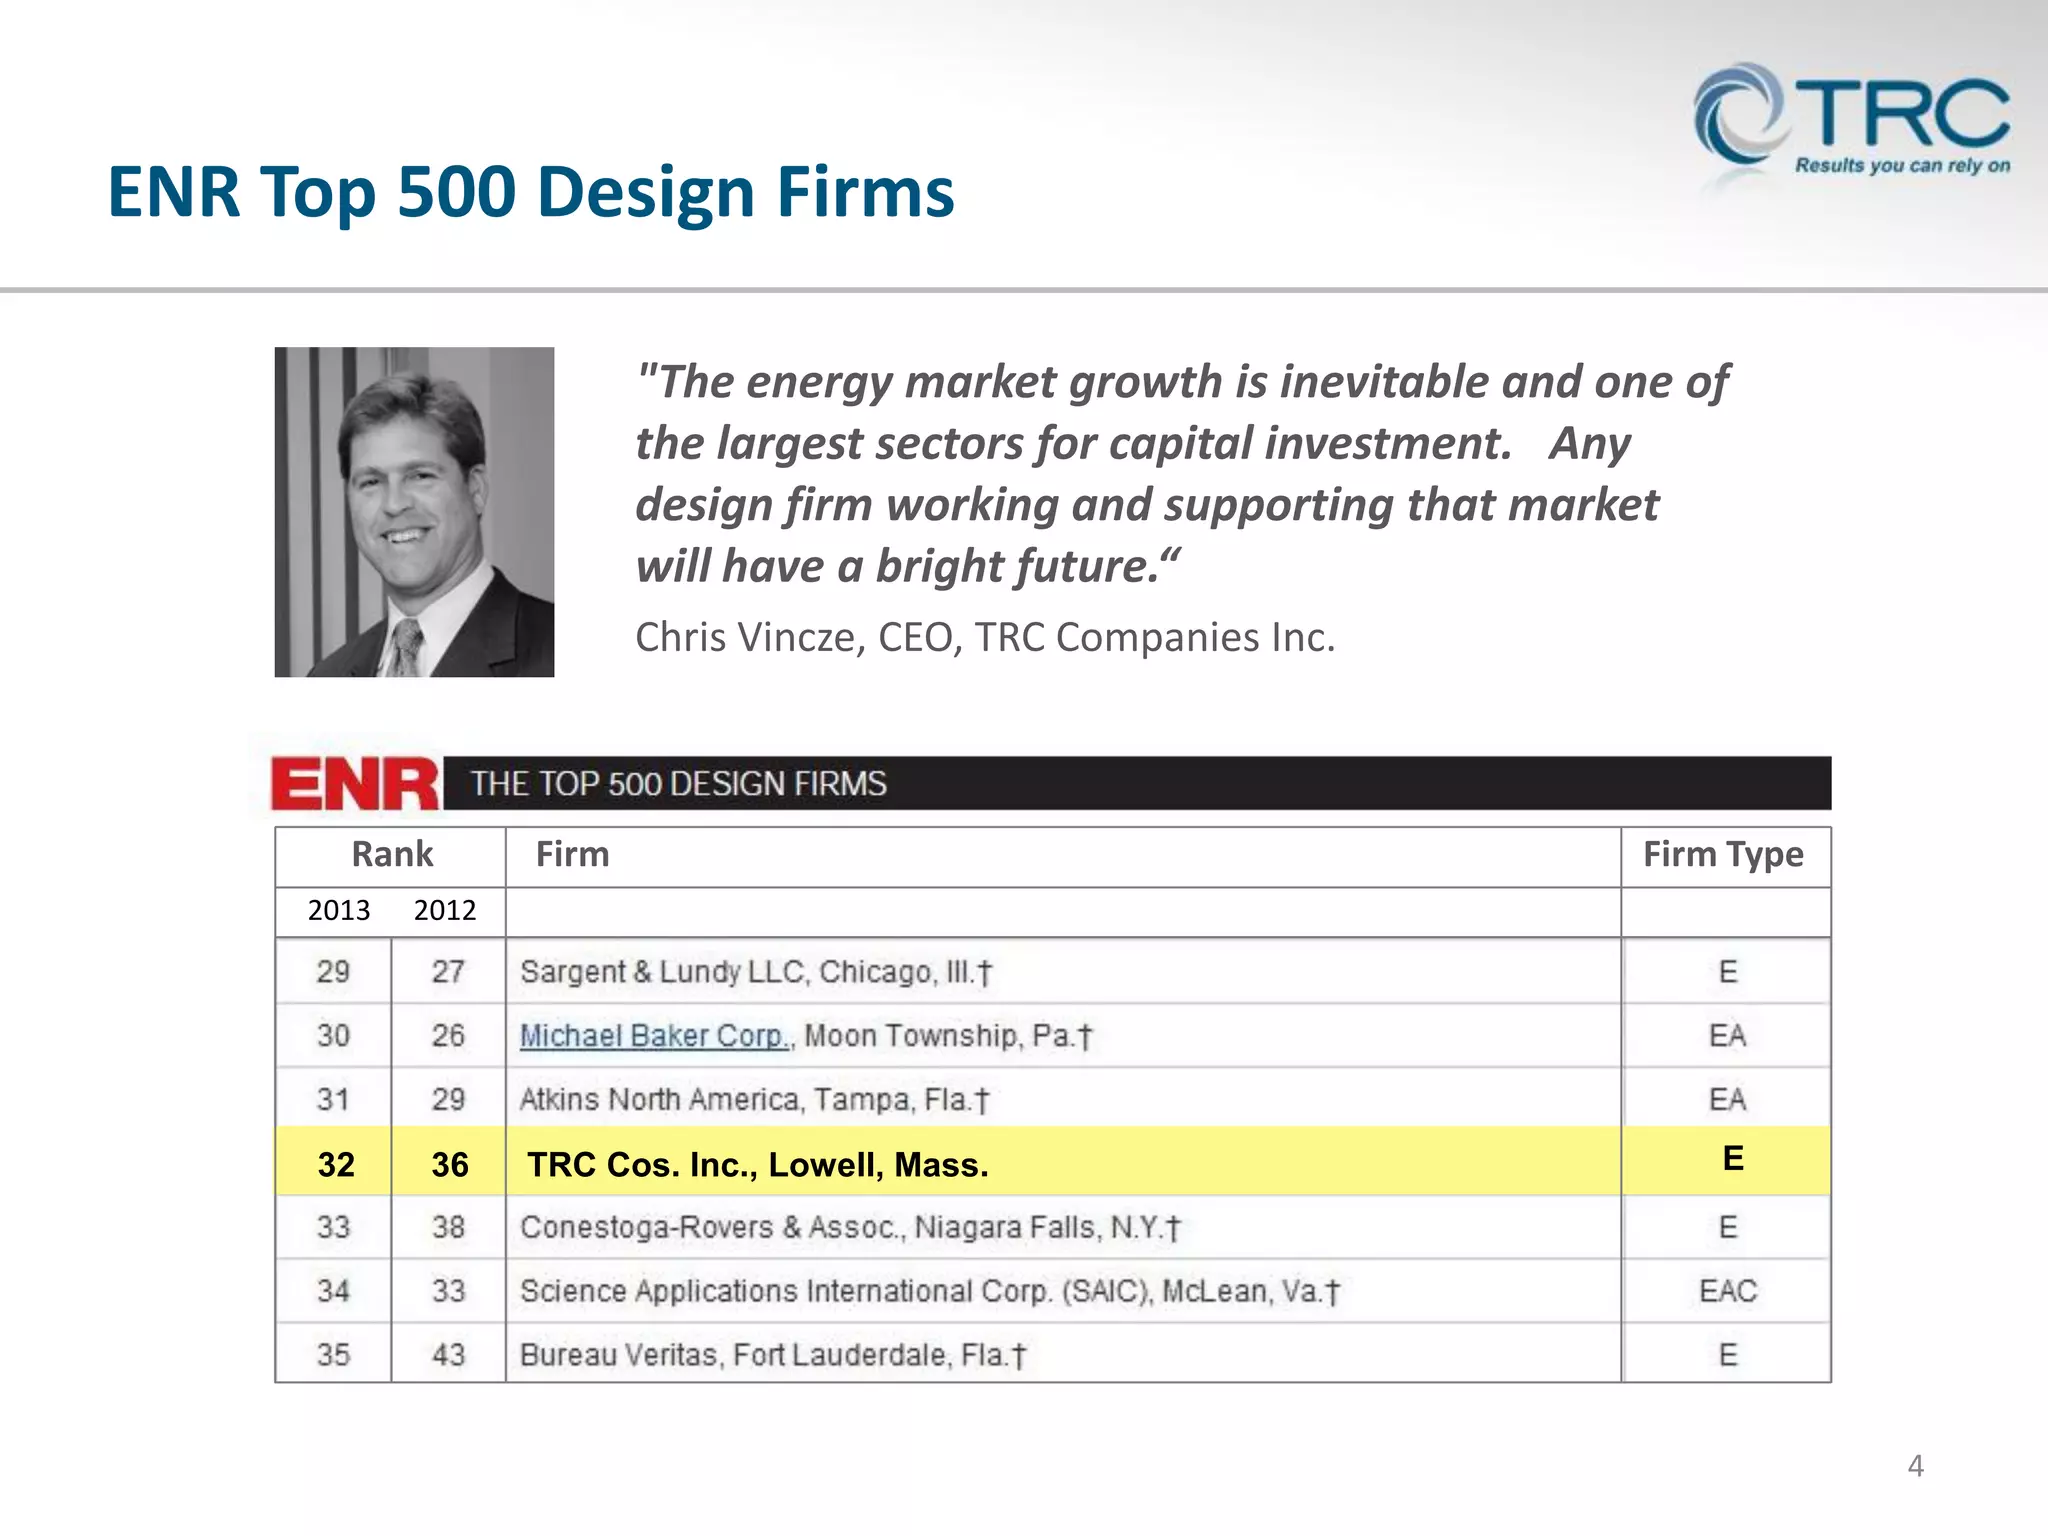
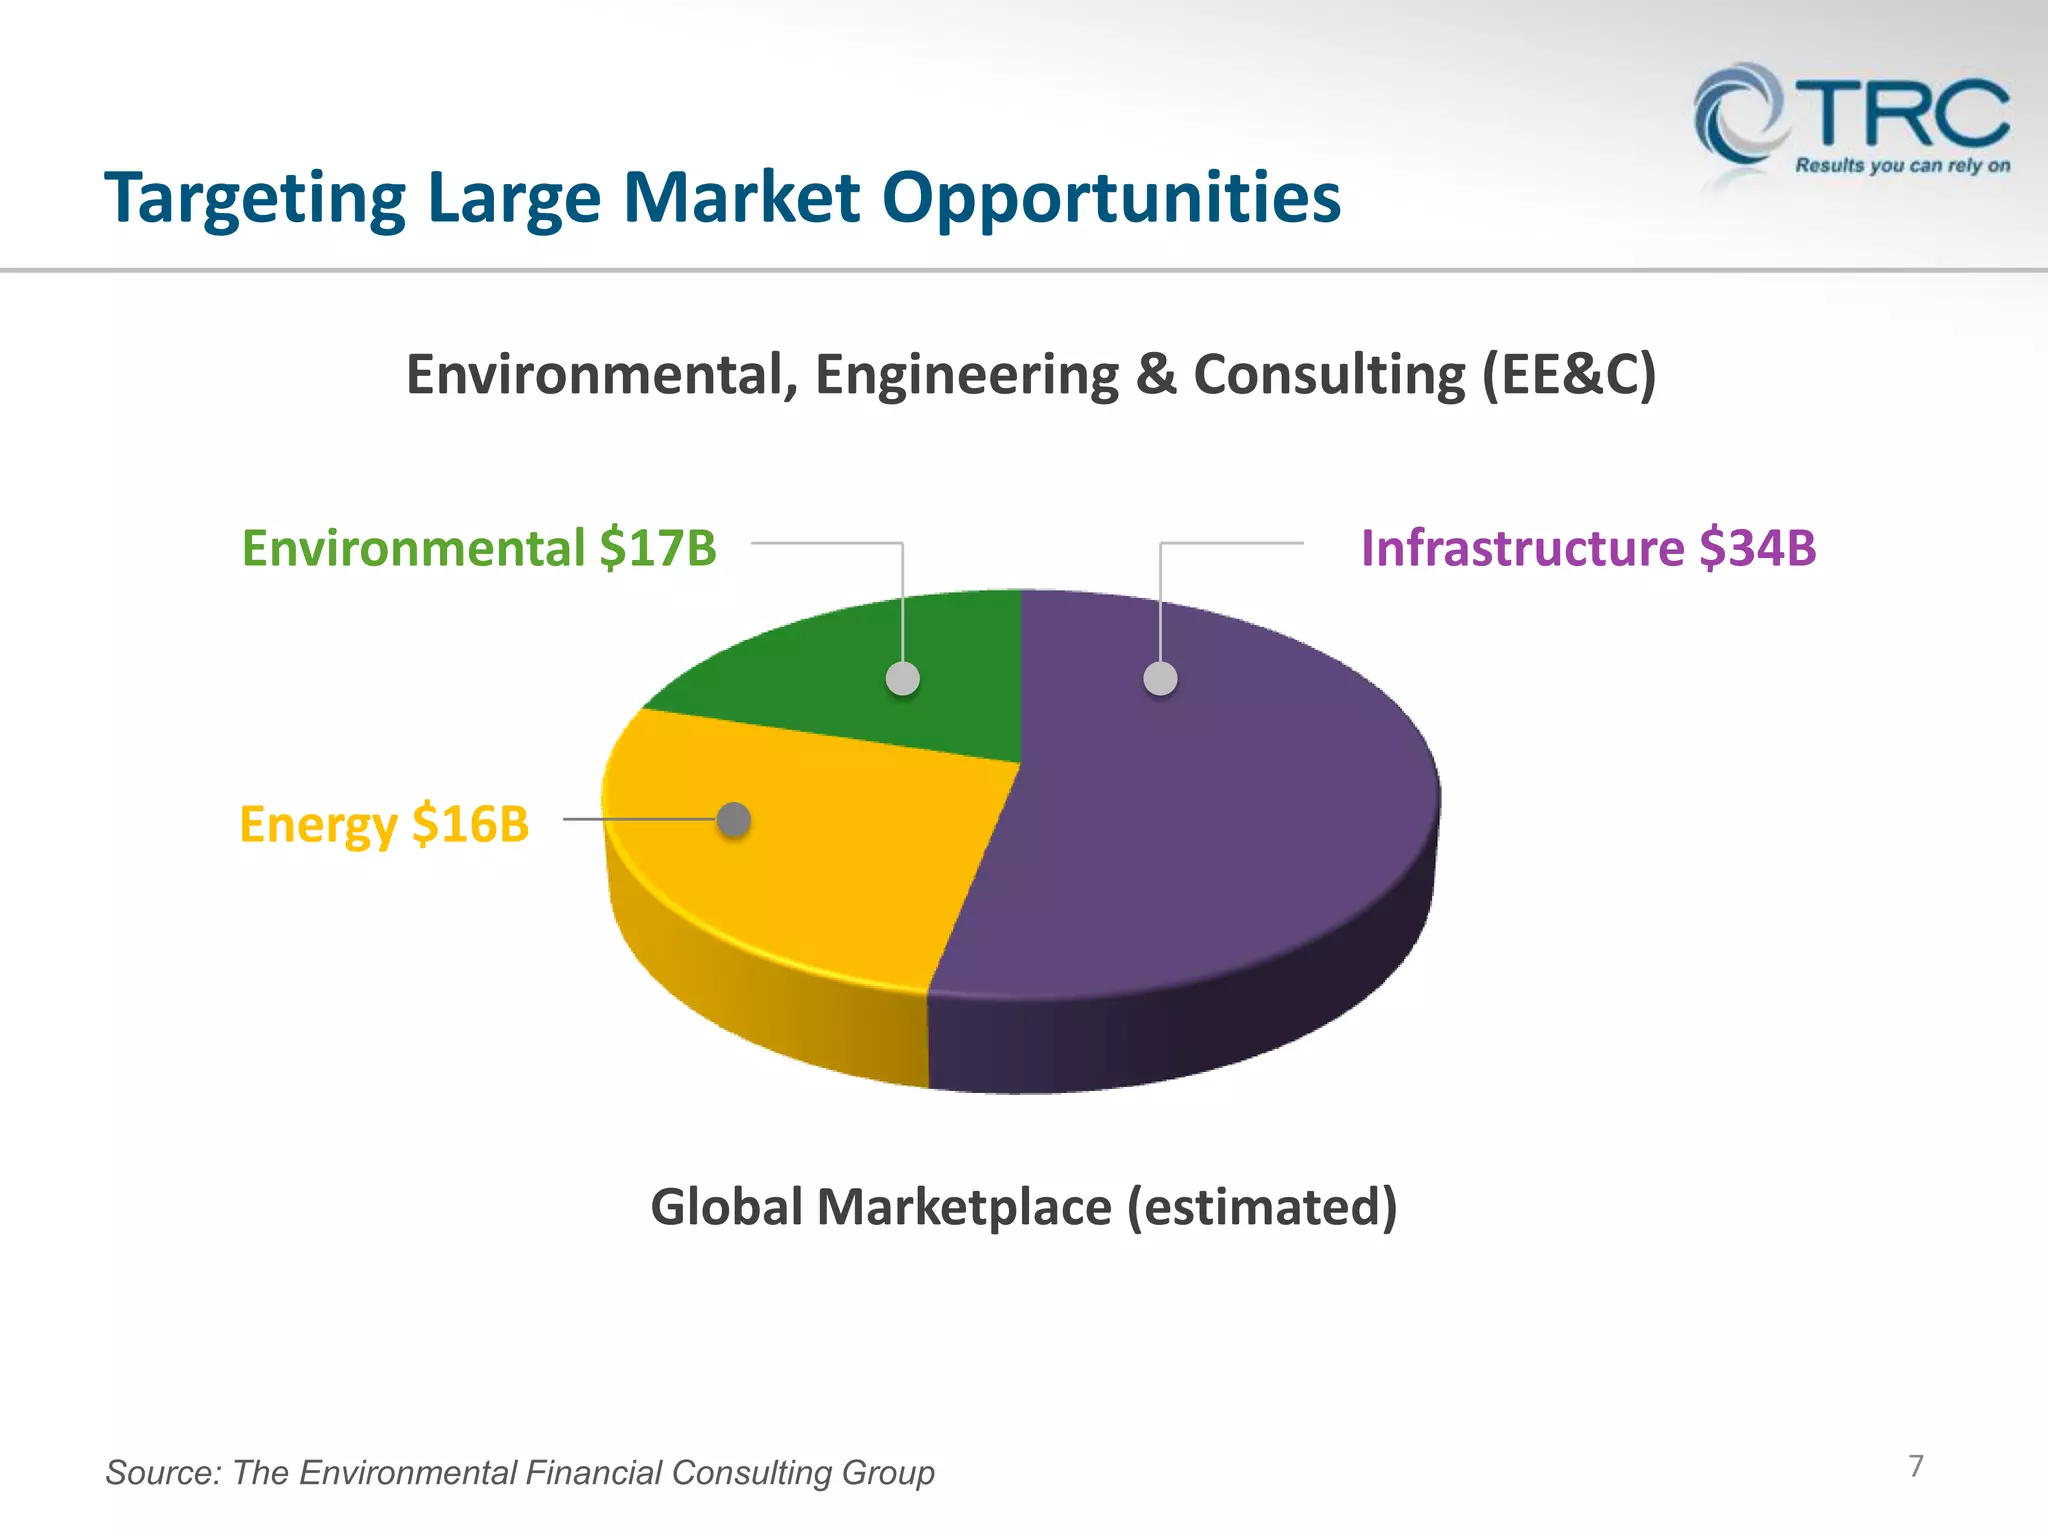
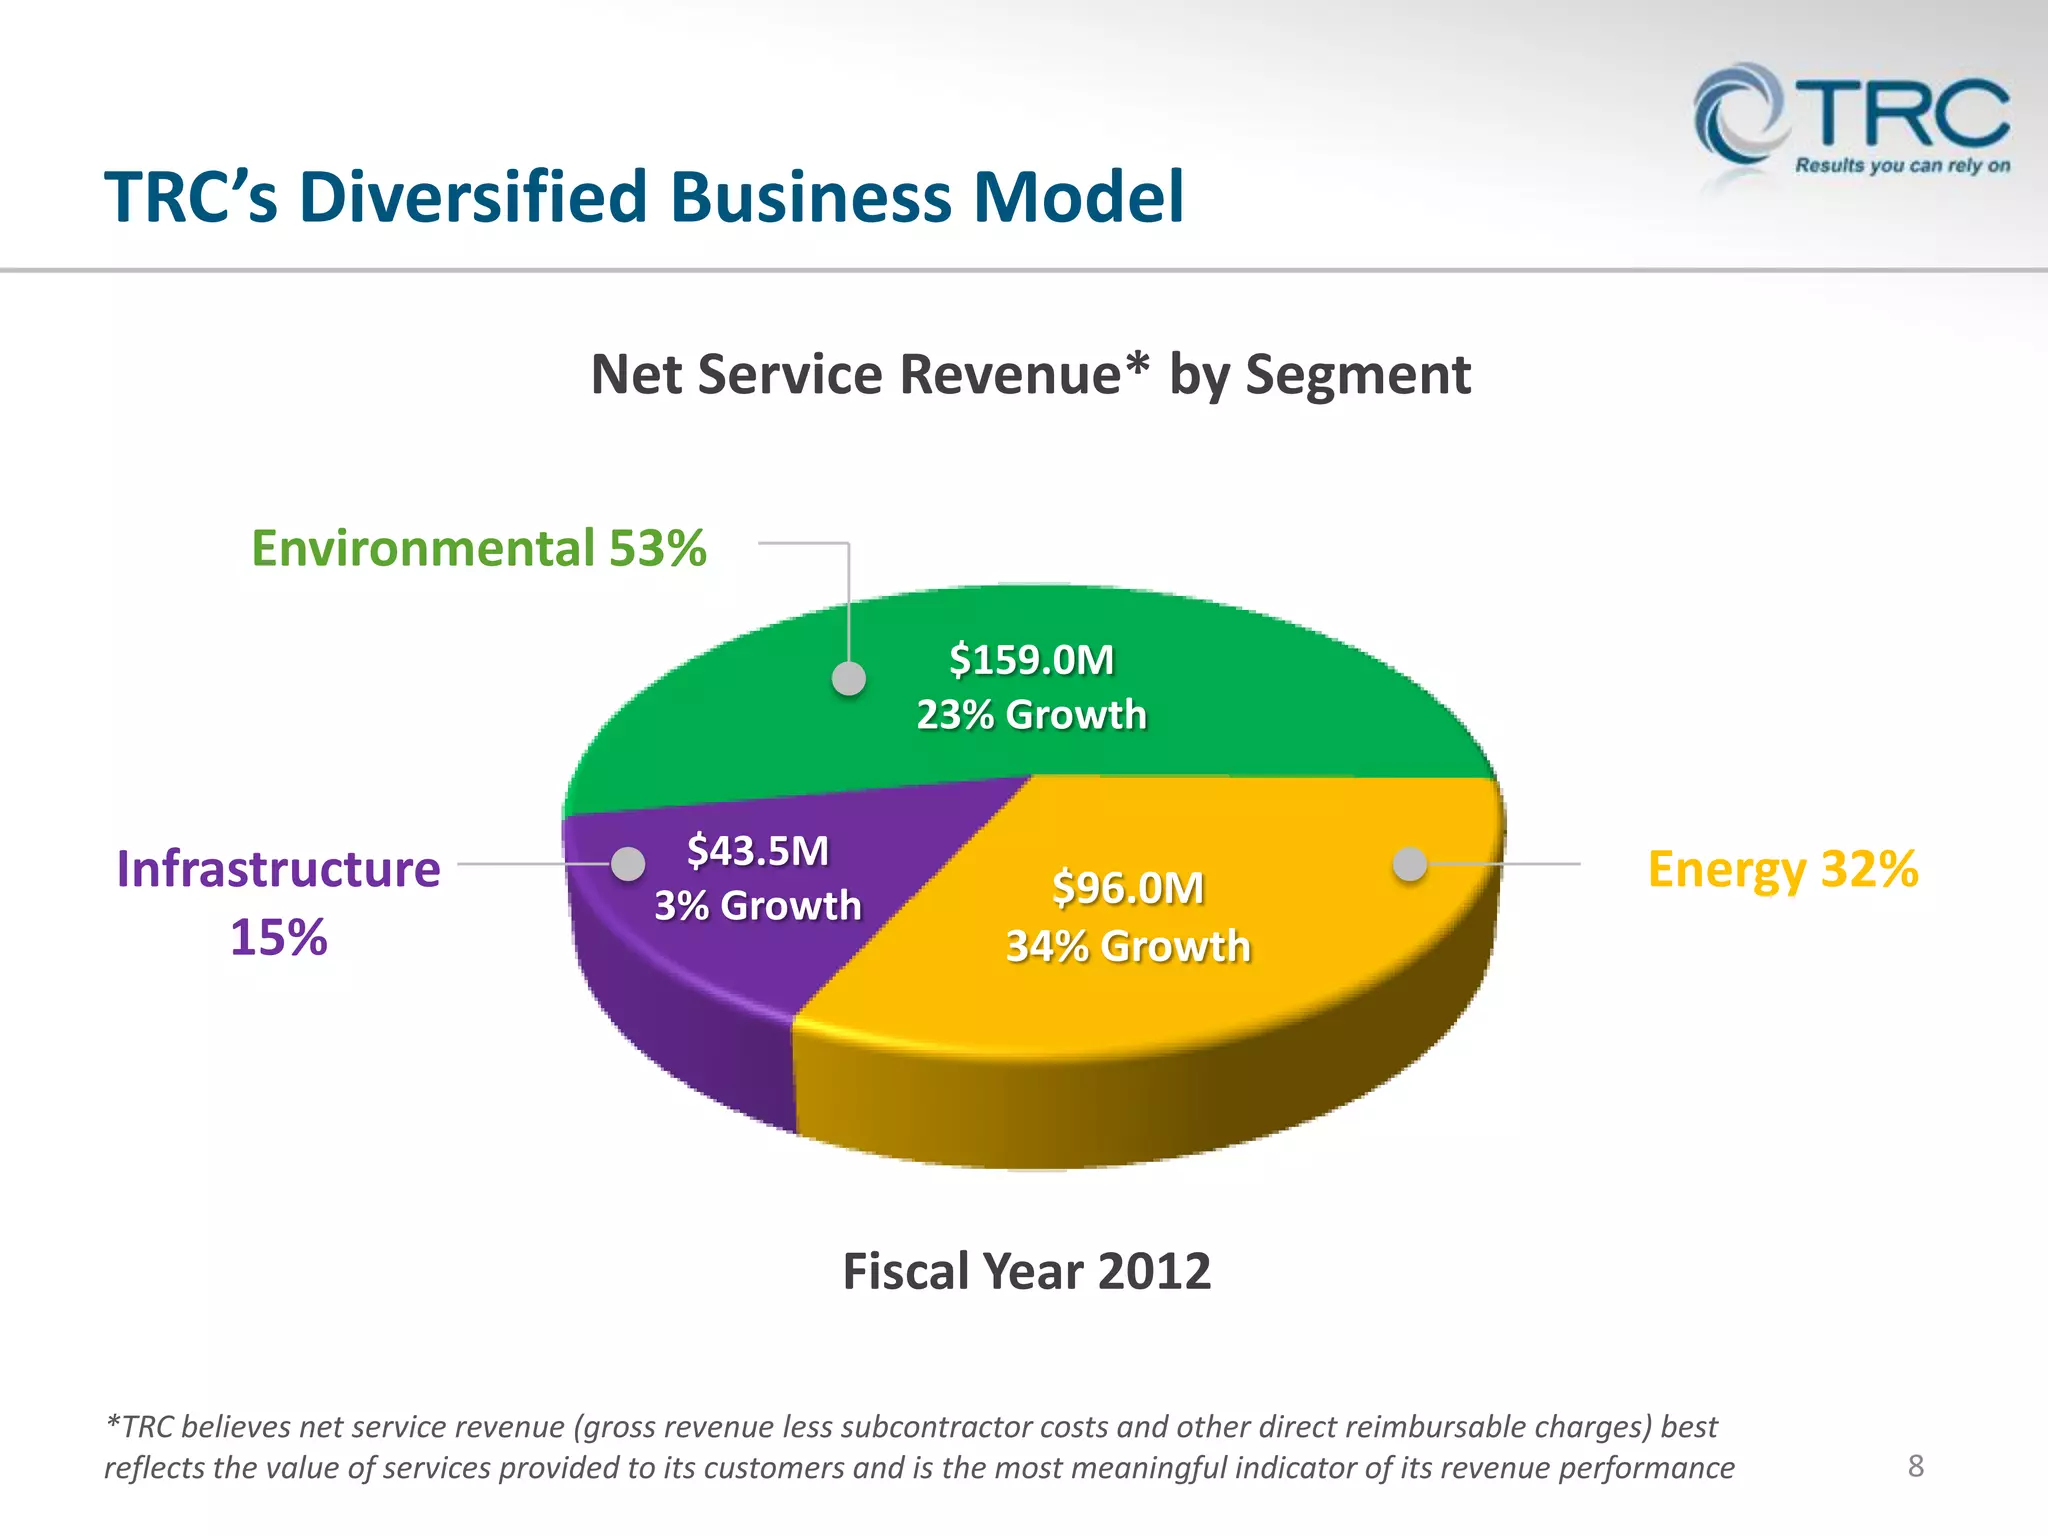
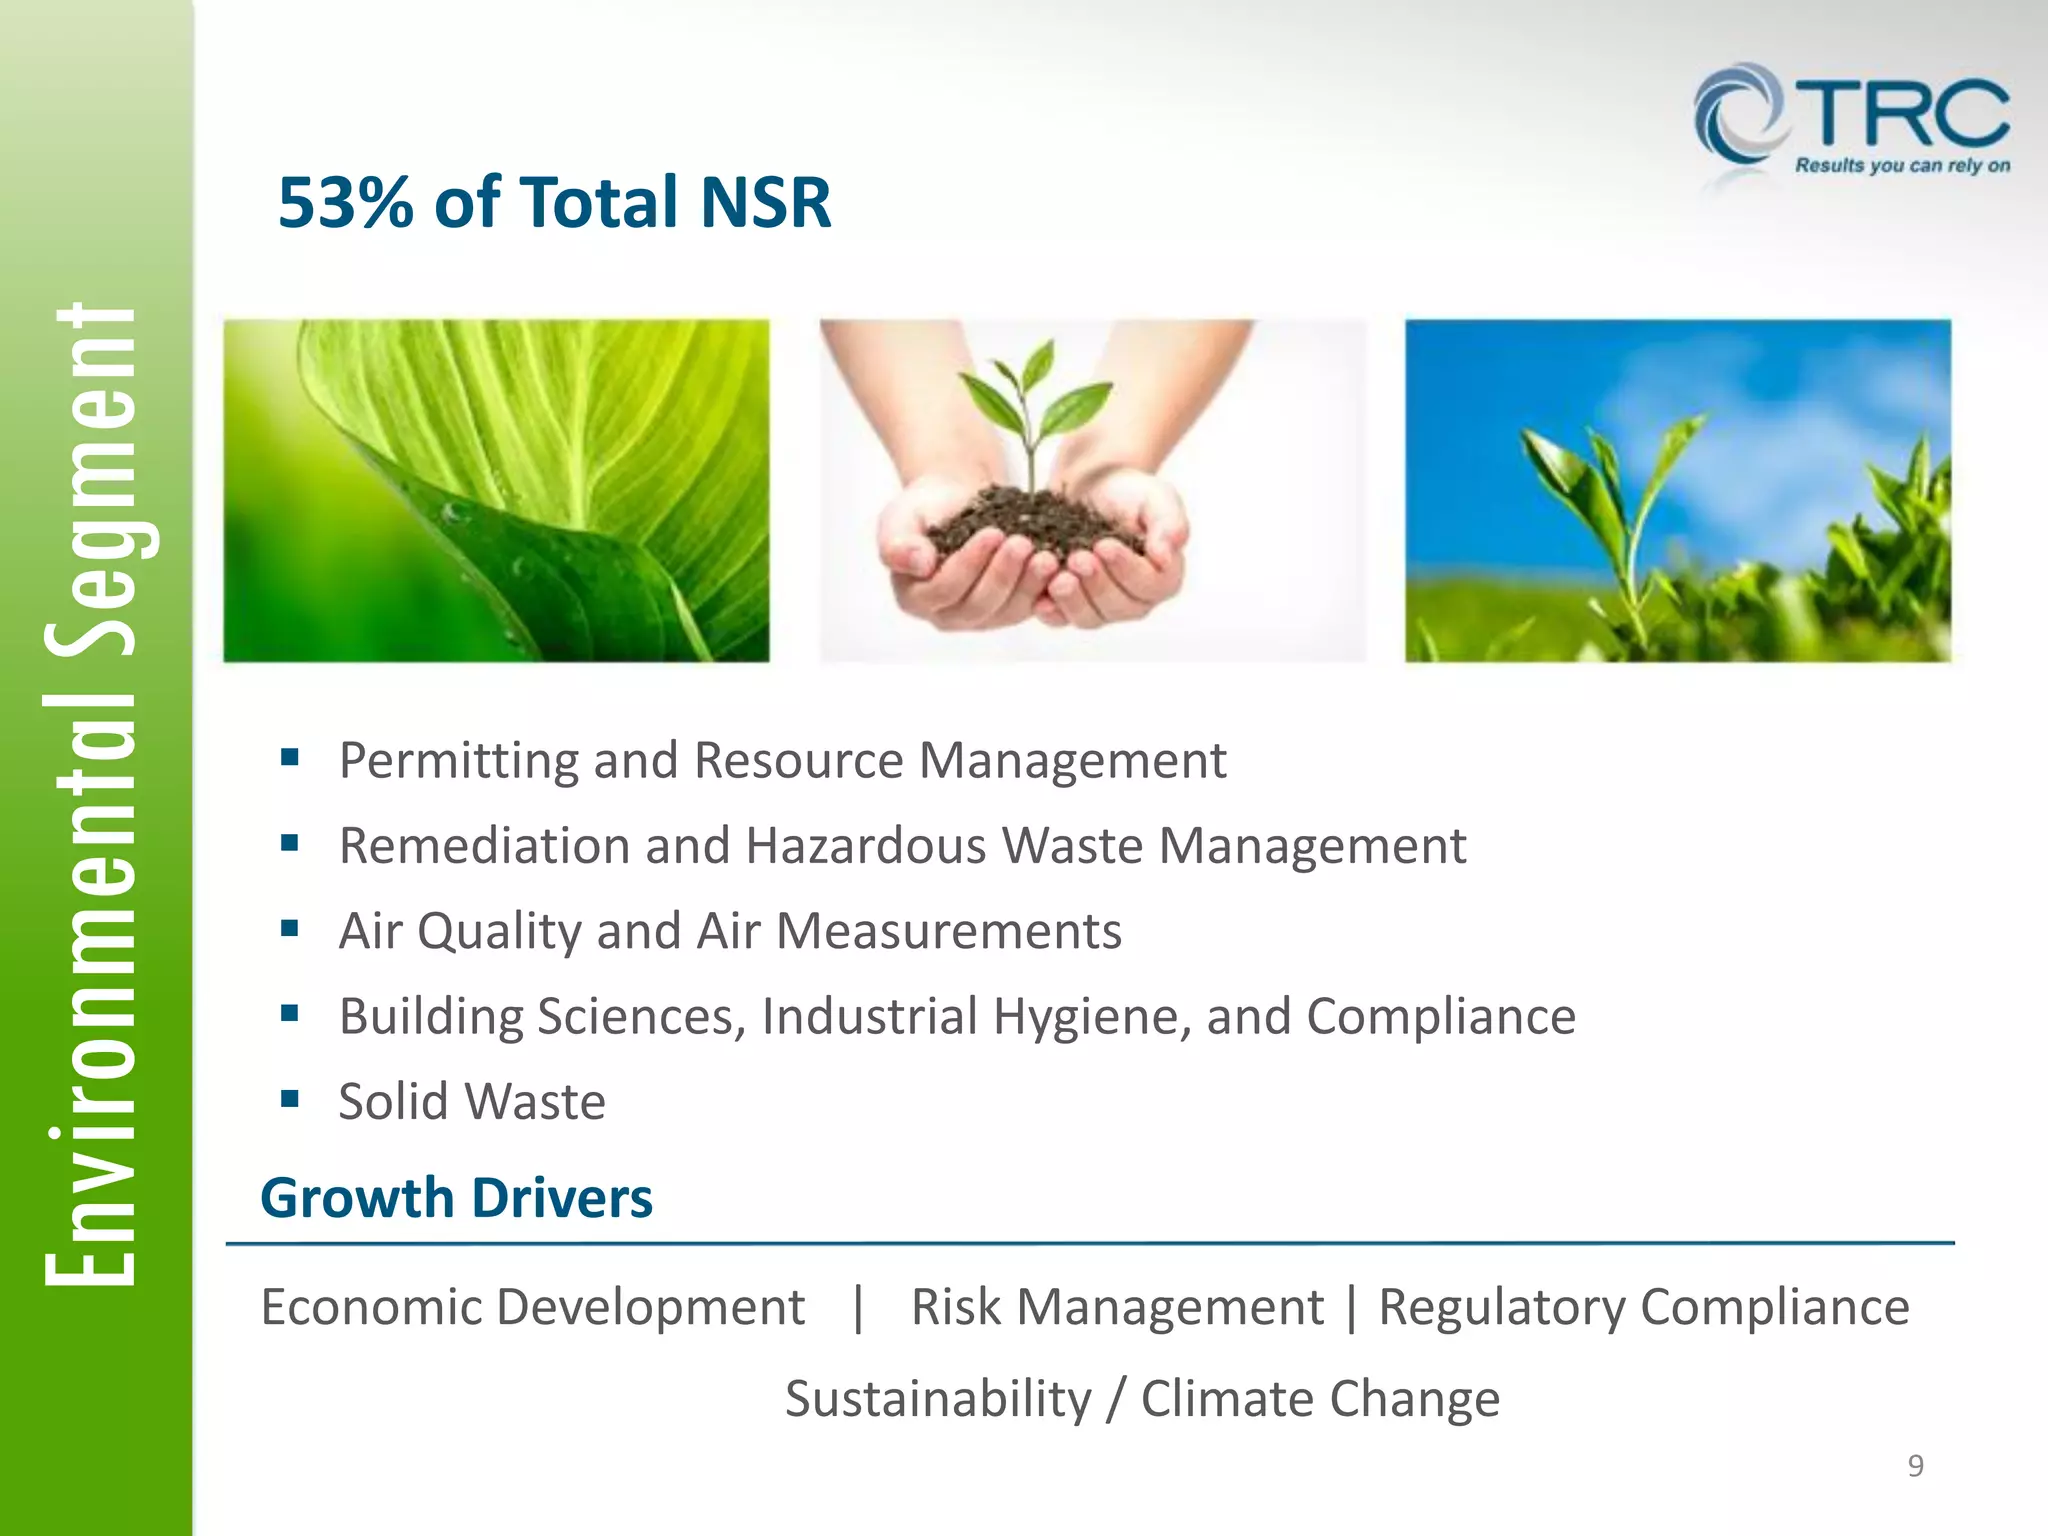
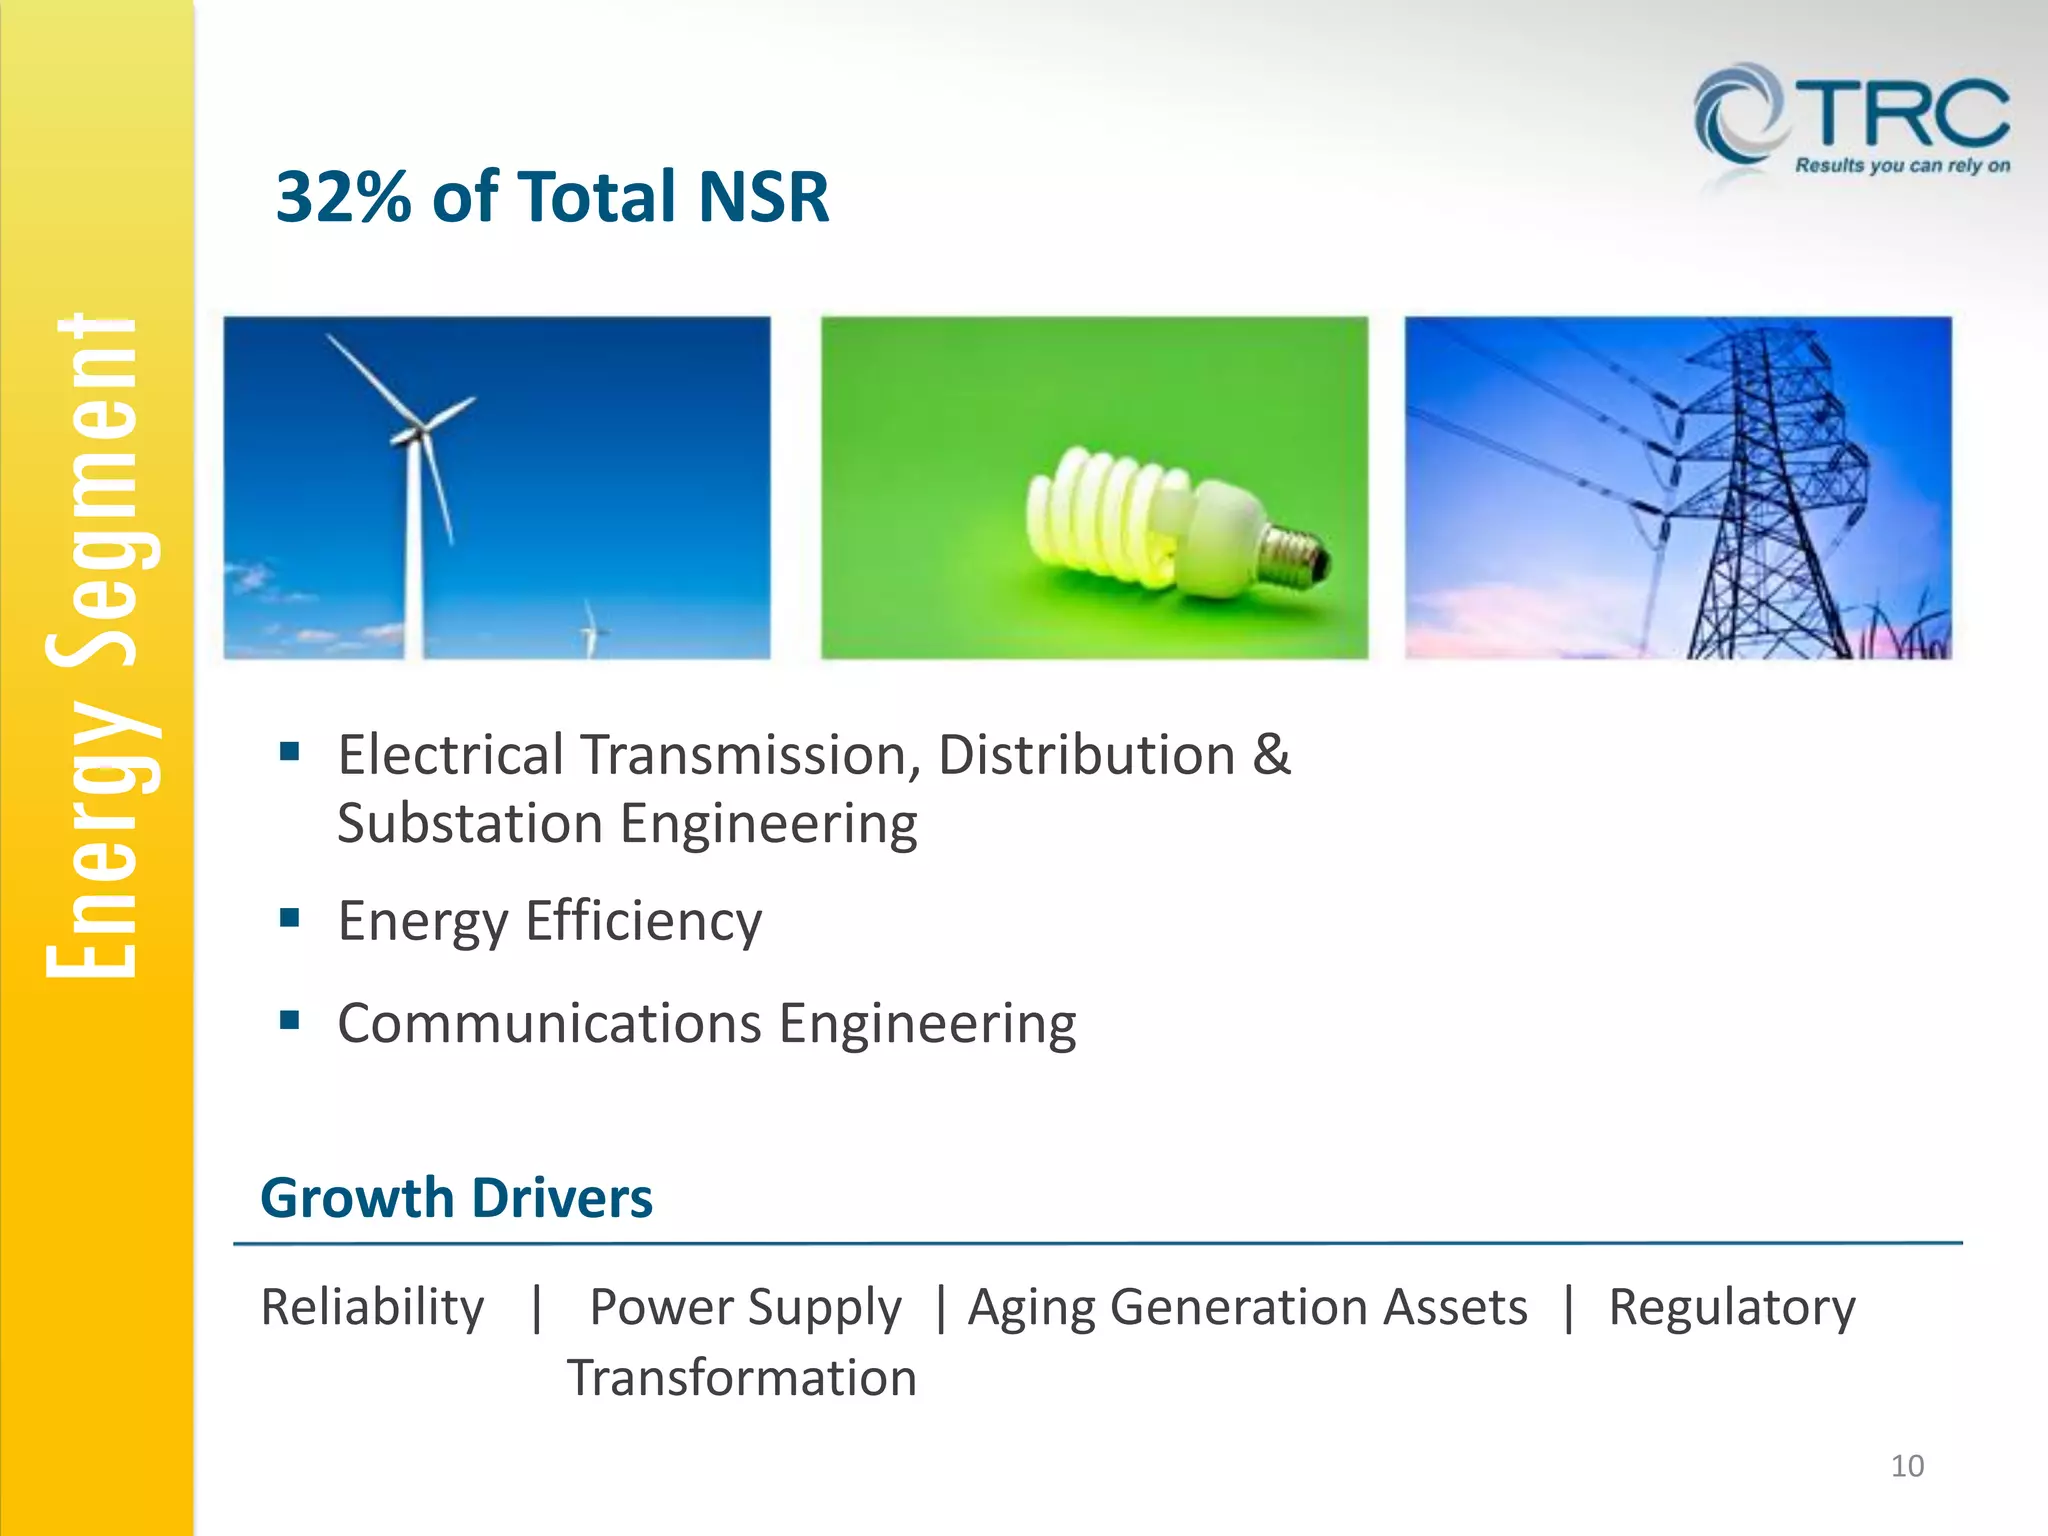
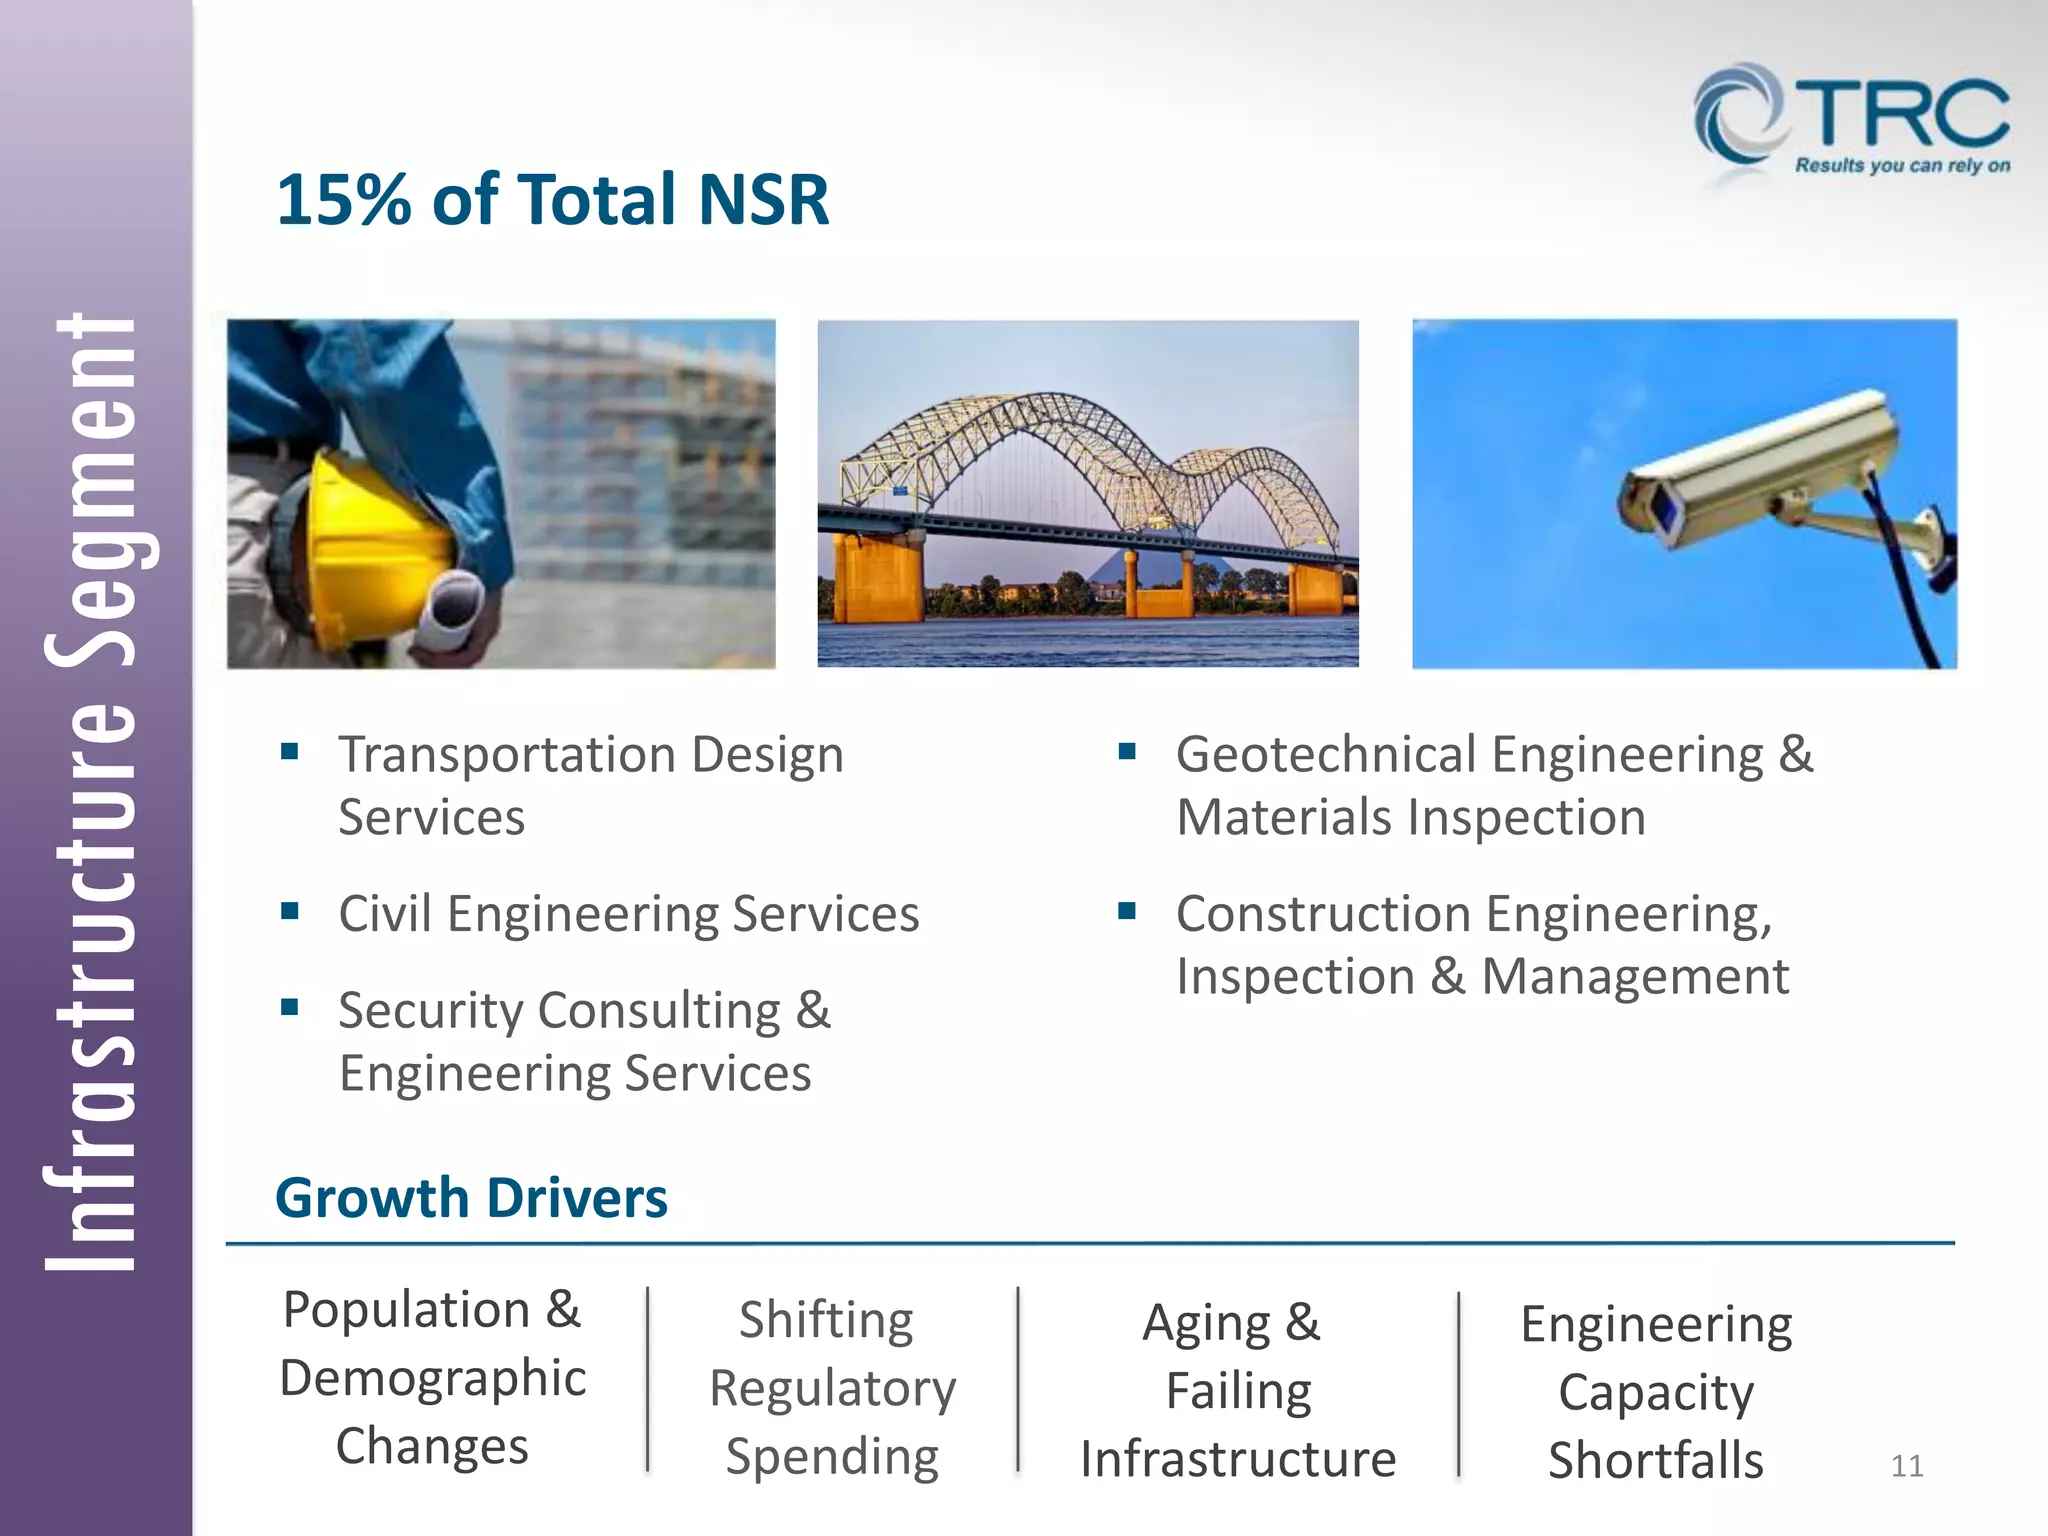
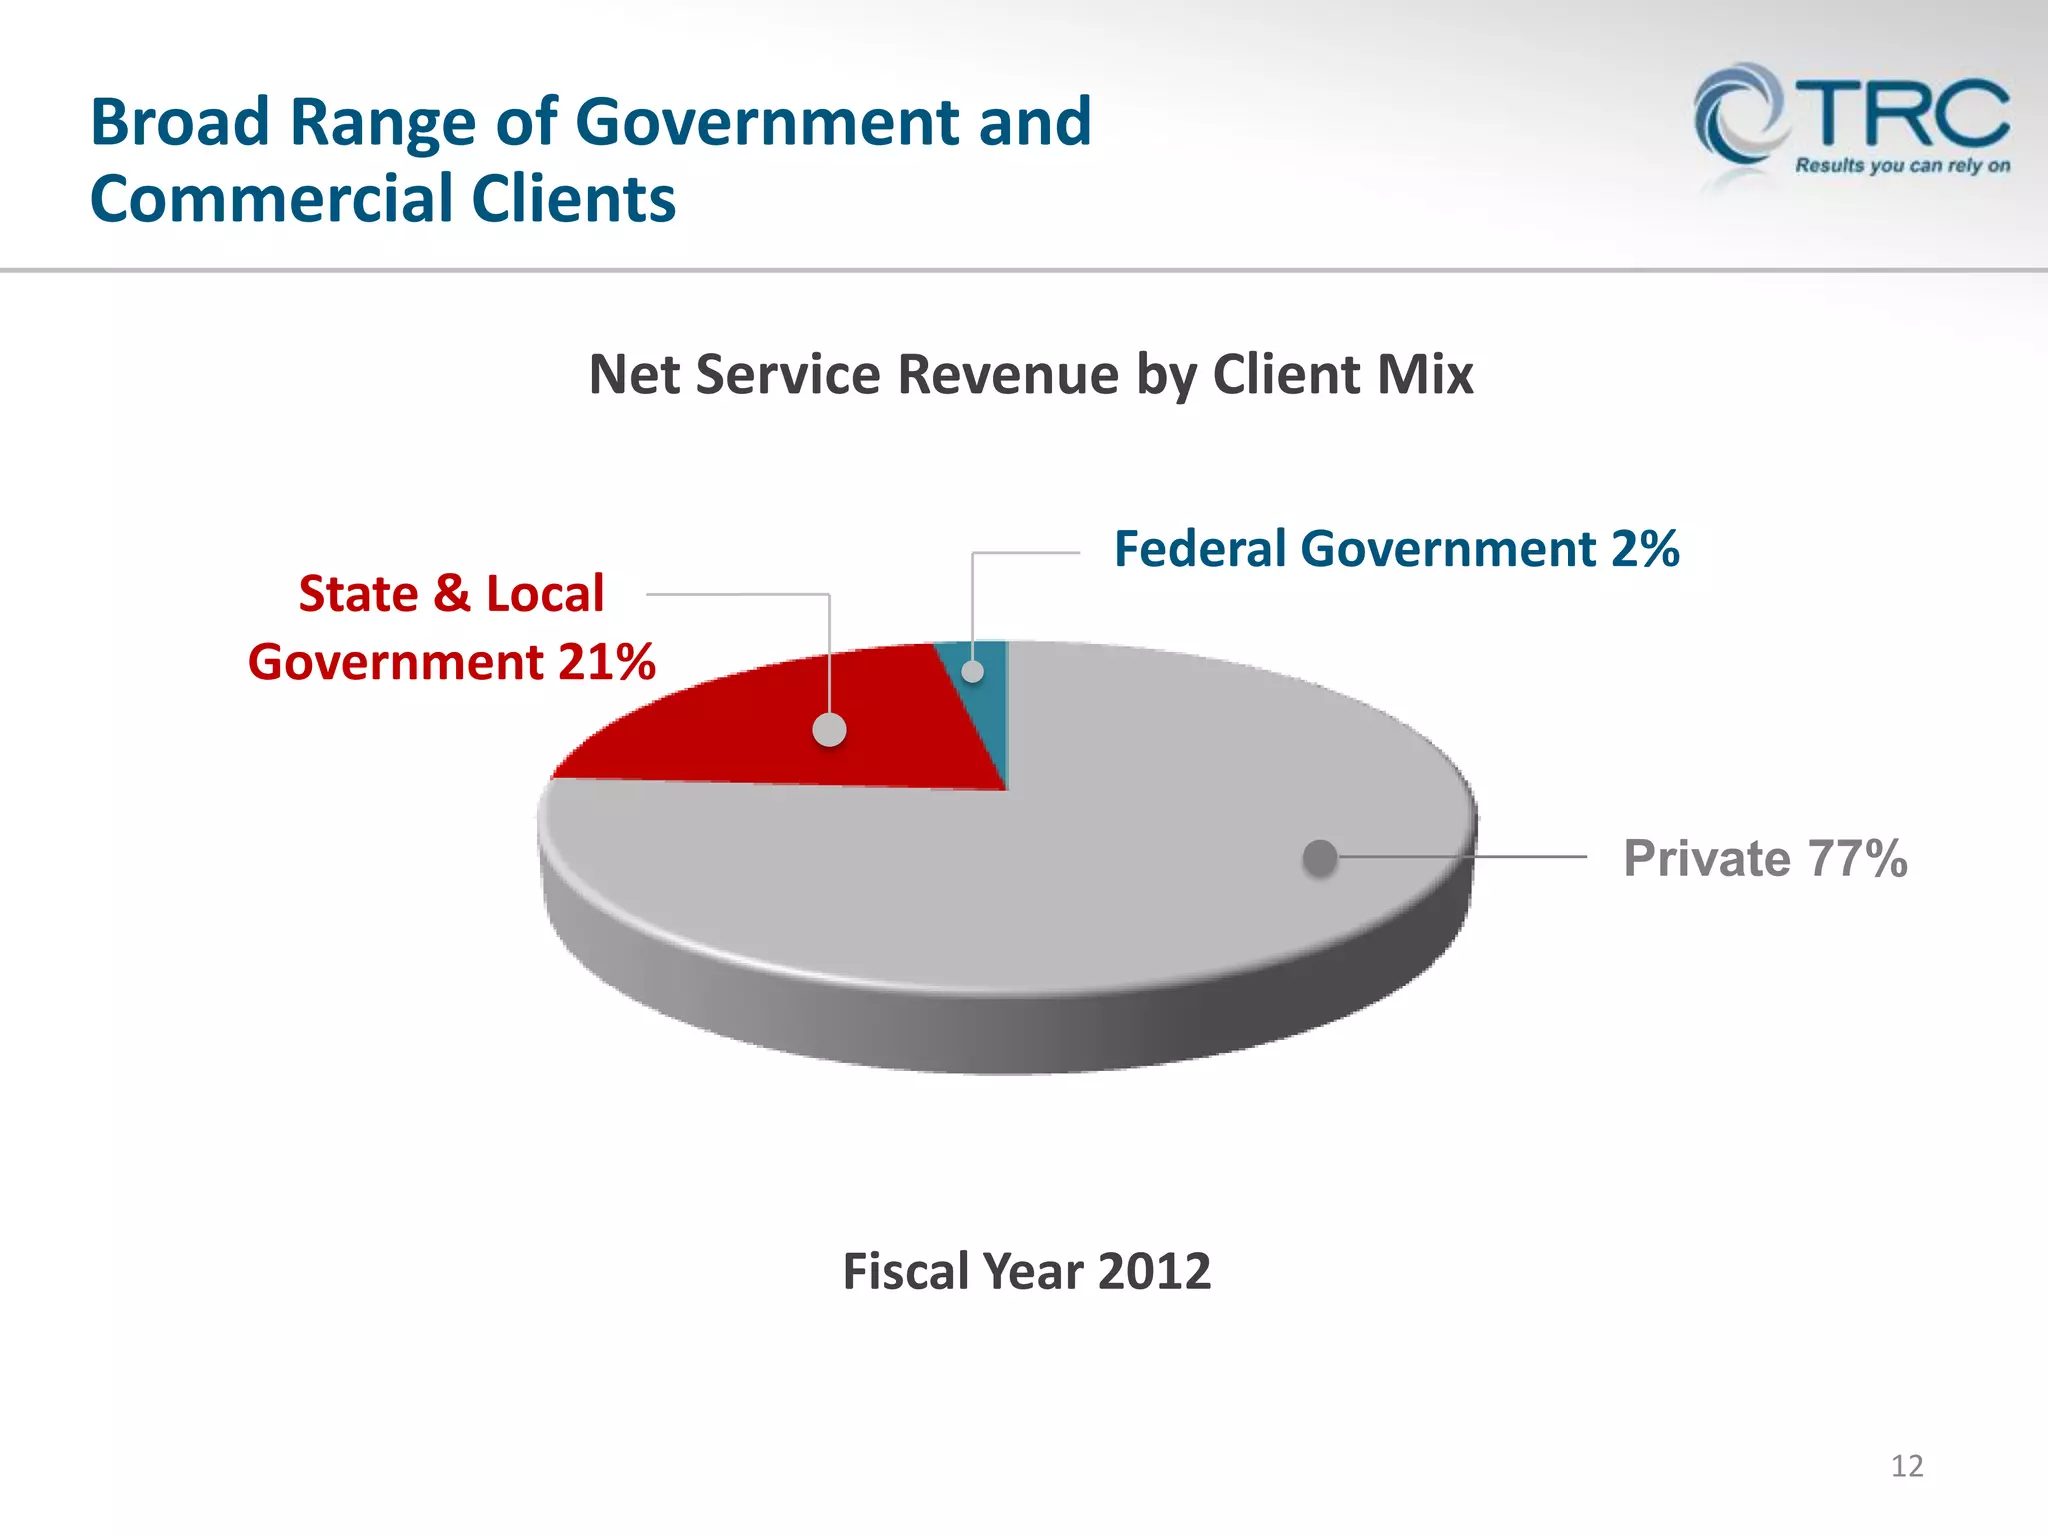
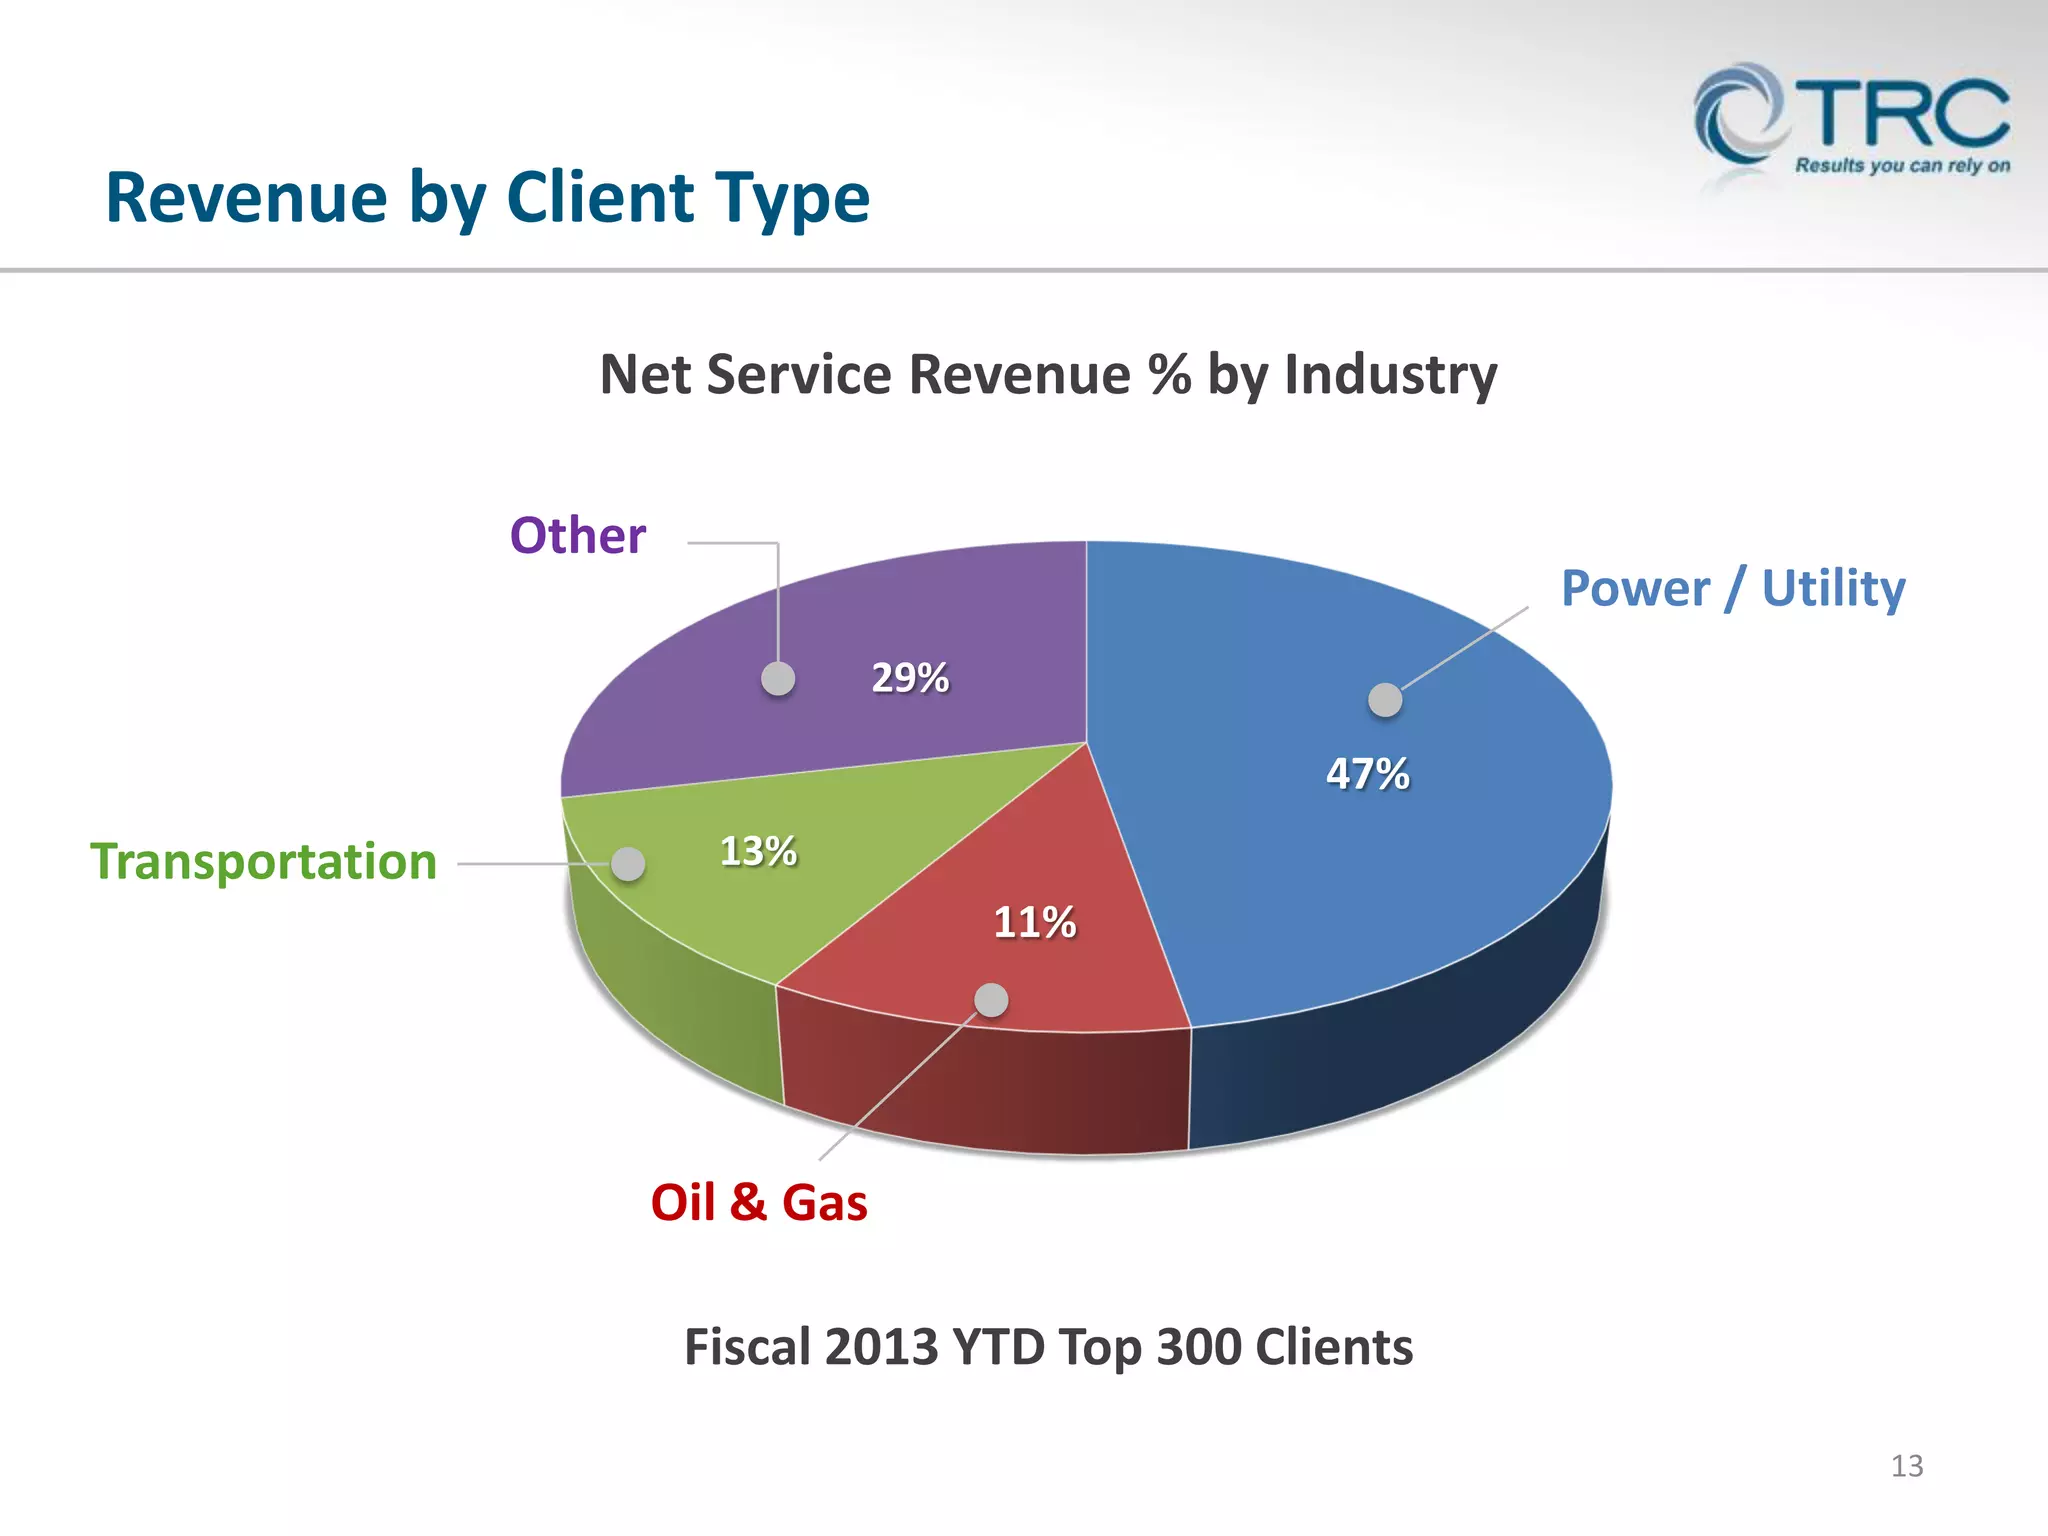
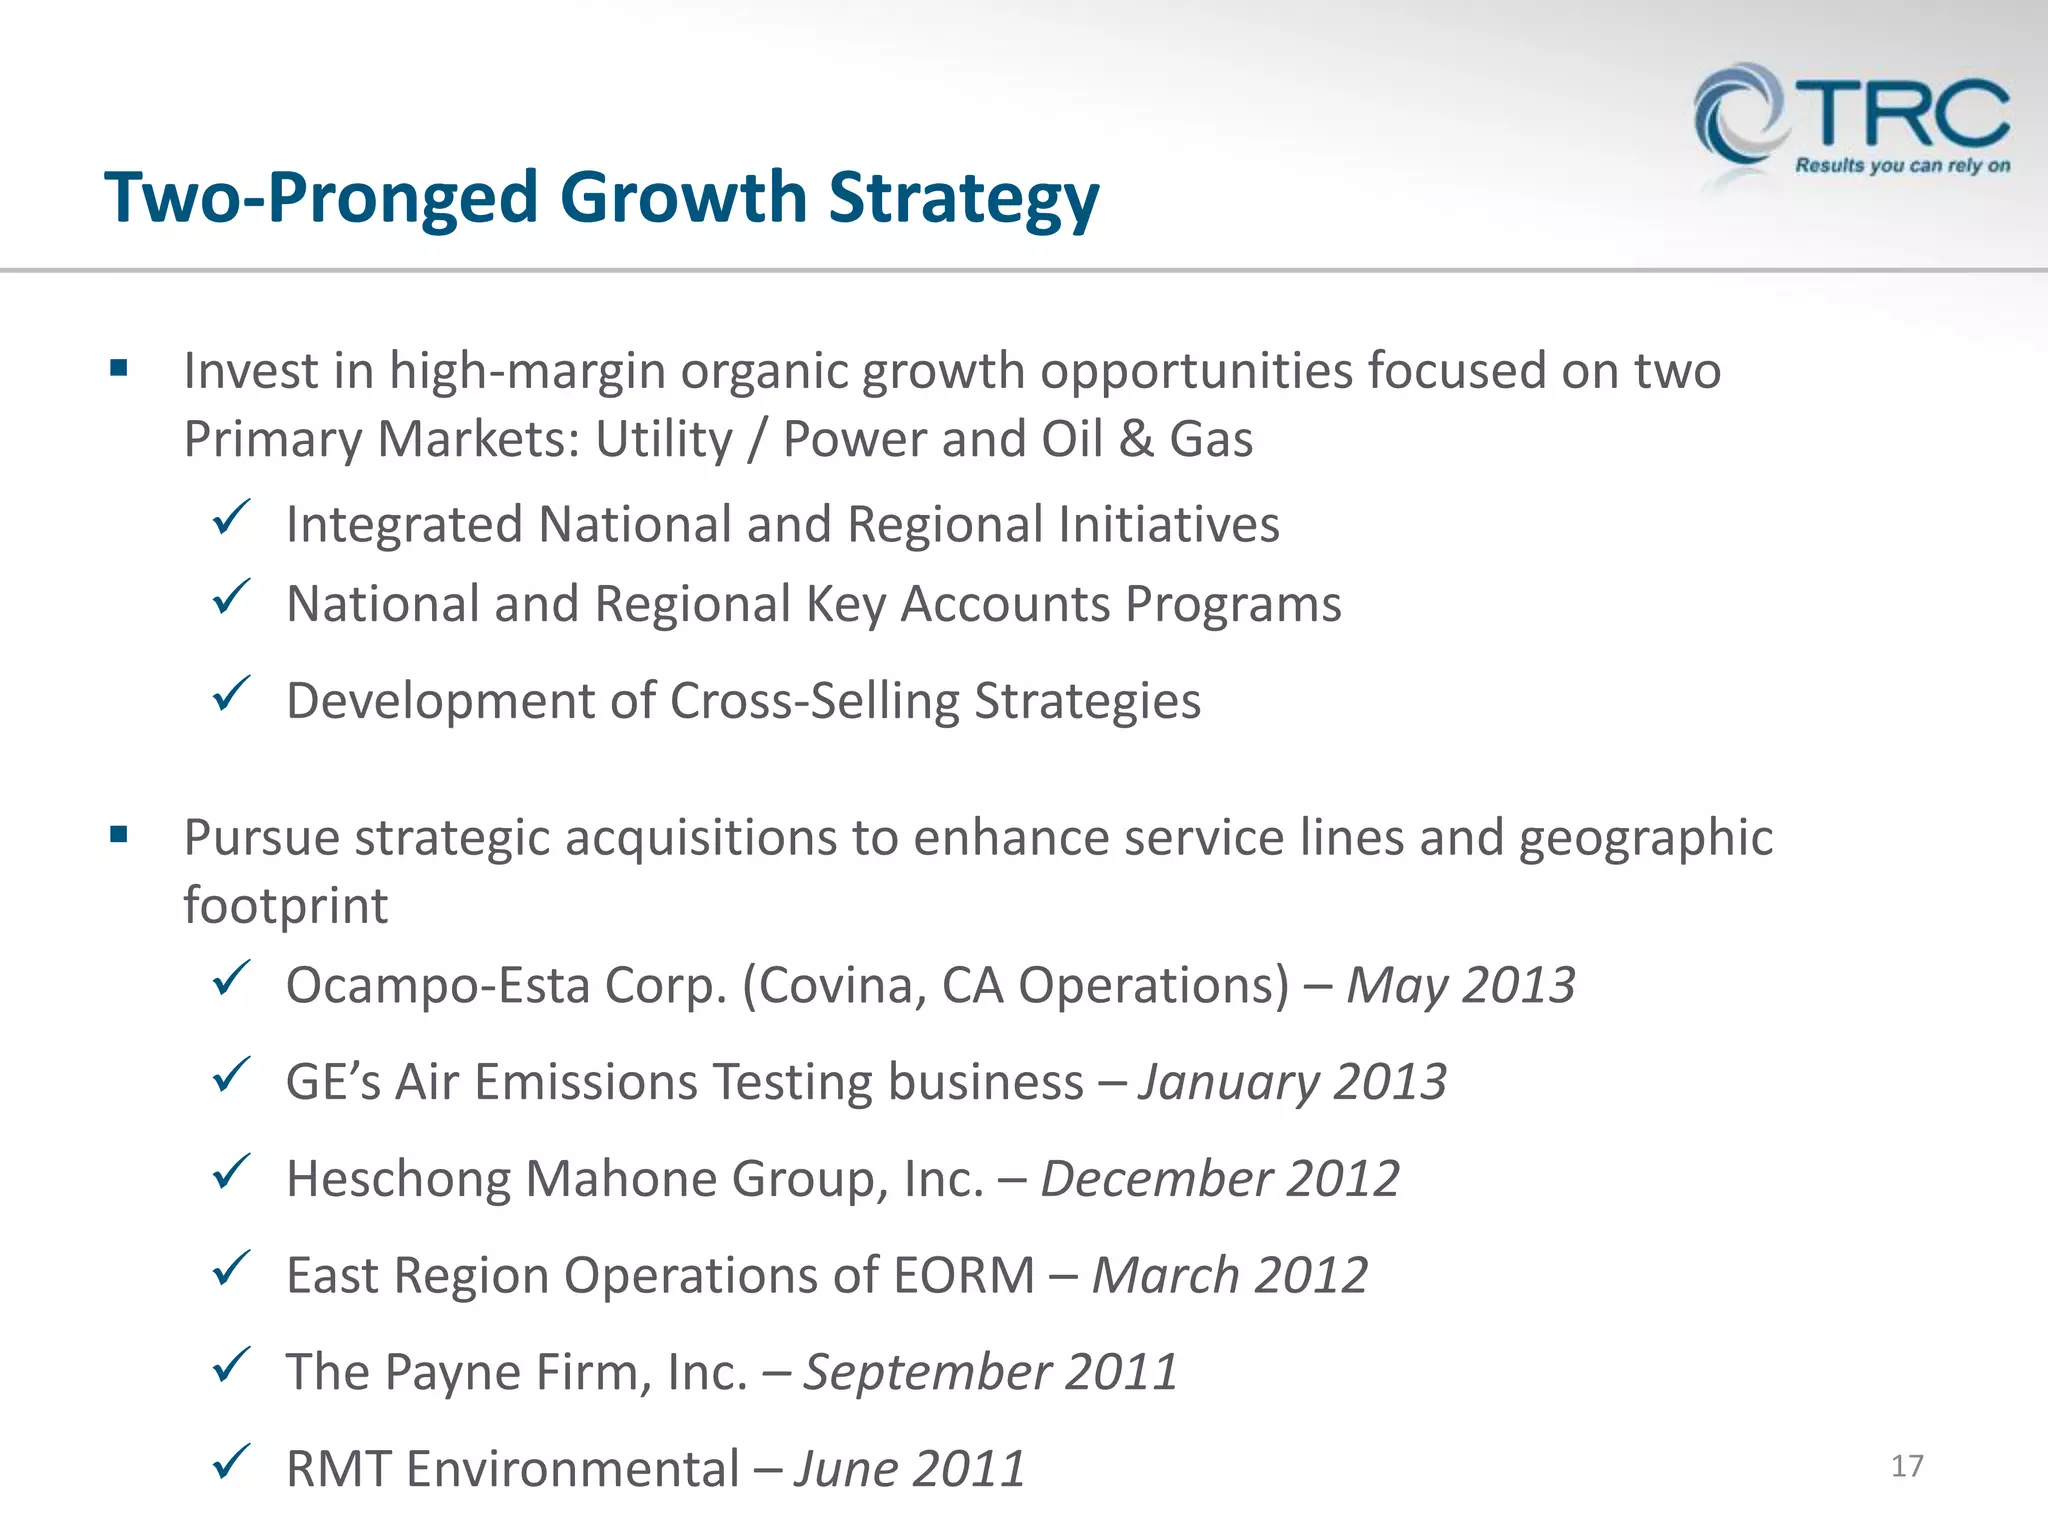
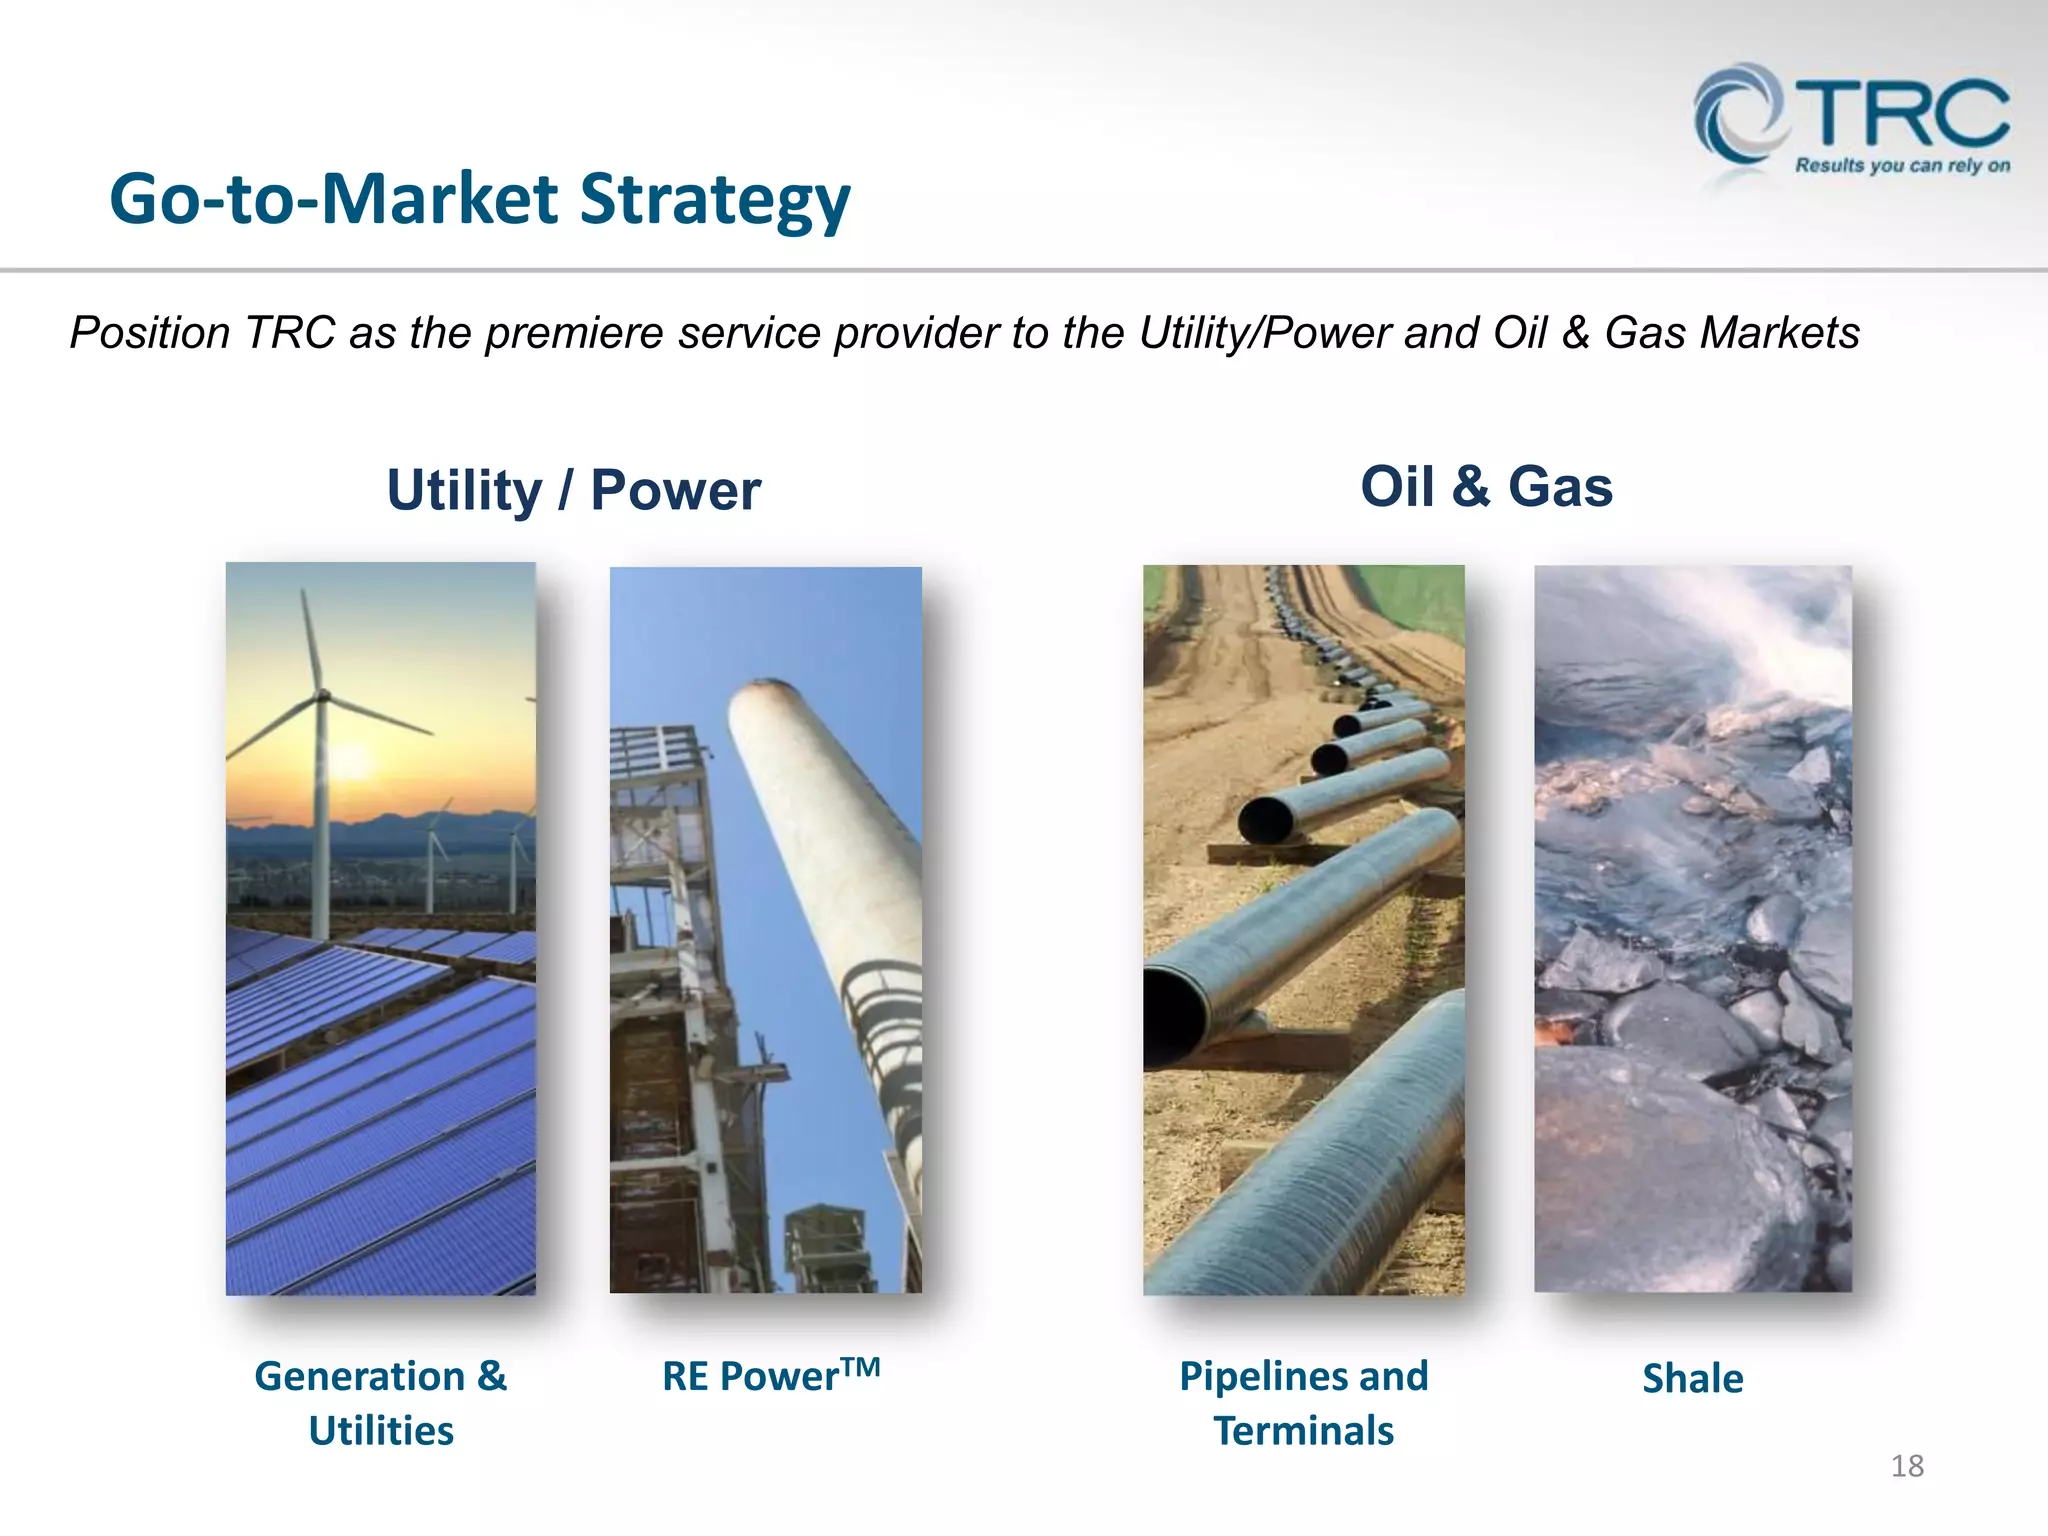
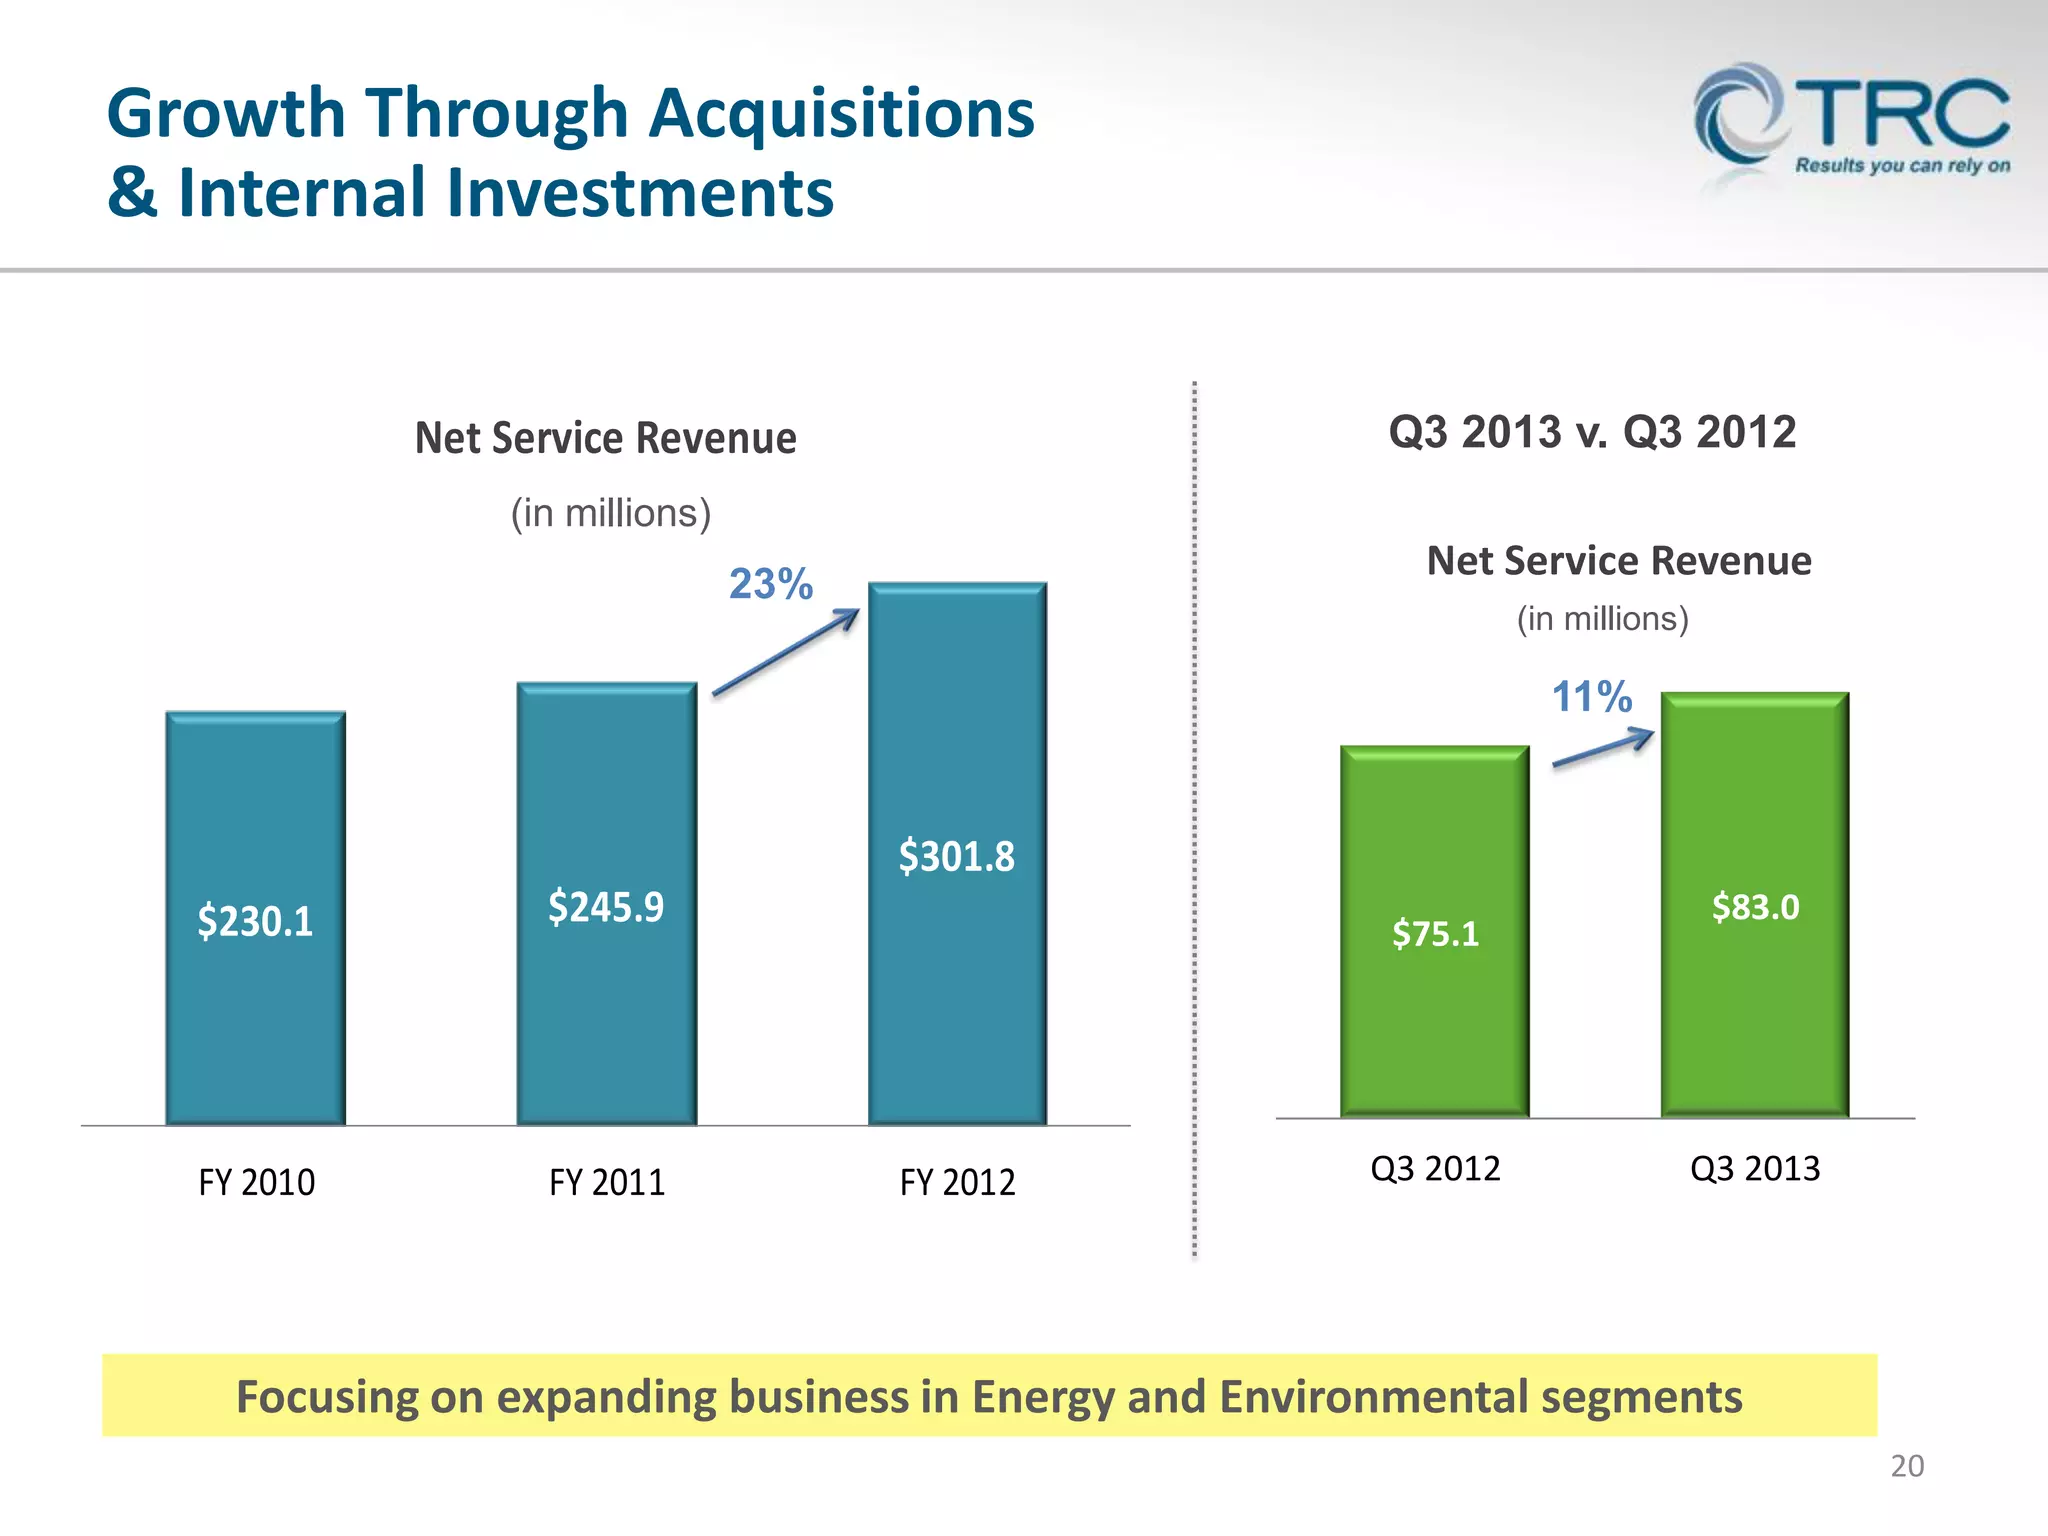
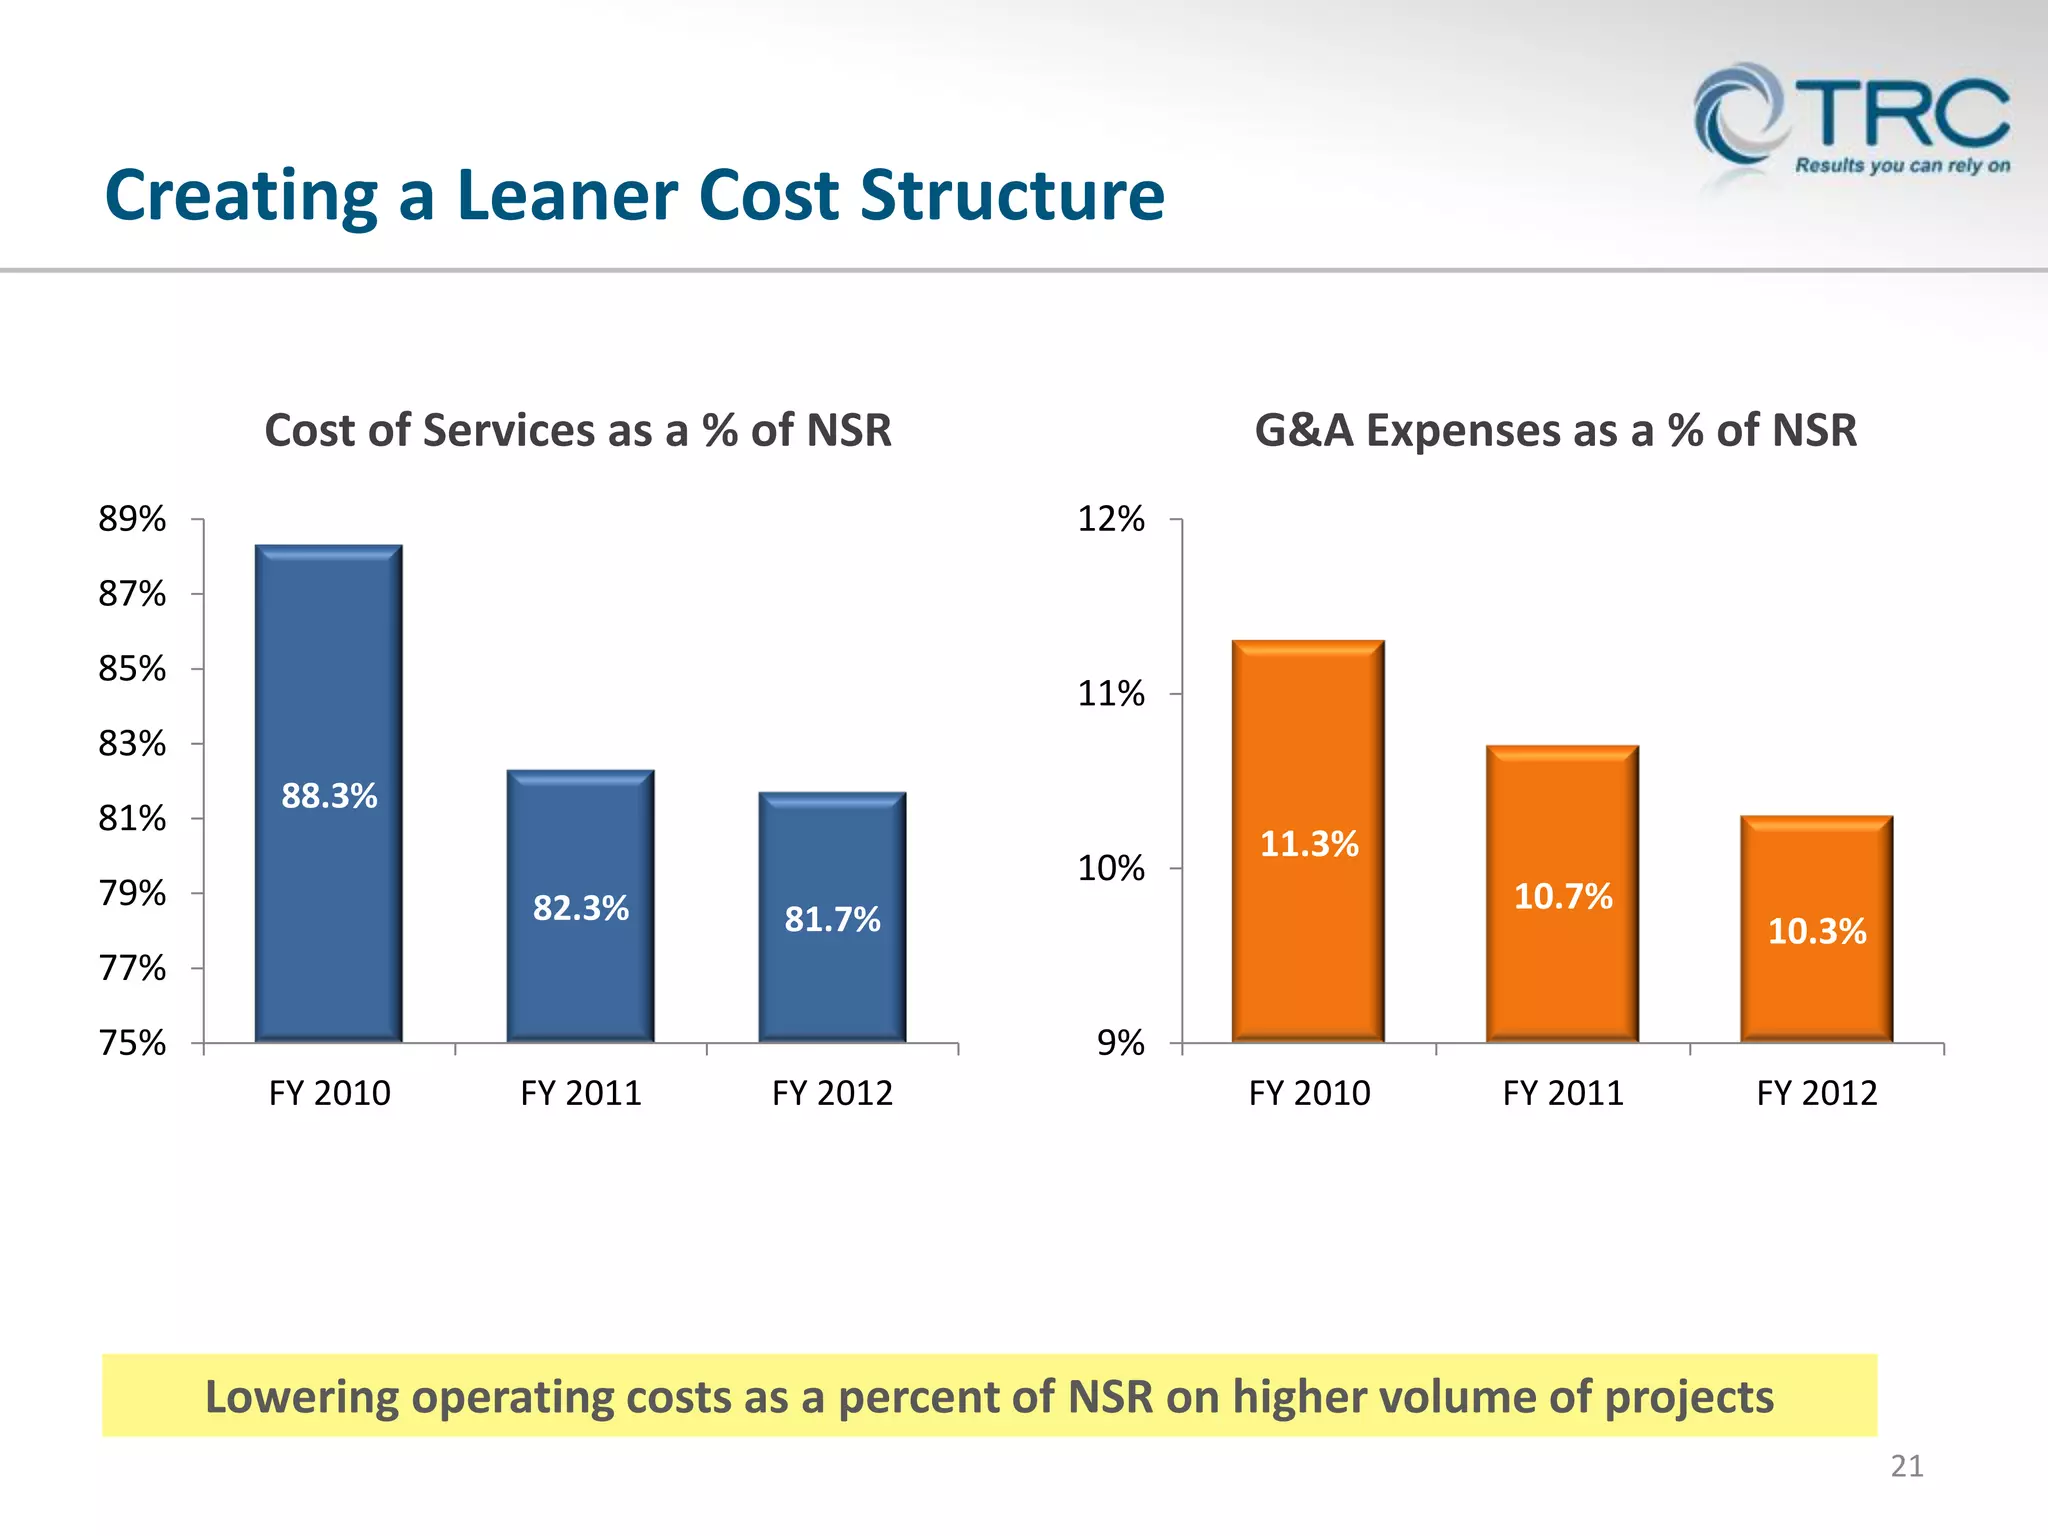
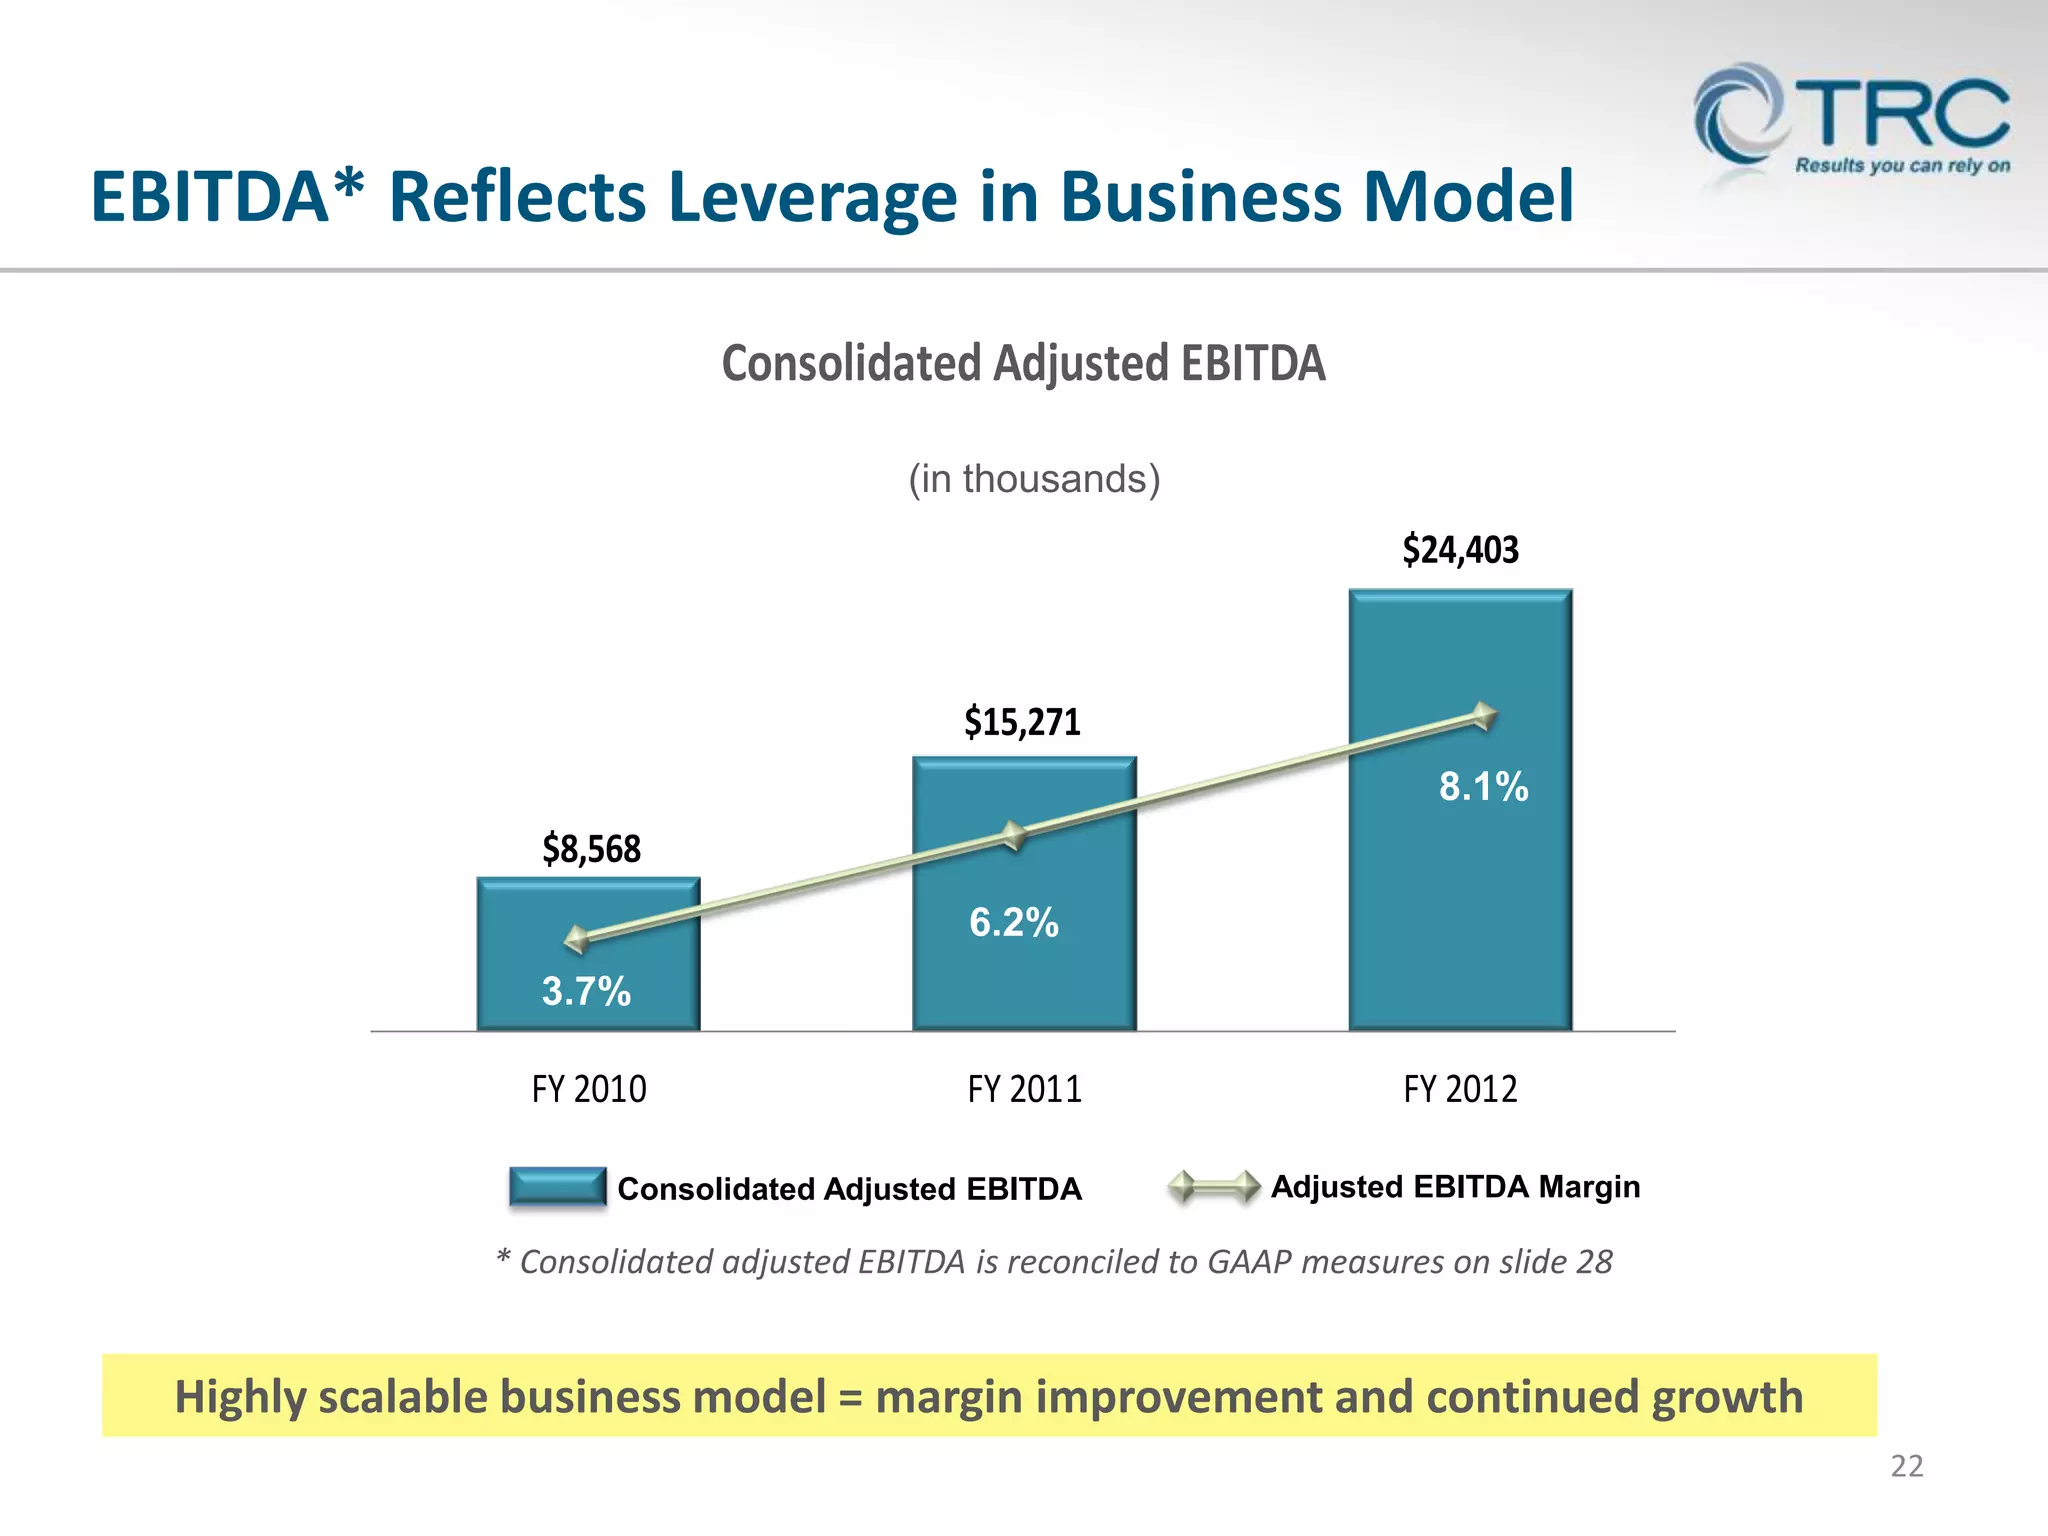
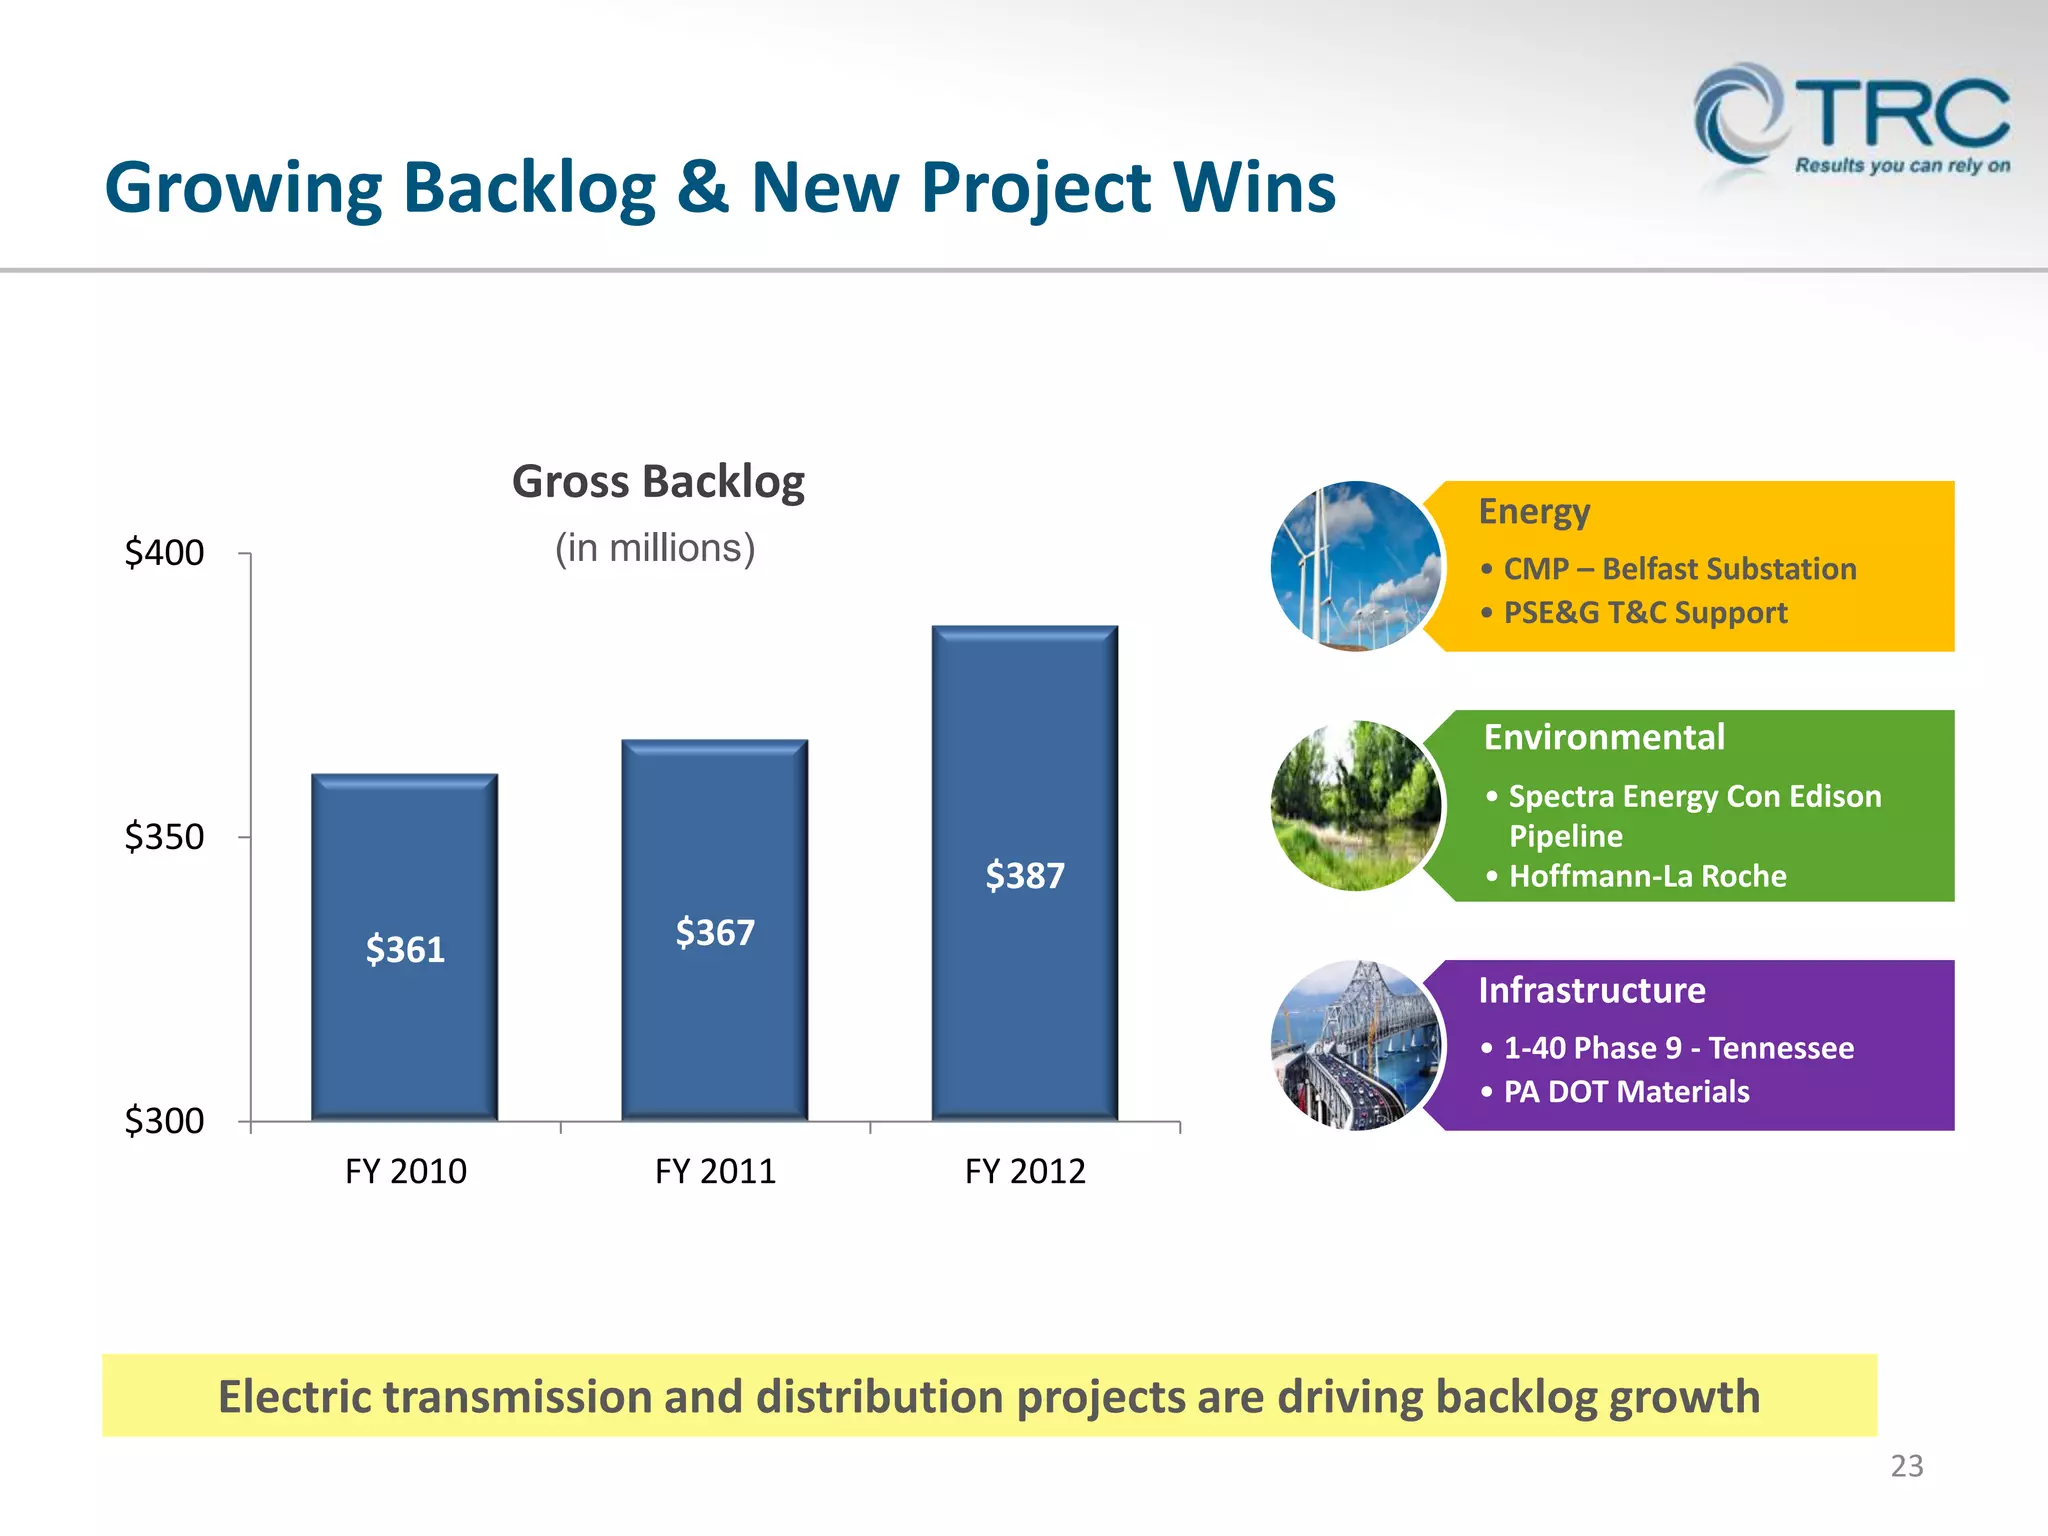
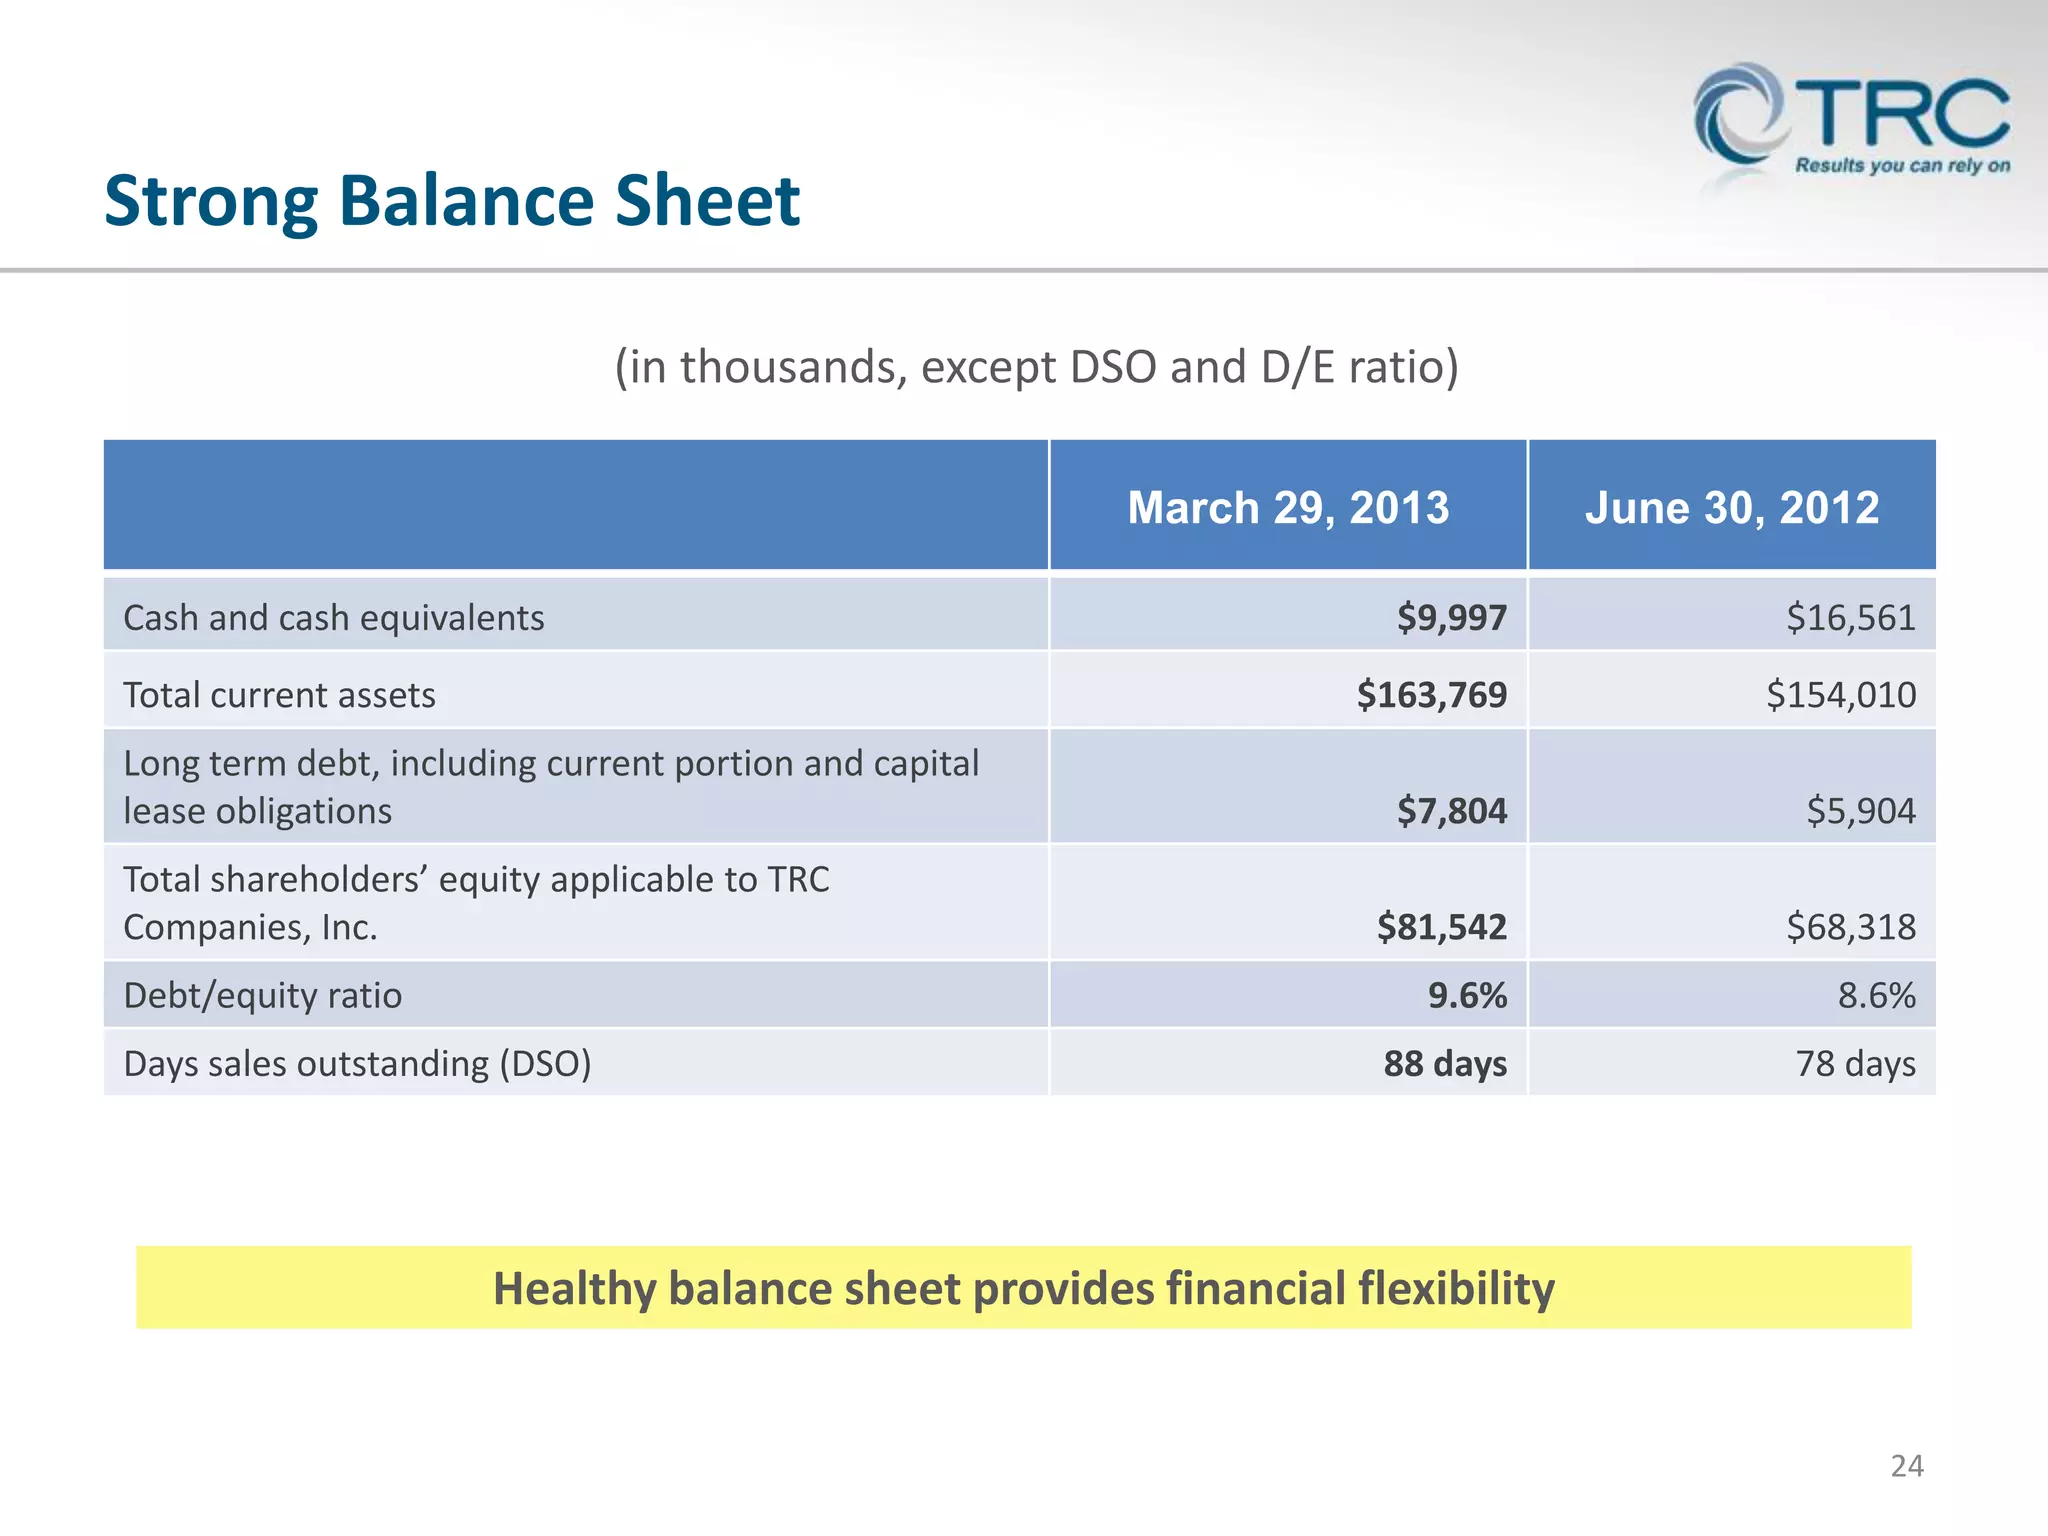
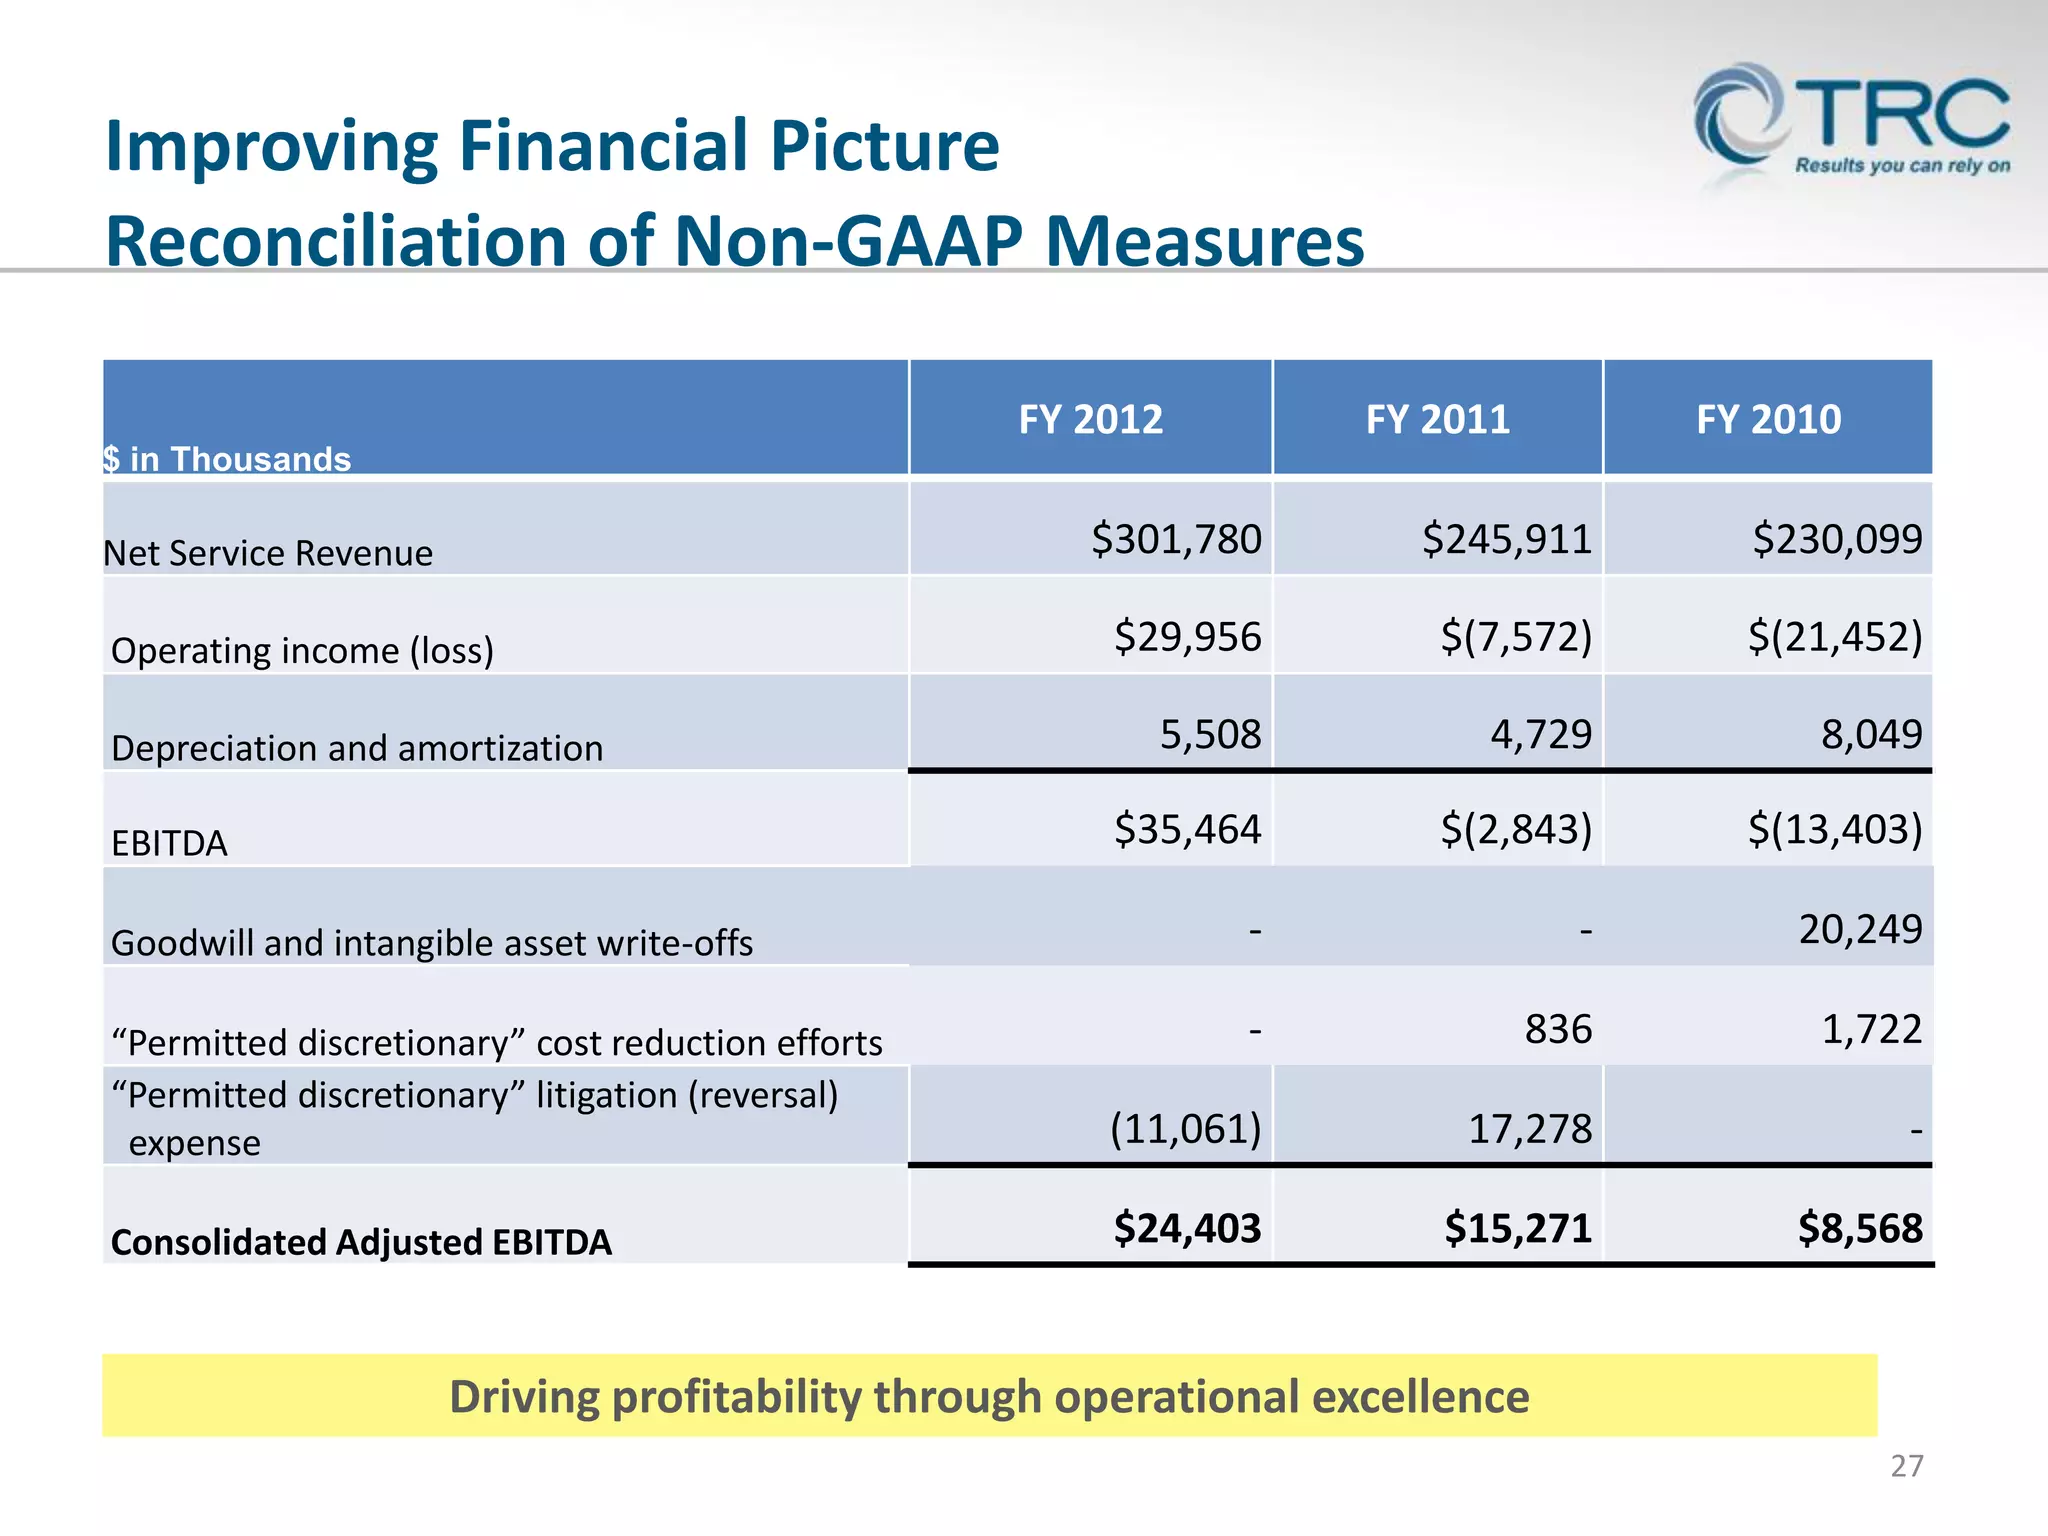
Investor Presentation
Houlihan Lokey – Global Industrials Conference
Third Quarter Fiscal 2013
TRR
Safe Harbor Statement
Certain statements in this presentation may be forward-looking statements within the meaning of Section 27A of
the Securities Act of 1933 and Section 21E of the Securities Exchange Act of 1934. You can identify these
statements by forward-looking words such as "may," "expects," "plans," "anticipates," "believes," "estimates," or
other words of similar import. You should consider statements that contain these words carefully because they
discuss TRC’s future expectations, contain projections of the Company’s future results of operations or of its
financial condition, or state other "forward-looking" information. TRC believes that it is important to communicate
its future expectations to its investors. However, there may be events in the future that the Company is not able to
accurately predict or control and that may cause its actual results to differ materially from the expectations
described in its forward-looking statements. Investors are cautioned that all forward-looking statements involve
risks and uncertainties, and actual results may differ materially from those discussed as a result of various factors,
including, but not limited to, the uncertainty of TRC’s operational and growth strategies; circumstances which could
create large cash outflows, such as contract losses, litigation, uncollectible receivables and income tax assessments;
regulatory uncertainty; the availability of funding for government projects; the level of demand for TRC’s services;
product acceptance; industry-wide competitive factors; the ability to continue to attract and retain highly skilled
and qualified personnel; the availability and adequacy of insurance; and general political or economic conditions.
Furthermore, market trends are subject to changes, which could adversely affect future results. See the risk factors
and additional discussion in TRC’s Annual Report on Form 10-K for the fiscal year ended June 30, 2012, Quarterly
Reports on Form 10-Q, and other factors detailed from time to time in the Company’s other filings with the
Securities and Exchange Commission.

2
Company Profile
A pioneer in groundbreaking scientific and engineering developments since 1969,
TRC is a national engineering, consulting and construction management firm that
provides integrated services to three primary markets:

Energy | Environmental | Infrastructure




100 + U.S. offices
London office



2,600+ employees



www.trcsolutions.com

Expert problem solvers

NYSE: TRR
3
ENR Top 500 Design Firms
"The energy market growth is inevitable and one of
the largest sectors for capital investment. Any
design firm working and supporting that market
will have a bright future.“
Chris Vincze, CEO, TRC Companies Inc.

Rank
2013

36

Firm Type

2012

32

Firm

TRC Cos. Inc., Lowell, Mass.

E

4
Investment Highlights
 Shifted to growth focus after successful turnaround execution

 Strong balance sheet & leaner cost structure
 Large addressable market opportunity
 All three segments provide significant long-term growth potential
 Diversified revenue stream with attractive customer base
 Well-positioned competitively

5
Organizational Transformation
 Strengthened balance sheet
 Executed multi-year organizational restructuring
 Centralized management team and key functions
 Implemented company-wide cost reductions
 Invested in internal technology systems
 Narrowed business and working capital focus
 Restructured or exited unprofitable business lines
 Rebranded TRC and raised awareness nationwide
 Shifted focus toward organic and acquisition growth
 Fiscal 2012 NSR Growth = Organic: 45% / Acquisitions: 55%
 Two successful acquisitions in fiscal 2012
 Acquired three businesses in fiscal 2013
6
Targeting Large Market Opportunities
Environmental, Engineering & Consulting (EE&C)
Environmental $17B

Infrastructure $34B

Energy $16B

Global Marketplace (estimated)

Source: The Environmental Financial Consulting Group

7
TRC’s Diversified Business Model
Net Service Revenue* by Segment
Environmental 53%
$159.0M
23% Growth

Infrastructure
15%

$43.5M
3% Growth

$96.0M
34% Growth

Energy 32%

Fiscal Year 2012
*TRC believes net service revenue (gross revenue less subcontractor costs and other direct reimbursable charges) best
reflects the value of services provided to its customers and is the most meaningful indicator of its revenue performance

8
Environmental Segment

53% of Total NSR







Permitting and Resource Management
Remediation and Hazardous Waste Management
Air Quality and Air Measurements
Building Sciences, Industrial Hygiene, and Compliance
Solid Waste

Growth Drivers
Economic Development | Risk Management | Regulatory Compliance
Sustainability / Climate Change
9
Energy Segment

32% of Total NSR

 Electrical Transmission, Distribution &
Substation Engineering
 Energy Efficiency
 Communications Engineering

Growth Drivers
Reliability | Power Supply | Aging Generation Assets | Regulatory
Transformation
10
Infrastructure Segment

15% of Total NSR

 Transportation Design
Services

 Geotechnical Engineering &
Materials Inspection

 Civil Engineering Services

 Construction Engineering,
Inspection & Management

 Security Consulting &
Engineering Services

Growth Drivers
Population &
Demographic
Changes

Shifting
Regulatory
Spending

Aging &
Failing
Infrastructure

Engineering
Capacity
Shortfalls

11
Broad Range of Government and
Commercial Clients
Net Service Revenue by Client Mix

State & Local
Government 21%

Federal Government 2%

Private 77%

Fiscal Year 2012

12
Revenue by Client Type
Net Service Revenue % by Industry
Other

Power / Utility
29%

47%

Transportation

13%

11%

Oil & Gas

Fiscal 2013 YTD Top 300 Clients
13
High-Profile Private Sector Clients

14
Working With All Levels of Government
State and Local

Federal

15
Why Clients Choose TRC
 Multi-disciplinary teams implement complex projects
 Nationwide network is a crucial asset that
can be integral to project success
 TRC helps clients:
 realize a higher return on investment
 manage risks
 align project solutions with
operational priorities
 integrate multiple areas of
expertise to arrive at a better solution

Concept

Delivery &
Operations

Permitting,
Engineering, &
Construction

16
Two-Pronged Growth Strategy
 Invest in high-margin organic growth opportunities focused on two
Primary Markets: Utility / Power and Oil & Gas
 Integrated National and Regional Initiatives
 National and Regional Key Accounts Programs
 Development of Cross-Selling Strategies
 Pursue strategic acquisitions to enhance service lines and geographic
footprint
 Ocampo-Esta Corp. (Covina, CA Operations) – May 2013
 GE’s Air Emissions Testing business – January 2013
 Heschong Mahone Group, Inc. – December 2012
 East Region Operations of EORM – March 2012
 The Payne Firm, Inc. – September 2011
 RMT Environmental – June 2011

17
Go-to-Market Strategy
Position TRC as the premiere service provider to the Utility/Power and Oil & Gas Markets

Utility / Power

Generation &
Utilities

RE PowerTM

Oil & Gas

Pipelines and
Terminals

Shale
18
Financial Review

19
Growth Through Acquisitions
& Internal Investments
Q3 2013 v. Q3 2012

Net Service Revenue
(in millions)

Net Service Revenue

23%

(in millions)

11%

$301.8
$230.1

$245.9

FY 2010

FY 2011

$75.1

FY 2012

Q3 2012

$83.0

Q3 2013

Focusing on expanding business in Energy and Environmental segments
20
Creating a Leaner Cost Structure
Cost of Services as a % of NSR
89%

G&A Expenses as a % of NSR
12%

87%
85%

11%

83%

81%

88.3%

10%

79%

82.3%

11.3%
10.7%

81.7%

77%
75%

10.3%

9%
FY 2010

FY 2011

FY 2012

FY 2010

FY 2011

FY 2012

Lowering operating costs as a percent of NSR on higher volume of projects
21
EBITDA* Reflects Leverage in Business Model
Consolidated Adjusted EBITDA
(in thousands)

$24,403

$15,271
8.1%

$8,568
6.2%
3.7%

FY 2010

FY 2011

Consolidated Adjusted EBITDA

FY 2012
Adjusted EBITDA Margin

* Consolidated adjusted EBITDA is reconciled to GAAP measures on slide 28

Highly scalable business model = margin improvement and continued growth
22
Growing Backlog & New Project Wins

Gross Backlog

Energy

(in millions)

$400

• CMP – Belfast Substation
• PSE&G T&C Support

Environmental
$350

$387

$361

• Spectra Energy Con Edison
Pipeline
• Hoffmann-La Roche

$367
Infrastructure
• 1-40 Phase 9 - Tennessee
• PA DOT Materials

$300
FY 2010

FY 2011

FY 2012

Electric transmission and distribution projects are driving backlog growth
23
Strong Balance Sheet
(in thousands, except DSO and D/E ratio)
March 29, 2013
Cash and cash equivalents

June 30, 2012

Total shareholders’ equity applicable to TRC
Companies, Inc.

Debt/equity ratio
Days sales outstanding (DSO)

$154,010

$7,804

$5,904

$81,542

$68,318

9.6%

Long term debt, including current portion and capital
lease obligations

$16,561

$163,769

Total current assets

$9,997

8.6%

88 days

78 days

Healthy balance sheet provides financial flexibility

24
Investment Highlights
 Shifted to growth focus after successful turnaround execution

 Strengthened balance sheet & leaner cost structure
 Large addressable market opportunity

 All three segments provide significant long-term growth
potential
 Diversified revenue stream with attractive customer base
 Well-positioned competitively

25
Questions?
James B. Stephenson
SVP Corporate Planning & Development
P: 617.385.6030 | E: JStephenson@trcsolutions.com
www.trcsolutions.com
Improving Financial Picture
Reconciliation of Non-GAAP Measures
FY 2012

FY 2011

FY 2010

$ in Thousands

$301,780

$245,911

$230,099

$29,956

$(7,572)

$(21,452)

5,508

4,729

8,049

$35,464

$(2,843)

$(13,403)

Goodwill and intangible asset write-offs

-

-

20,249

“Permitted discretionary” cost reduction efforts
“Permitted discretionary” litigation (reversal)
expense

-

836

1,722

(11,061)

17,278

-

Consolidated Adjusted EBITDA

$24,403

$15,271

$8,568

Net Service Revenue
Operating income (loss)
Depreciation and amortization
EBITDA

Driving profitability through operational excellence
27

Trc investor presentation 05 13 final

  • 1.
    Investor Presentation Houlihan Lokey– Global Industrials Conference Third Quarter Fiscal 2013 TRR
  • 2.
    Safe Harbor Statement Certainstatements in this presentation may be forward-looking statements within the meaning of Section 27A of the Securities Act of 1933 and Section 21E of the Securities Exchange Act of 1934. You can identify these statements by forward-looking words such as "may," "expects," "plans," "anticipates," "believes," "estimates," or other words of similar import. You should consider statements that contain these words carefully because they discuss TRC’s future expectations, contain projections of the Company’s future results of operations or of its financial condition, or state other "forward-looking" information. TRC believes that it is important to communicate its future expectations to its investors. However, there may be events in the future that the Company is not able to accurately predict or control and that may cause its actual results to differ materially from the expectations described in its forward-looking statements. Investors are cautioned that all forward-looking statements involve risks and uncertainties, and actual results may differ materially from those discussed as a result of various factors, including, but not limited to, the uncertainty of TRC’s operational and growth strategies; circumstances which could create large cash outflows, such as contract losses, litigation, uncollectible receivables and income tax assessments; regulatory uncertainty; the availability of funding for government projects; the level of demand for TRC’s services; product acceptance; industry-wide competitive factors; the ability to continue to attract and retain highly skilled and qualified personnel; the availability and adequacy of insurance; and general political or economic conditions. Furthermore, market trends are subject to changes, which could adversely affect future results. See the risk factors and additional discussion in TRC’s Annual Report on Form 10-K for the fiscal year ended June 30, 2012, Quarterly Reports on Form 10-Q, and other factors detailed from time to time in the Company’s other filings with the Securities and Exchange Commission. 2
  • 3.
    Company Profile A pioneerin groundbreaking scientific and engineering developments since 1969, TRC is a national engineering, consulting and construction management firm that provides integrated services to three primary markets: Energy | Environmental | Infrastructure   100 + U.S. offices London office  2,600+ employees  www.trcsolutions.com Expert problem solvers NYSE: TRR 3
  • 4.
    ENR Top 500Design Firms "The energy market growth is inevitable and one of the largest sectors for capital investment. Any design firm working and supporting that market will have a bright future.“ Chris Vincze, CEO, TRC Companies Inc. Rank 2013 36 Firm Type 2012 32 Firm TRC Cos. Inc., Lowell, Mass. E 4
  • 5.
    Investment Highlights  Shiftedto growth focus after successful turnaround execution  Strong balance sheet & leaner cost structure  Large addressable market opportunity  All three segments provide significant long-term growth potential  Diversified revenue stream with attractive customer base  Well-positioned competitively 5
  • 6.
    Organizational Transformation  Strengthenedbalance sheet  Executed multi-year organizational restructuring  Centralized management team and key functions  Implemented company-wide cost reductions  Invested in internal technology systems  Narrowed business and working capital focus  Restructured or exited unprofitable business lines  Rebranded TRC and raised awareness nationwide  Shifted focus toward organic and acquisition growth  Fiscal 2012 NSR Growth = Organic: 45% / Acquisitions: 55%  Two successful acquisitions in fiscal 2012  Acquired three businesses in fiscal 2013 6
  • 7.
    Targeting Large MarketOpportunities Environmental, Engineering & Consulting (EE&C) Environmental $17B Infrastructure $34B Energy $16B Global Marketplace (estimated) Source: The Environmental Financial Consulting Group 7
  • 8.
    TRC’s Diversified BusinessModel Net Service Revenue* by Segment Environmental 53% $159.0M 23% Growth Infrastructure 15% $43.5M 3% Growth $96.0M 34% Growth Energy 32% Fiscal Year 2012 *TRC believes net service revenue (gross revenue less subcontractor costs and other direct reimbursable charges) best reflects the value of services provided to its customers and is the most meaningful indicator of its revenue performance 8
  • 9.
    Environmental Segment 53% ofTotal NSR      Permitting and Resource Management Remediation and Hazardous Waste Management Air Quality and Air Measurements Building Sciences, Industrial Hygiene, and Compliance Solid Waste Growth Drivers Economic Development | Risk Management | Regulatory Compliance Sustainability / Climate Change 9
  • 10.
    Energy Segment 32% ofTotal NSR  Electrical Transmission, Distribution & Substation Engineering  Energy Efficiency  Communications Engineering Growth Drivers Reliability | Power Supply | Aging Generation Assets | Regulatory Transformation 10
  • 11.
    Infrastructure Segment 15% ofTotal NSR  Transportation Design Services  Geotechnical Engineering & Materials Inspection  Civil Engineering Services  Construction Engineering, Inspection & Management  Security Consulting & Engineering Services Growth Drivers Population & Demographic Changes Shifting Regulatory Spending Aging & Failing Infrastructure Engineering Capacity Shortfalls 11
  • 12.
    Broad Range ofGovernment and Commercial Clients Net Service Revenue by Client Mix State & Local Government 21% Federal Government 2% Private 77% Fiscal Year 2012 12
  • 13.
    Revenue by ClientType Net Service Revenue % by Industry Other Power / Utility 29% 47% Transportation 13% 11% Oil & Gas Fiscal 2013 YTD Top 300 Clients 13
  • 14.
  • 15.
    Working With AllLevels of Government State and Local Federal 15
  • 16.
    Why Clients ChooseTRC  Multi-disciplinary teams implement complex projects  Nationwide network is a crucial asset that can be integral to project success  TRC helps clients:  realize a higher return on investment  manage risks  align project solutions with operational priorities  integrate multiple areas of expertise to arrive at a better solution Concept Delivery & Operations Permitting, Engineering, & Construction 16
  • 17.
    Two-Pronged Growth Strategy Invest in high-margin organic growth opportunities focused on two Primary Markets: Utility / Power and Oil & Gas  Integrated National and Regional Initiatives  National and Regional Key Accounts Programs  Development of Cross-Selling Strategies  Pursue strategic acquisitions to enhance service lines and geographic footprint  Ocampo-Esta Corp. (Covina, CA Operations) – May 2013  GE’s Air Emissions Testing business – January 2013  Heschong Mahone Group, Inc. – December 2012  East Region Operations of EORM – March 2012  The Payne Firm, Inc. – September 2011  RMT Environmental – June 2011 17
  • 18.
    Go-to-Market Strategy Position TRCas the premiere service provider to the Utility/Power and Oil & Gas Markets Utility / Power Generation & Utilities RE PowerTM Oil & Gas Pipelines and Terminals Shale 18
  • 19.
  • 20.
    Growth Through Acquisitions &Internal Investments Q3 2013 v. Q3 2012 Net Service Revenue (in millions) Net Service Revenue 23% (in millions) 11% $301.8 $230.1 $245.9 FY 2010 FY 2011 $75.1 FY 2012 Q3 2012 $83.0 Q3 2013 Focusing on expanding business in Energy and Environmental segments 20
  • 21.
    Creating a LeanerCost Structure Cost of Services as a % of NSR 89% G&A Expenses as a % of NSR 12% 87% 85% 11% 83% 81% 88.3% 10% 79% 82.3% 11.3% 10.7% 81.7% 77% 75% 10.3% 9% FY 2010 FY 2011 FY 2012 FY 2010 FY 2011 FY 2012 Lowering operating costs as a percent of NSR on higher volume of projects 21
  • 22.
    EBITDA* Reflects Leveragein Business Model Consolidated Adjusted EBITDA (in thousands) $24,403 $15,271 8.1% $8,568 6.2% 3.7% FY 2010 FY 2011 Consolidated Adjusted EBITDA FY 2012 Adjusted EBITDA Margin * Consolidated adjusted EBITDA is reconciled to GAAP measures on slide 28 Highly scalable business model = margin improvement and continued growth 22
  • 23.
    Growing Backlog &New Project Wins Gross Backlog Energy (in millions) $400 • CMP – Belfast Substation • PSE&G T&C Support Environmental $350 $387 $361 • Spectra Energy Con Edison Pipeline • Hoffmann-La Roche $367 Infrastructure • 1-40 Phase 9 - Tennessee • PA DOT Materials $300 FY 2010 FY 2011 FY 2012 Electric transmission and distribution projects are driving backlog growth 23
  • 24.
    Strong Balance Sheet (inthousands, except DSO and D/E ratio) March 29, 2013 Cash and cash equivalents June 30, 2012 Total shareholders’ equity applicable to TRC Companies, Inc. Debt/equity ratio Days sales outstanding (DSO) $154,010 $7,804 $5,904 $81,542 $68,318 9.6% Long term debt, including current portion and capital lease obligations $16,561 $163,769 Total current assets $9,997 8.6% 88 days 78 days Healthy balance sheet provides financial flexibility 24
  • 25.
    Investment Highlights  Shiftedto growth focus after successful turnaround execution  Strengthened balance sheet & leaner cost structure  Large addressable market opportunity  All three segments provide significant long-term growth potential  Diversified revenue stream with attractive customer base  Well-positioned competitively 25
  • 26.
    Questions? James B. Stephenson SVPCorporate Planning & Development P: 617.385.6030 | E: JStephenson@trcsolutions.com www.trcsolutions.com
  • 27.
    Improving Financial Picture Reconciliationof Non-GAAP Measures FY 2012 FY 2011 FY 2010 $ in Thousands $301,780 $245,911 $230,099 $29,956 $(7,572) $(21,452) 5,508 4,729 8,049 $35,464 $(2,843) $(13,403) Goodwill and intangible asset write-offs - - 20,249 “Permitted discretionary” cost reduction efforts “Permitted discretionary” litigation (reversal) expense - 836 1,722 (11,061) 17,278 - Consolidated Adjusted EBITDA $24,403 $15,271 $8,568 Net Service Revenue Operating income (loss) Depreciation and amortization EBITDA Driving profitability through operational excellence 27