SlideShare a Scribd company logo
1 of 10
Download to read offline
ANGELA UYI
08054802925
1
INTRODUCTION
This presentation is intended to explain the urban transportation modeling process works, the
assumptions made and the steps used to forecast travel demand for urban transportation
planning. This is done in order to help to understand the process and its implications and to
help people to interpret and comment on its results. The introduction is intended for use by
local or regional planning commissioners, elected officials and interested citizens who have to
react to transportation plans.
Transportation planning uses the term 'models' extensively. This term is used to refer to a
series of mathematical equations that are used to represent how choices are made when
people travel. Travel demand occurs as a result of thousands of individual travelers making
individual decisions on how, where and when to travel. These decisions are affected by many
factors such as family situations, characteristics of the person making the trip, and the choices
(destination, route and mode) available for the trip.
The transportation model can also be used as a comparative tool providing business decision
makers with the information they need to properly balance cost and supply. The use of this
model for capacity planning is similar to the models used by engineers in the planning of
waterways and highways.
This model will help decide what the optimal shipping plan is by determining a minimum cost
for shipping from numerous sources to numerous destinations. This will help for comparison
when identifying alternatives in terms of their impact on the final cost for a system. The main
applications of the transportation model mention in this research are location decisions,
production planning, capacity planning and transshipment.
Travel demand modeling was first developed in the late 1950's as a means to do highway
planning. As the need to look at other problems such as transit, land use issues and air quality
analysis arose, the modeling process has been modified to add additional techniques to deal
with these problems.
Application of the Models
Print to PDF without this message by purchasing novaPDF (http://www.novapdf.com/)
ANGELA UYI
08054802925
2
Models are important because transportation plans and investments are based on what the
models say about future travel. Models are used to estimate the number of trips that will be
made on a transportation systems alternative at some future date. These estimates are the
basis for transportation plans and are used in major investment analysis, environmental impact
statements and in setting priorities for investments. Models are based upon assumptions of the
way in which travel occurs. A clear understanding of the modeling process is important to help
to understand transportation plans and their recommendations
Models provide forecasts only for those factors and alternatives which are explicitly included in
the equations of the models. If the models are not sensitive to certain polices or programs (i.e.
policy sensitive), the models will not show the effect these policies. This could lead to a
conclusion that such polices are ineffective. This would be wrong because the models were
not capable of testing the policy. For example, travel forecasting models usually exclude
pedestrian and bicycle trips. Plans that include bicycle or pedestrian system improvements will
not show any impact from the modeling procedure if the models ignore these types of trips.
However, It would not be correct to conclude that pedestrian or bicycle improvements are
ineffective. The actual impact is unknown. Therefore it is critical that the assumptions used in
the modeling process and the model limitations be explicitly stated and considered before
decisions are made.
Transportation modeling finds the least-cost means of shipping supplies from several origins
to several destinations. Origin points (or sources) can be factories, warehouses, car rental
agencies like Adams, or any other points from which goods are shipped. Destinations are any
points that receive goods.
Transportation modeling
Print to PDF without this message by purchasing novaPDF (http://www.novapdf.com/)
ANGELA UYI
08054802925
3
An iterative procedure for solving problems that involves minimizing the cost of shipping
products from a series of sources to a series of destinations.
Nonetheless, the major assumptions of the transportation model are the following:
1. Items are homogeneous
2. Shipping cost per unit is the same no matter how many units are shipped
3. Only one route is used from place of shipment to the destination
The transportation model is actually a class of the linear programming models.
As it is for linear programming, software is available to solve transportation problems. To fully
use such programs, though, you need to understand the assumptions that underlie the model.
To illustrate one transportation problem, in this module we look at a company called Adams
Plumbing works Ltd. Plumbing, which makes, among other products, a full line of bathtubs. In
our example, the firm must decide which of its factories should supply which of its warehouses.
Relevant data for Adams Plumbing works Limited are presented in Table C.1 and Figure C.1.
Table C.1 shows, for example, that it costs Adams Plumbing works Ltd. N5 to ship one
bathtub from its Delta factory to its Adamawa warehouse, N4 to Benin, and N3 to Calabar.
Likewise, we see in Figure C.1
TABLE C.1
Transportation Costs per
Bathtub for Adams Plumbing works Ltd
To
From
Adamawa Benin Calabar
Des
Moines
N5 N4 N3
Evansville N8 N4 N3
Fort
Lauderdale
N9 N7 N5
Print to PDF without this message by purchasing novaPDF (http://www.novapdf.com/)
ANGELA UYI
08054802925
4
that the 300 units required by Adams Plumbing works Ltd Adamawa warehouse may be
shipped in various
combinations from its Delta, Enugu, and F.C.T factories.
The first step in the modeling process is to set up a transportation matrix. Its purpose is to
summarize
all relevant data and to keep track of algorithm computations. Using the information displayed
in
Figure C.1 and Table C.1, we can construct a transportation matrix as shown in Figure C.2.
TO
From
(A)
ABIA
(B)
BENIN
(C)
CALABAR FACTORY
CAPACITY
(D)
DELTA
100
N5 N4 N3 100
(E)
ENUGU
200
N8 N4 N3 300
(F)
FCT
300 100 200
300
F.C.T 300 units required
DELTA 100 UNITS
ADAMAWA 300 UNITS
ENUGU 300 UNITS
CALABAR
200 UNITS
BENIN 200 UNITS
REQUIRED
FIGURE C.1
Transportation Problem
Delta
capacity
constraint
Cell
representing
a possible
source to
destination
shipping
assignment
(Enugu
FIGURE C.2 _
Transportation
Matrix for
Adams
Plumbing works
Print to PDF without this message by purchasing novaPDF (http://www.novapdf.com/)
ANGELA UYI
08054802925
5
N9 N7 N5
Warehouse
requirement
300 200 200 700
DEVELOPING AN INITIAL SOLUTION
Once the data are arranged in tabular form, we must establish an initial feasible solution to the
problem.
A number of different methods have been developed for this step. We now discuss two of
them, the northwest-corner rule and the intuitive lowest-cost method.
The Northwest-Corner Rule
The northwest-corner rule requires that we start in the upper left-hand cell (or northwest
corner) of the table and allocate units to shipping routes as follows:
1. Exhaust the supply (factory capacity) of each row (e.g., Delta: 100) before moving
down to the next row.
2. Exhaust the (warehouse) requirements of each column (e.g., Adamawa: 300) before
moving to the next column on the right.
3. Check to ensure that all supplies and demands are met.
Example C1 applies the northwest-corner rule to our Arizona Plumbing problem.
In Figure C.3 we use the northwest-corner rule to find an initial feasible solution to the Adams
Plumbing works Ltd. problem.
To make our initial shipping assignments, we need five steps:
1. Assign 100 Buckets from Delta to Adamawa (exhausting Delta’s supply).
2. Assign 200 buckets from Enugu to Adamawa (exhausting Adamawa’s demand).
3. Assign 100 buckets from Enugu to Benin (exhausting Enugu’s supply).
4. Assign 100 buckets from F.C.T to Benin (exhausting Benin’s demand).
5. Assign 200 buckets from F.C.T to Calabar (exhausting Calabar’s demand and F.C.T’s
supply).
The total cost of this shipping assignment is N4,200 (see Table C.2).
TO
From
(A)
ABIA
(B)
BENIN
(C)
CALABAR FACTORY
CAPACITY
(D)
DELTA
100
100
Total demand
and total supply
Calabar
warehouse
demand
Cost of shipping 1 unit
fromF.C.Tfactory to Benin
warehouse
Print to PDF without this message by purchasing novaPDF (http://www.novapdf.com/)
ANGELA UYI
08054802925
6
N5 4 3
(E)
ENUGU
200
8 4 3 300
(F)
FCT
300
9
100
7
200
5 300
Warehouse
requirement
300 200 200 700
FIGURE C.3 _
Northwest-Corner
Solution to Eleganza manufacturing Problem
Means that the firm is shipping 100
Buckets from FCT to Benin
TABLE C.2 _ Computed Shipping Cost
ROUTE
FROM TO BCK
SHIPPED
COST PER
UNIT
TOTAL COST
D A 100 5 500
E A 200 8 1,600
E B 100 4 400
F B 100 7 700
Print to PDF without this message by purchasing novaPDF (http://www.novapdf.com/)
ANGELA UYI
08054802925
7
F C 200 5 1,000
TOTAL: N4,200
The Intuitive Lowest-Cost Method
The intuitive method makes initial allocations based on lowest cost. This straightforward
approach uses the following steps:
1. Identify the cell with the lowest cost. Break any ties for the lowest cost arbitrarily.
2. Allocate as many units as possible to that cell without exceeding the supply or demand.
Then cross out that row or column (or both) that is exhausted by this assignment.
3. Find the cell with the lowest cost from the remaining (not crossed out) cells.
4. Repeat steps 2 and 3 until all units have been allocated.
TO
From
(A)
ABIA
(B)
BENIN
(C)
CALABAR FACTORY
CAPACITY
(D)
DELTA N5 4
100
3 100
(E)
ENUGU 8
200
4
100
3 300
Third, cross out row E and
column B after
Entering 200 units in this
N4 cell because
Second, cross out column
C after
entering 100 units in this
N3 cell because column C
is satisfied
First, cross out top row (D) after
entering 100 units in N3 cell
because row D is satisfied.
Print to PDF without this message by purchasing novaPDF (http://www.novapdf.com/)
ANGELA UYI
08054802925
8
(F)
FCT
N300
9 7 5 300
Warehouse
requirement
300 200 200 700
FIGURE C.4 _ Intuitive Lowest-Cost Solution to Arizona Plumbing Problem
SPECIAL ISSUES IN MODELING
Demand Not Equal to Supply
A common situation in real-world problems is the case in which total demand is not equal to
total supply. We can easily handle these so-called unbalanced problems with the solution
procedures that we have just discussed by introducing dummy sources or dummy
destinations. If total supply is greater than total demand, we make demand exactly equal the
surplus by creating a dummy destination.
Conversely, if total demand is greater than total supply, we introduce a dummy source
(factory) with a supply equal to the excess of demand. Because these units will not in fact be
shipped, we assign cost coefficients of zero to each square on the dummy location. In each
case, then, the cost is zero. Example C5 demonstrates the use of a dummy destination.
Degeneracy
An occurrence in transportation models in which too few squares or shipping routes are being
used, so that tracing a closed path for each unused square becomes impossible.
Dummy sources
Artificial shipping source points created in the transportation method when total demand is
greater than total supply to effect a supply equal to the excess of demand over supply.
Dummy destinations
Artificial destination points created in the transportation method when the total supply is
greater than the total demand; they serve to equalize the total demand and supply.
S U M M A R Y
The transportation model, a form of linear programming, is used to help find the least-cost
solutions to system wide shipping problems. The northwest-corner method (which begins in
the upper-left corner of the transportation table) or the intuitive lowest-cost method may be
used for finding an initial feasible solution. The stepping-stone algorithm is then used for
finding optimal solutions.
Unbalanced problems are those in which the total demand and total supply are not equal.
Degeneracy refers to the case in which the number of rows + the number of columns _ 1 is not
equal to the number of occupied squares.
CONCLUSION
The transportation problem is one of the most frequently encountered applications in real life
situations and is a special type of linear programming problem. The transportation problem
Finally, enter 300
units in the only
remaining cell to
complete the
allocations.
Print to PDF without this message by purchasing novaPDF (http://www.novapdf.com/)
ANGELA UYI
08054802925
9
indicates the amount of consignment to be transported from various origins to different
destinations so that the total transportation cost is minimized without violating the availability
constraints and the requirement constraints.
BIBLIOGRAPHY
Drezner, Z. Facility Location: A Survey of Applications and Methods.
Secaucus, NJ: Springer-Verlag (1995).
Haksever, C., B. Render, and R. Russell. Service Management and
Operations, 2nd ed. Upper Saddle River, NJ: Prentice Hall (2000).
Koksalan, M., and H. Sural. “Efes Beverage Group Makes Location
and Distribution Decisions for Its Malt Plants.” Interfaces 29
(March–April 1999): 89–103.
Ping, J., and K. F. Chu. “A Dual-Matrix Approach to the
Transportation Problem.” Asia–Pacific Journal of Operations
Research 19 (May 2002): 35–46.
Render, B., R. M. Stair, and R. Balakrishnan. Managerial Decision
Modeling with Spreadsheets. 2nd. ed. Upper Saddle River, NJ:
Prentice Hall (2006).
Print to PDF without this message by purchasing novaPDF (http://www.novapdf.com/)
ANGELA UYI
08054802925
10
Print to PDF without this message by purchasing novaPDF (http://www.novapdf.com/)

More Related Content

Similar to TRANSPORTATION MODEL2

Chapter 5.TRANSPORTATION PROBLEM.pdf
Chapter 5.TRANSPORTATION PROBLEM.pdfChapter 5.TRANSPORTATION PROBLEM.pdf
Chapter 5.TRANSPORTATION PROBLEM.pdfTsegay Berhe
 
MODIFIED VOGEL APPROXIMATION METHOD FOR BALANCED TRANSPORTATION MODELS TOWARD...
MODIFIED VOGEL APPROXIMATION METHOD FOR BALANCED TRANSPORTATION MODELS TOWARD...MODIFIED VOGEL APPROXIMATION METHOD FOR BALANCED TRANSPORTATION MODELS TOWARD...
MODIFIED VOGEL APPROXIMATION METHOD FOR BALANCED TRANSPORTATION MODELS TOWARD...IAEME Publication
 
CFD Simulation for Flow over Passenger Car Using Tail Plates for Aerodynamic ...
CFD Simulation for Flow over Passenger Car Using Tail Plates for Aerodynamic ...CFD Simulation for Flow over Passenger Car Using Tail Plates for Aerodynamic ...
CFD Simulation for Flow over Passenger Car Using Tail Plates for Aerodynamic ...IOSR Journals
 
ADVANCED TOOL FOR FLUID DYNAMICS-CFD AND ITS APPLICATIONS IN AUTOMOTIVE, AERO...
ADVANCED TOOL FOR FLUID DYNAMICS-CFD AND ITS APPLICATIONS IN AUTOMOTIVE, AERO...ADVANCED TOOL FOR FLUID DYNAMICS-CFD AND ITS APPLICATIONS IN AUTOMOTIVE, AERO...
ADVANCED TOOL FOR FLUID DYNAMICS-CFD AND ITS APPLICATIONS IN AUTOMOTIVE, AERO...IAEME Publication
 
Jack neift trucking company prepared slides.
Jack neift trucking company prepared slides.Jack neift trucking company prepared slides.
Jack neift trucking company prepared slides.faizanahamd
 
Amylin Sustainable Transportation Plan
Amylin Sustainable Transportation PlanAmylin Sustainable Transportation Plan
Amylin Sustainable Transportation Planbvernetti0324
 
Strategic Management in Dynamic Environments MGMT 690Beginning D.docx
Strategic Management in Dynamic Environments MGMT 690Beginning D.docxStrategic Management in Dynamic Environments MGMT 690Beginning D.docx
Strategic Management in Dynamic Environments MGMT 690Beginning D.docxflorriezhamphrey3065
 
Customized Mass Transit
Customized Mass TransitCustomized Mass Transit
Customized Mass TransitDanTrietsch
 
[DSC Europe 23][AICommerce] Aleksei Chernobrovov-The_Specifics_of_the_AB-test...
[DSC Europe 23][AICommerce] Aleksei Chernobrovov-The_Specifics_of_the_AB-test...[DSC Europe 23][AICommerce] Aleksei Chernobrovov-The_Specifics_of_the_AB-test...
[DSC Europe 23][AICommerce] Aleksei Chernobrovov-The_Specifics_of_the_AB-test...DataScienceConferenc1
 
Lean&Mean Terminal Design benefits from advanced modelling (Terminal Operator...
Lean&Mean Terminal Design benefits from advanced modelling (Terminal Operator...Lean&Mean Terminal Design benefits from advanced modelling (Terminal Operator...
Lean&Mean Terminal Design benefits from advanced modelling (Terminal Operator...Yvo Saanen
 
Traffic Conditions - From Now Until Forever
Traffic Conditions - From Now Until ForeverTraffic Conditions - From Now Until Forever
Traffic Conditions - From Now Until ForeverWSP
 
Case Study for Plant Layout :: A modern analysis
Case Study for Plant Layout :: A modern analysisCase Study for Plant Layout :: A modern analysis
Case Study for Plant Layout :: A modern analysisSarang Bhutada
 
Evaluation of level of service at chatikara, Mathura
Evaluation of level of service at chatikara, MathuraEvaluation of level of service at chatikara, Mathura
Evaluation of level of service at chatikara, MathuraSHASHANK KAMAL
 
IRJET- CFD-A Trend in Automobile Aerodynamics Technology
IRJET- 	  CFD-A Trend in Automobile Aerodynamics TechnologyIRJET- 	  CFD-A Trend in Automobile Aerodynamics Technology
IRJET- CFD-A Trend in Automobile Aerodynamics TechnologyIRJET Journal
 
Production management
Production managementProduction management
Production managementsmumbahelp
 

Similar to TRANSPORTATION MODEL2 (20)

Chapter 5.TRANSPORTATION PROBLEM.pdf
Chapter 5.TRANSPORTATION PROBLEM.pdfChapter 5.TRANSPORTATION PROBLEM.pdf
Chapter 5.TRANSPORTATION PROBLEM.pdf
 
MODIFIED VOGEL APPROXIMATION METHOD FOR BALANCED TRANSPORTATION MODELS TOWARD...
MODIFIED VOGEL APPROXIMATION METHOD FOR BALANCED TRANSPORTATION MODELS TOWARD...MODIFIED VOGEL APPROXIMATION METHOD FOR BALANCED TRANSPORTATION MODELS TOWARD...
MODIFIED VOGEL APPROXIMATION METHOD FOR BALANCED TRANSPORTATION MODELS TOWARD...
 
CFD Simulation for Flow over Passenger Car Using Tail Plates for Aerodynamic ...
CFD Simulation for Flow over Passenger Car Using Tail Plates for Aerodynamic ...CFD Simulation for Flow over Passenger Car Using Tail Plates for Aerodynamic ...
CFD Simulation for Flow over Passenger Car Using Tail Plates for Aerodynamic ...
 
Economic Impact Analysis
Economic Impact AnalysisEconomic Impact Analysis
Economic Impact Analysis
 
Ichiro Satoh
Ichiro SatohIchiro Satoh
Ichiro Satoh
 
ADVANCED TOOL FOR FLUID DYNAMICS-CFD AND ITS APPLICATIONS IN AUTOMOTIVE, AERO...
ADVANCED TOOL FOR FLUID DYNAMICS-CFD AND ITS APPLICATIONS IN AUTOMOTIVE, AERO...ADVANCED TOOL FOR FLUID DYNAMICS-CFD AND ITS APPLICATIONS IN AUTOMOTIVE, AERO...
ADVANCED TOOL FOR FLUID DYNAMICS-CFD AND ITS APPLICATIONS IN AUTOMOTIVE, AERO...
 
3.9 báo cáo khuyến nghị
3.9 báo cáo khuyến nghị3.9 báo cáo khuyến nghị
3.9 báo cáo khuyến nghị
 
Jack neift trucking company prepared slides.
Jack neift trucking company prepared slides.Jack neift trucking company prepared slides.
Jack neift trucking company prepared slides.
 
Unit 5 or
Unit 5 orUnit 5 or
Unit 5 or
 
Amylin Sustainable Transportation Plan
Amylin Sustainable Transportation PlanAmylin Sustainable Transportation Plan
Amylin Sustainable Transportation Plan
 
Strategic Management in Dynamic Environments MGMT 690Beginning D.docx
Strategic Management in Dynamic Environments MGMT 690Beginning D.docxStrategic Management in Dynamic Environments MGMT 690Beginning D.docx
Strategic Management in Dynamic Environments MGMT 690Beginning D.docx
 
Customized Mass Transit
Customized Mass TransitCustomized Mass Transit
Customized Mass Transit
 
[DSC Europe 23][AICommerce] Aleksei Chernobrovov-The_Specifics_of_the_AB-test...
[DSC Europe 23][AICommerce] Aleksei Chernobrovov-The_Specifics_of_the_AB-test...[DSC Europe 23][AICommerce] Aleksei Chernobrovov-The_Specifics_of_the_AB-test...
[DSC Europe 23][AICommerce] Aleksei Chernobrovov-The_Specifics_of_the_AB-test...
 
Lean&Mean Terminal Design benefits from advanced modelling (Terminal Operator...
Lean&Mean Terminal Design benefits from advanced modelling (Terminal Operator...Lean&Mean Terminal Design benefits from advanced modelling (Terminal Operator...
Lean&Mean Terminal Design benefits from advanced modelling (Terminal Operator...
 
Traffic Conditions - From Now Until Forever
Traffic Conditions - From Now Until ForeverTraffic Conditions - From Now Until Forever
Traffic Conditions - From Now Until Forever
 
Case Study for Plant Layout :: A modern analysis
Case Study for Plant Layout :: A modern analysisCase Study for Plant Layout :: A modern analysis
Case Study for Plant Layout :: A modern analysis
 
Evaluation of level of service at chatikara, Mathura
Evaluation of level of service at chatikara, MathuraEvaluation of level of service at chatikara, Mathura
Evaluation of level of service at chatikara, Mathura
 
IRJET- CFD-A Trend in Automobile Aerodynamics Technology
IRJET- 	  CFD-A Trend in Automobile Aerodynamics TechnologyIRJET- 	  CFD-A Trend in Automobile Aerodynamics Technology
IRJET- CFD-A Trend in Automobile Aerodynamics Technology
 
Production management
Production managementProduction management
Production management
 
JSAE-20075018-Gruen
JSAE-20075018-GruenJSAE-20075018-Gruen
JSAE-20075018-Gruen
 

TRANSPORTATION MODEL2

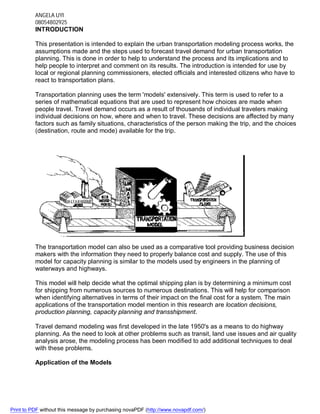
  • 1. ANGELA UYI 08054802925 1 INTRODUCTION This presentation is intended to explain the urban transportation modeling process works, the assumptions made and the steps used to forecast travel demand for urban transportation planning. This is done in order to help to understand the process and its implications and to help people to interpret and comment on its results. The introduction is intended for use by local or regional planning commissioners, elected officials and interested citizens who have to react to transportation plans. Transportation planning uses the term 'models' extensively. This term is used to refer to a series of mathematical equations that are used to represent how choices are made when people travel. Travel demand occurs as a result of thousands of individual travelers making individual decisions on how, where and when to travel. These decisions are affected by many factors such as family situations, characteristics of the person making the trip, and the choices (destination, route and mode) available for the trip. The transportation model can also be used as a comparative tool providing business decision makers with the information they need to properly balance cost and supply. The use of this model for capacity planning is similar to the models used by engineers in the planning of waterways and highways. This model will help decide what the optimal shipping plan is by determining a minimum cost for shipping from numerous sources to numerous destinations. This will help for comparison when identifying alternatives in terms of their impact on the final cost for a system. The main applications of the transportation model mention in this research are location decisions, production planning, capacity planning and transshipment. Travel demand modeling was first developed in the late 1950's as a means to do highway planning. As the need to look at other problems such as transit, land use issues and air quality analysis arose, the modeling process has been modified to add additional techniques to deal with these problems. Application of the Models Print to PDF without this message by purchasing novaPDF (http://www.novapdf.com/)
  • 2. ANGELA UYI 08054802925 2 Models are important because transportation plans and investments are based on what the models say about future travel. Models are used to estimate the number of trips that will be made on a transportation systems alternative at some future date. These estimates are the basis for transportation plans and are used in major investment analysis, environmental impact statements and in setting priorities for investments. Models are based upon assumptions of the way in which travel occurs. A clear understanding of the modeling process is important to help to understand transportation plans and their recommendations Models provide forecasts only for those factors and alternatives which are explicitly included in the equations of the models. If the models are not sensitive to certain polices or programs (i.e. policy sensitive), the models will not show the effect these policies. This could lead to a conclusion that such polices are ineffective. This would be wrong because the models were not capable of testing the policy. For example, travel forecasting models usually exclude pedestrian and bicycle trips. Plans that include bicycle or pedestrian system improvements will not show any impact from the modeling procedure if the models ignore these types of trips. However, It would not be correct to conclude that pedestrian or bicycle improvements are ineffective. The actual impact is unknown. Therefore it is critical that the assumptions used in the modeling process and the model limitations be explicitly stated and considered before decisions are made. Transportation modeling finds the least-cost means of shipping supplies from several origins to several destinations. Origin points (or sources) can be factories, warehouses, car rental agencies like Adams, or any other points from which goods are shipped. Destinations are any points that receive goods. Transportation modeling Print to PDF without this message by purchasing novaPDF (http://www.novapdf.com/)
  • 3. ANGELA UYI 08054802925 3 An iterative procedure for solving problems that involves minimizing the cost of shipping products from a series of sources to a series of destinations. Nonetheless, the major assumptions of the transportation model are the following: 1. Items are homogeneous 2. Shipping cost per unit is the same no matter how many units are shipped 3. Only one route is used from place of shipment to the destination The transportation model is actually a class of the linear programming models. As it is for linear programming, software is available to solve transportation problems. To fully use such programs, though, you need to understand the assumptions that underlie the model. To illustrate one transportation problem, in this module we look at a company called Adams Plumbing works Ltd. Plumbing, which makes, among other products, a full line of bathtubs. In our example, the firm must decide which of its factories should supply which of its warehouses. Relevant data for Adams Plumbing works Limited are presented in Table C.1 and Figure C.1. Table C.1 shows, for example, that it costs Adams Plumbing works Ltd. N5 to ship one bathtub from its Delta factory to its Adamawa warehouse, N4 to Benin, and N3 to Calabar. Likewise, we see in Figure C.1 TABLE C.1 Transportation Costs per Bathtub for Adams Plumbing works Ltd To From Adamawa Benin Calabar Des Moines N5 N4 N3 Evansville N8 N4 N3 Fort Lauderdale N9 N7 N5 Print to PDF without this message by purchasing novaPDF (http://www.novapdf.com/)
  • 4. ANGELA UYI 08054802925 4 that the 300 units required by Adams Plumbing works Ltd Adamawa warehouse may be shipped in various combinations from its Delta, Enugu, and F.C.T factories. The first step in the modeling process is to set up a transportation matrix. Its purpose is to summarize all relevant data and to keep track of algorithm computations. Using the information displayed in Figure C.1 and Table C.1, we can construct a transportation matrix as shown in Figure C.2. TO From (A) ABIA (B) BENIN (C) CALABAR FACTORY CAPACITY (D) DELTA 100 N5 N4 N3 100 (E) ENUGU 200 N8 N4 N3 300 (F) FCT 300 100 200 300 F.C.T 300 units required DELTA 100 UNITS ADAMAWA 300 UNITS ENUGU 300 UNITS CALABAR 200 UNITS BENIN 200 UNITS REQUIRED FIGURE C.1 Transportation Problem Delta capacity constraint Cell representing a possible source to destination shipping assignment (Enugu FIGURE C.2 _ Transportation Matrix for Adams Plumbing works Print to PDF without this message by purchasing novaPDF (http://www.novapdf.com/)
  • 5. ANGELA UYI 08054802925 5 N9 N7 N5 Warehouse requirement 300 200 200 700 DEVELOPING AN INITIAL SOLUTION Once the data are arranged in tabular form, we must establish an initial feasible solution to the problem. A number of different methods have been developed for this step. We now discuss two of them, the northwest-corner rule and the intuitive lowest-cost method. The Northwest-Corner Rule The northwest-corner rule requires that we start in the upper left-hand cell (or northwest corner) of the table and allocate units to shipping routes as follows: 1. Exhaust the supply (factory capacity) of each row (e.g., Delta: 100) before moving down to the next row. 2. Exhaust the (warehouse) requirements of each column (e.g., Adamawa: 300) before moving to the next column on the right. 3. Check to ensure that all supplies and demands are met. Example C1 applies the northwest-corner rule to our Arizona Plumbing problem. In Figure C.3 we use the northwest-corner rule to find an initial feasible solution to the Adams Plumbing works Ltd. problem. To make our initial shipping assignments, we need five steps: 1. Assign 100 Buckets from Delta to Adamawa (exhausting Delta’s supply). 2. Assign 200 buckets from Enugu to Adamawa (exhausting Adamawa’s demand). 3. Assign 100 buckets from Enugu to Benin (exhausting Enugu’s supply). 4. Assign 100 buckets from F.C.T to Benin (exhausting Benin’s demand). 5. Assign 200 buckets from F.C.T to Calabar (exhausting Calabar’s demand and F.C.T’s supply). The total cost of this shipping assignment is N4,200 (see Table C.2). TO From (A) ABIA (B) BENIN (C) CALABAR FACTORY CAPACITY (D) DELTA 100 100 Total demand and total supply Calabar warehouse demand Cost of shipping 1 unit fromF.C.Tfactory to Benin warehouse Print to PDF without this message by purchasing novaPDF (http://www.novapdf.com/)
  • 6. ANGELA UYI 08054802925 6 N5 4 3 (E) ENUGU 200 8 4 3 300 (F) FCT 300 9 100 7 200 5 300 Warehouse requirement 300 200 200 700 FIGURE C.3 _ Northwest-Corner Solution to Eleganza manufacturing Problem Means that the firm is shipping 100 Buckets from FCT to Benin TABLE C.2 _ Computed Shipping Cost ROUTE FROM TO BCK SHIPPED COST PER UNIT TOTAL COST D A 100 5 500 E A 200 8 1,600 E B 100 4 400 F B 100 7 700 Print to PDF without this message by purchasing novaPDF (http://www.novapdf.com/)
  • 7. ANGELA UYI 08054802925 7 F C 200 5 1,000 TOTAL: N4,200 The Intuitive Lowest-Cost Method The intuitive method makes initial allocations based on lowest cost. This straightforward approach uses the following steps: 1. Identify the cell with the lowest cost. Break any ties for the lowest cost arbitrarily. 2. Allocate as many units as possible to that cell without exceeding the supply or demand. Then cross out that row or column (or both) that is exhausted by this assignment. 3. Find the cell with the lowest cost from the remaining (not crossed out) cells. 4. Repeat steps 2 and 3 until all units have been allocated. TO From (A) ABIA (B) BENIN (C) CALABAR FACTORY CAPACITY (D) DELTA N5 4 100 3 100 (E) ENUGU 8 200 4 100 3 300 Third, cross out row E and column B after Entering 200 units in this N4 cell because Second, cross out column C after entering 100 units in this N3 cell because column C is satisfied First, cross out top row (D) after entering 100 units in N3 cell because row D is satisfied. Print to PDF without this message by purchasing novaPDF (http://www.novapdf.com/)
  • 8. ANGELA UYI 08054802925 8 (F) FCT N300 9 7 5 300 Warehouse requirement 300 200 200 700 FIGURE C.4 _ Intuitive Lowest-Cost Solution to Arizona Plumbing Problem SPECIAL ISSUES IN MODELING Demand Not Equal to Supply A common situation in real-world problems is the case in which total demand is not equal to total supply. We can easily handle these so-called unbalanced problems with the solution procedures that we have just discussed by introducing dummy sources or dummy destinations. If total supply is greater than total demand, we make demand exactly equal the surplus by creating a dummy destination. Conversely, if total demand is greater than total supply, we introduce a dummy source (factory) with a supply equal to the excess of demand. Because these units will not in fact be shipped, we assign cost coefficients of zero to each square on the dummy location. In each case, then, the cost is zero. Example C5 demonstrates the use of a dummy destination. Degeneracy An occurrence in transportation models in which too few squares or shipping routes are being used, so that tracing a closed path for each unused square becomes impossible. Dummy sources Artificial shipping source points created in the transportation method when total demand is greater than total supply to effect a supply equal to the excess of demand over supply. Dummy destinations Artificial destination points created in the transportation method when the total supply is greater than the total demand; they serve to equalize the total demand and supply. S U M M A R Y The transportation model, a form of linear programming, is used to help find the least-cost solutions to system wide shipping problems. The northwest-corner method (which begins in the upper-left corner of the transportation table) or the intuitive lowest-cost method may be used for finding an initial feasible solution. The stepping-stone algorithm is then used for finding optimal solutions. Unbalanced problems are those in which the total demand and total supply are not equal. Degeneracy refers to the case in which the number of rows + the number of columns _ 1 is not equal to the number of occupied squares. CONCLUSION The transportation problem is one of the most frequently encountered applications in real life situations and is a special type of linear programming problem. The transportation problem Finally, enter 300 units in the only remaining cell to complete the allocations. Print to PDF without this message by purchasing novaPDF (http://www.novapdf.com/)
  • 9. ANGELA UYI 08054802925 9 indicates the amount of consignment to be transported from various origins to different destinations so that the total transportation cost is minimized without violating the availability constraints and the requirement constraints. BIBLIOGRAPHY Drezner, Z. Facility Location: A Survey of Applications and Methods. Secaucus, NJ: Springer-Verlag (1995). Haksever, C., B. Render, and R. Russell. Service Management and Operations, 2nd ed. Upper Saddle River, NJ: Prentice Hall (2000). Koksalan, M., and H. Sural. “Efes Beverage Group Makes Location and Distribution Decisions for Its Malt Plants.” Interfaces 29 (March–April 1999): 89–103. Ping, J., and K. F. Chu. “A Dual-Matrix Approach to the Transportation Problem.” Asia–Pacific Journal of Operations Research 19 (May 2002): 35–46. Render, B., R. M. Stair, and R. Balakrishnan. Managerial Decision Modeling with Spreadsheets. 2nd. ed. Upper Saddle River, NJ: Prentice Hall (2006). Print to PDF without this message by purchasing novaPDF (http://www.novapdf.com/)
  • 10. ANGELA UYI 08054802925 10 Print to PDF without this message by purchasing novaPDF (http://www.novapdf.com/)