Download to read offline
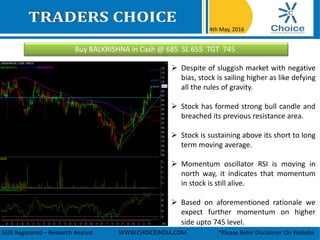
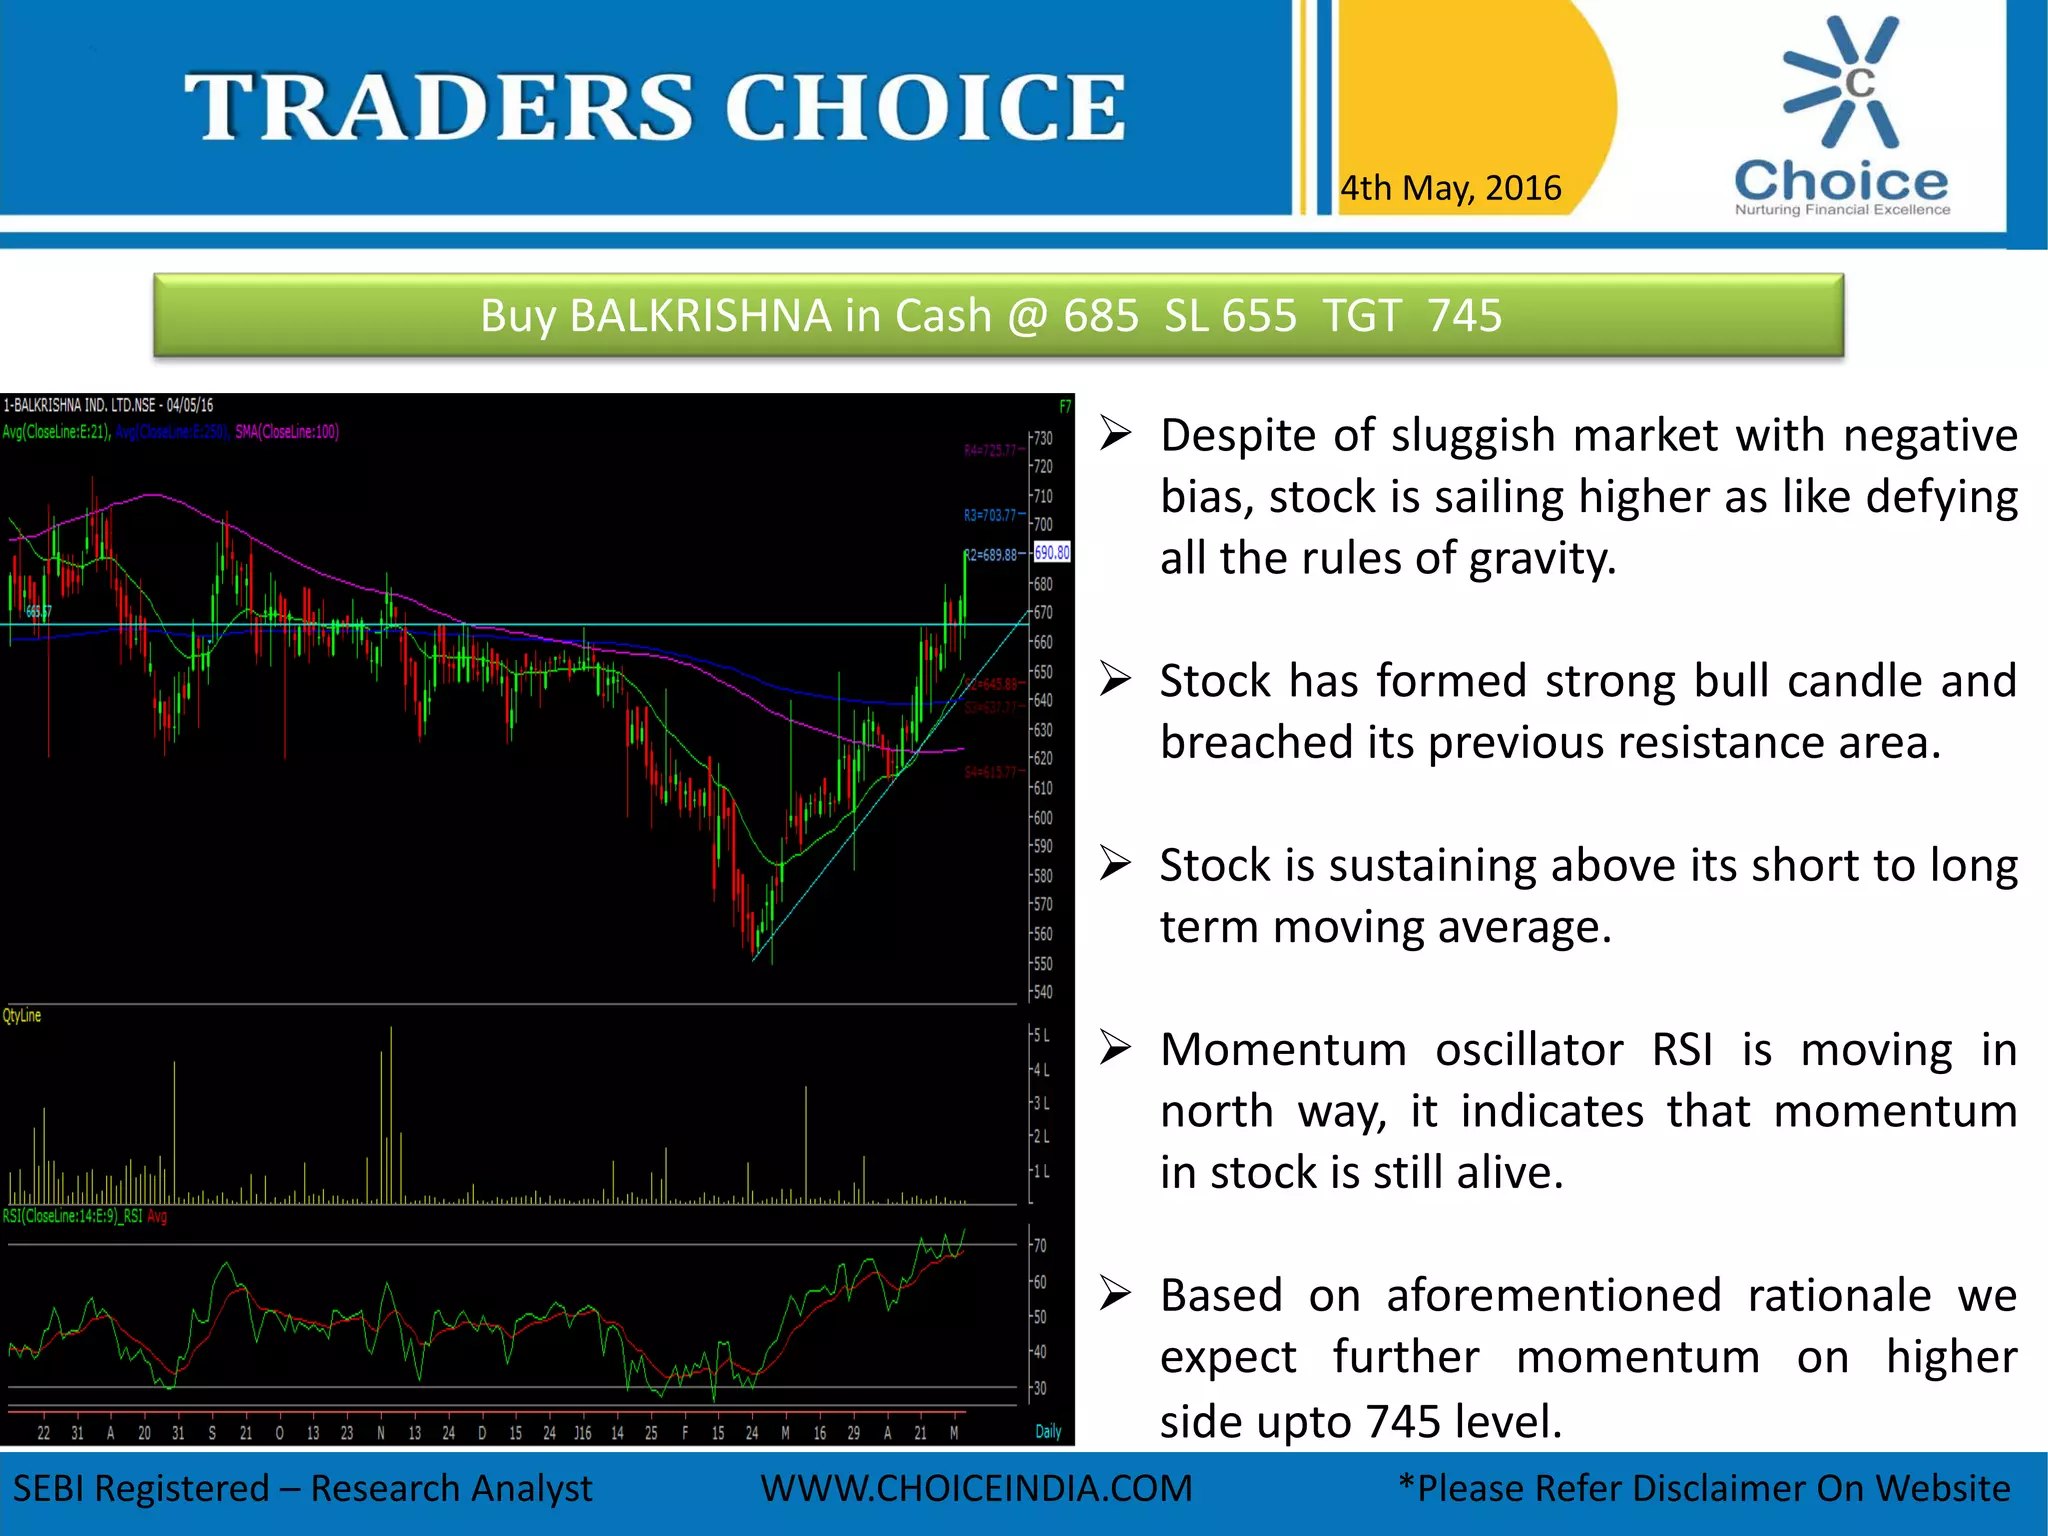


The document provides a bullish recommendation for buying Balkrishna stock at 685 with a stop loss of 655 and a target of 745, highlighting its recent performance amidst a sluggish market. It emphasizes the stock's resilience, positive momentum indicators, and technical analysis findings, while also noting the limitations and disclaimers regarding the information provided. The recommendations are valid for the day of the report and are intended solely for trading purposes.