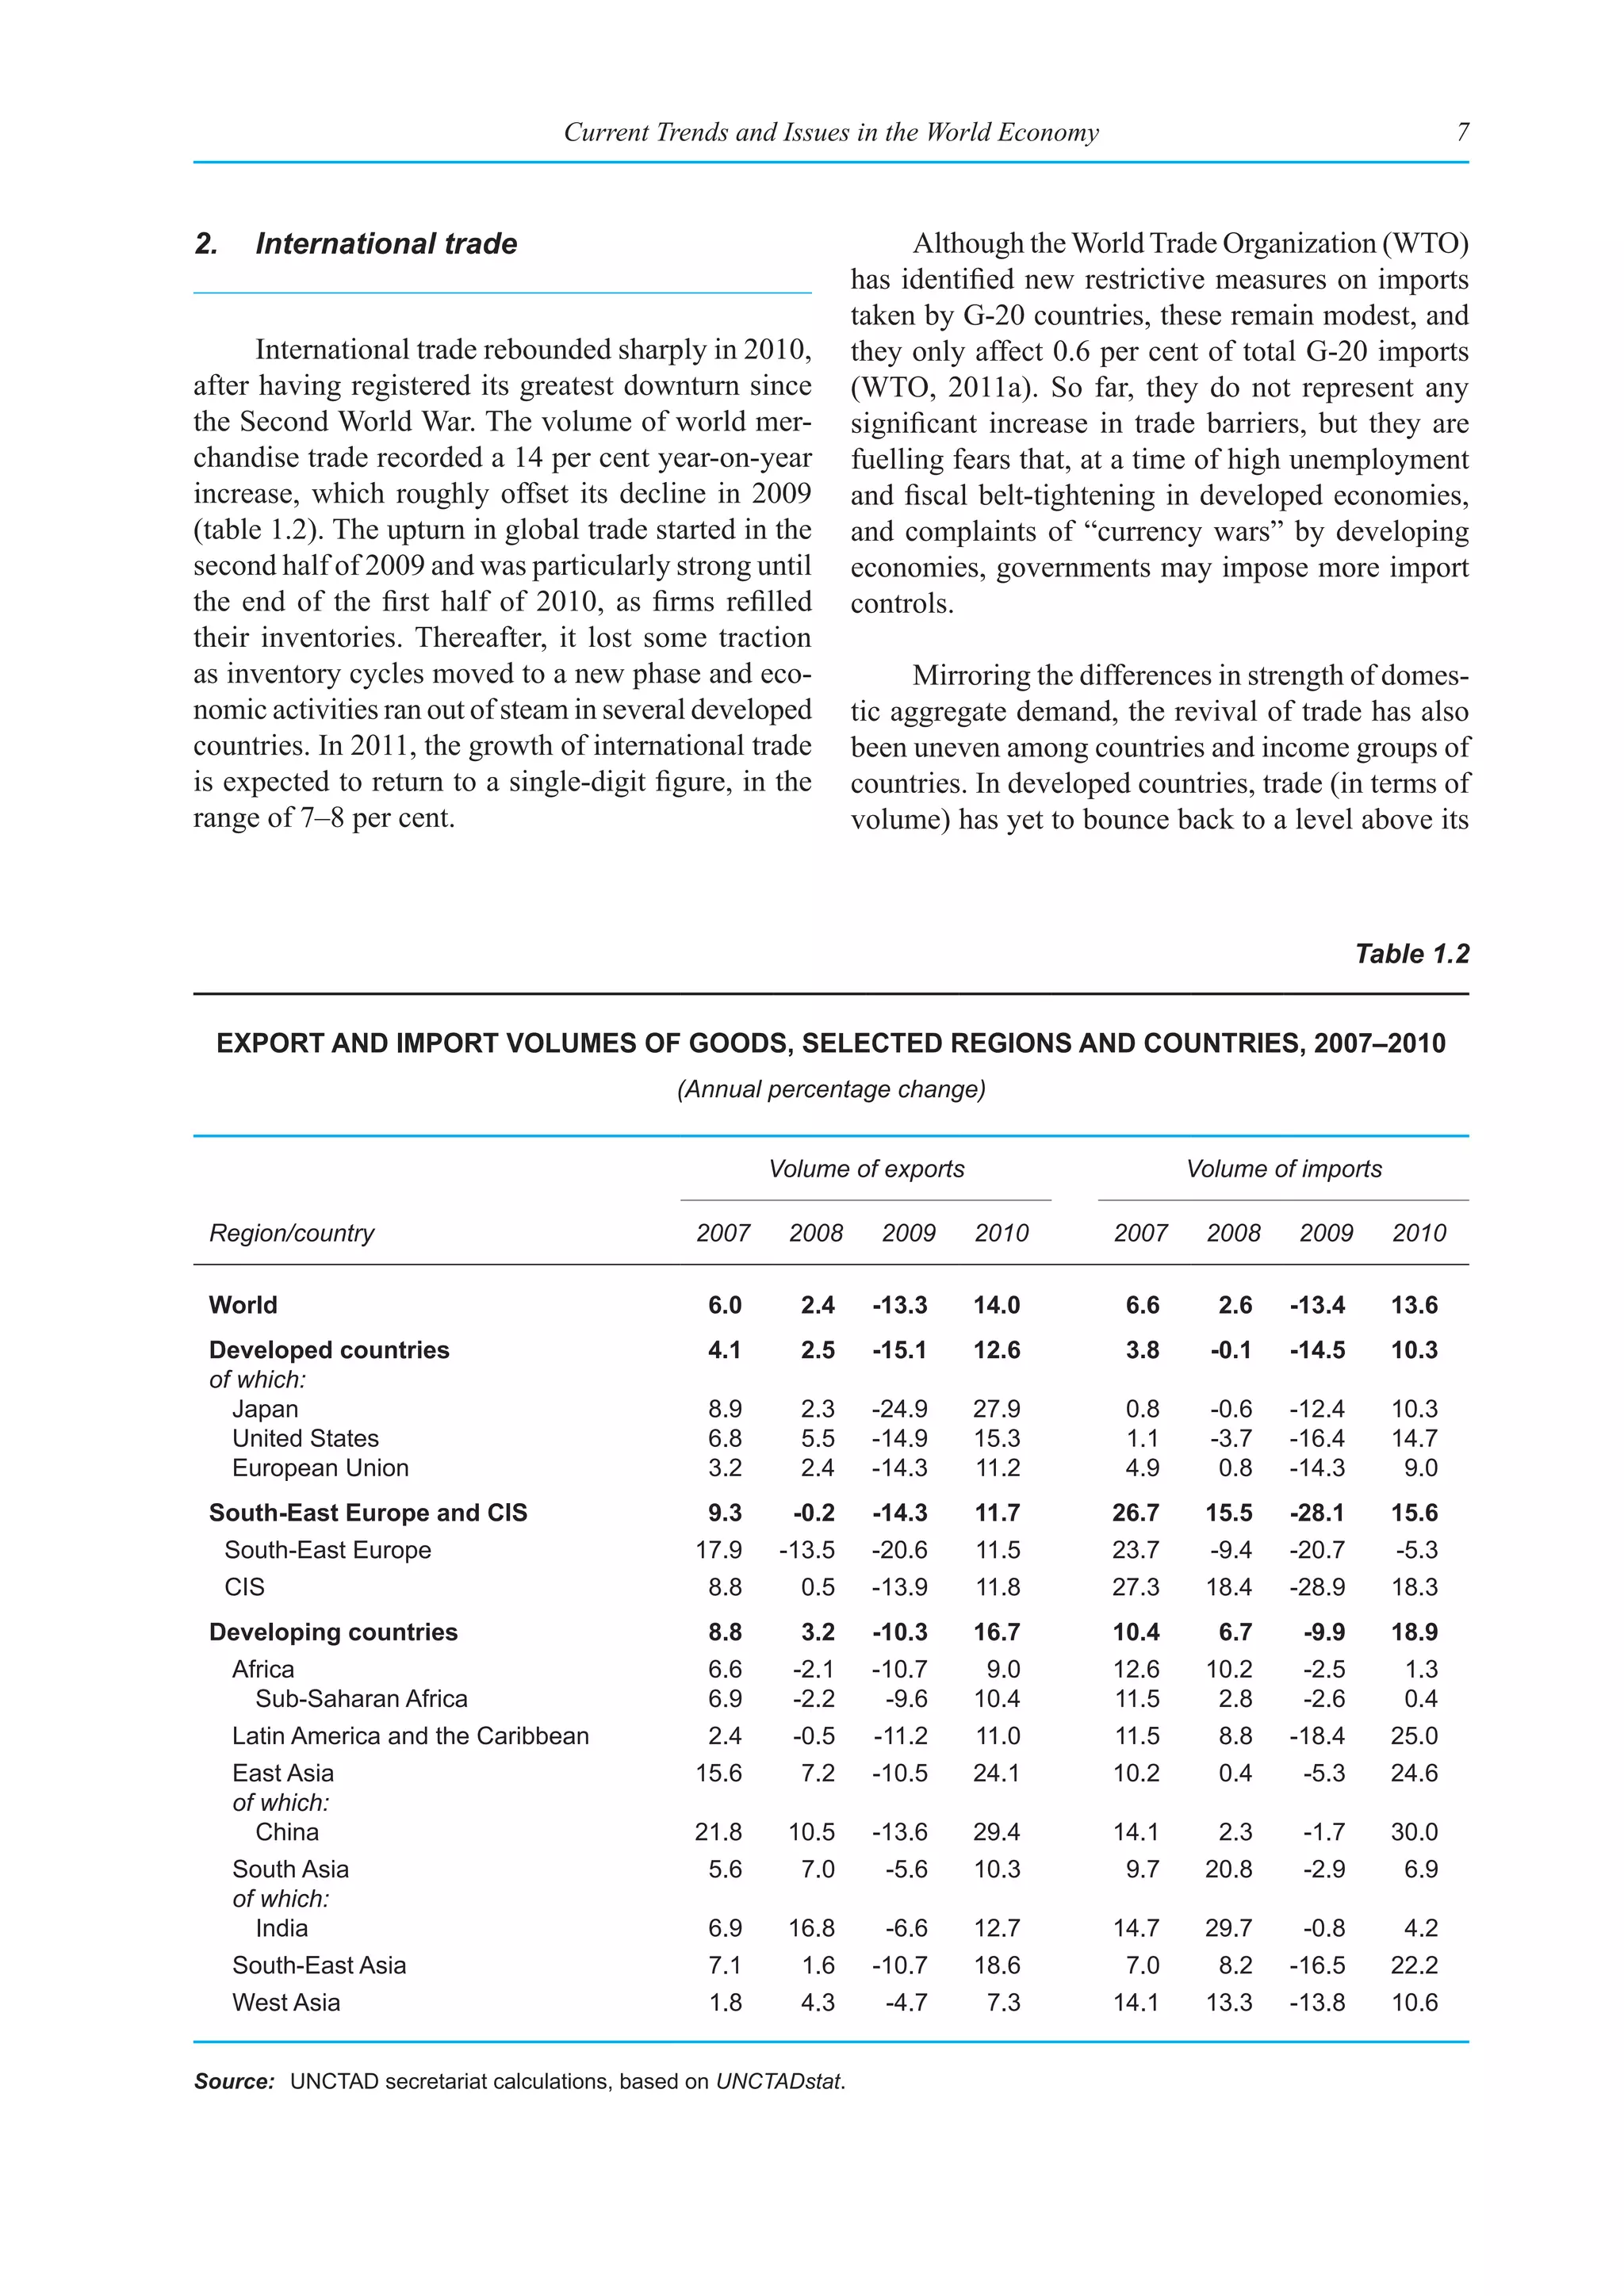
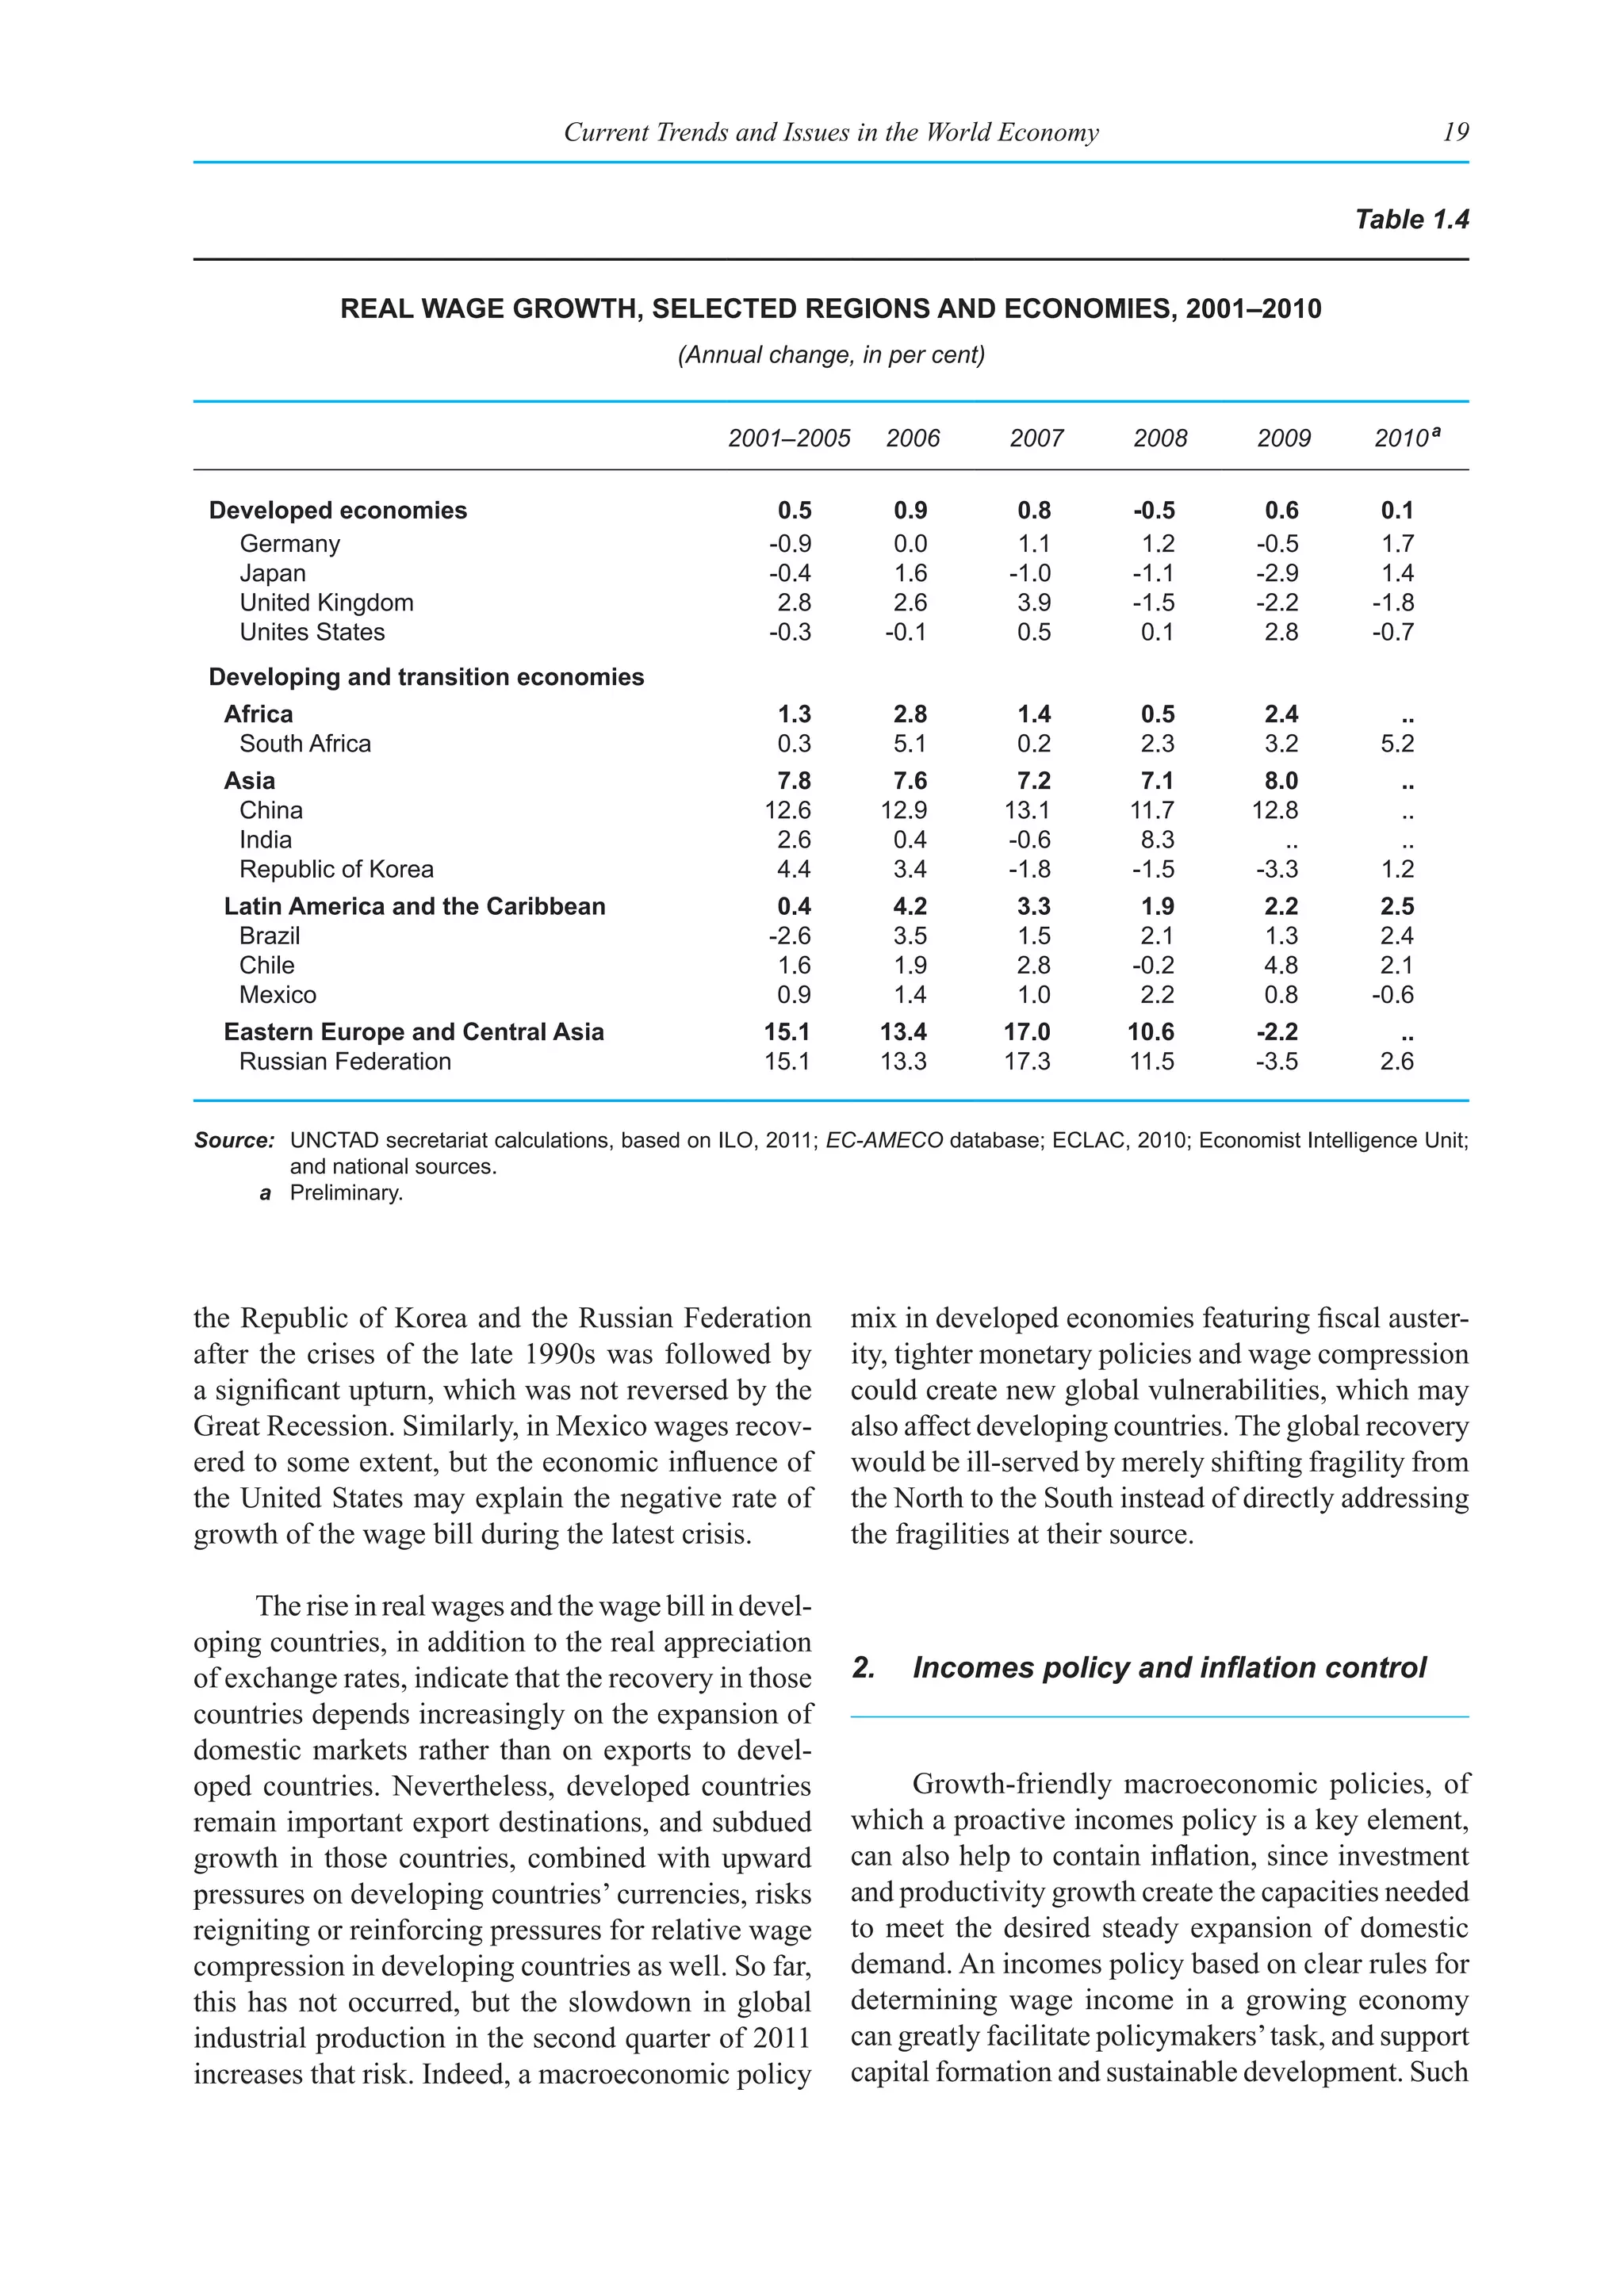
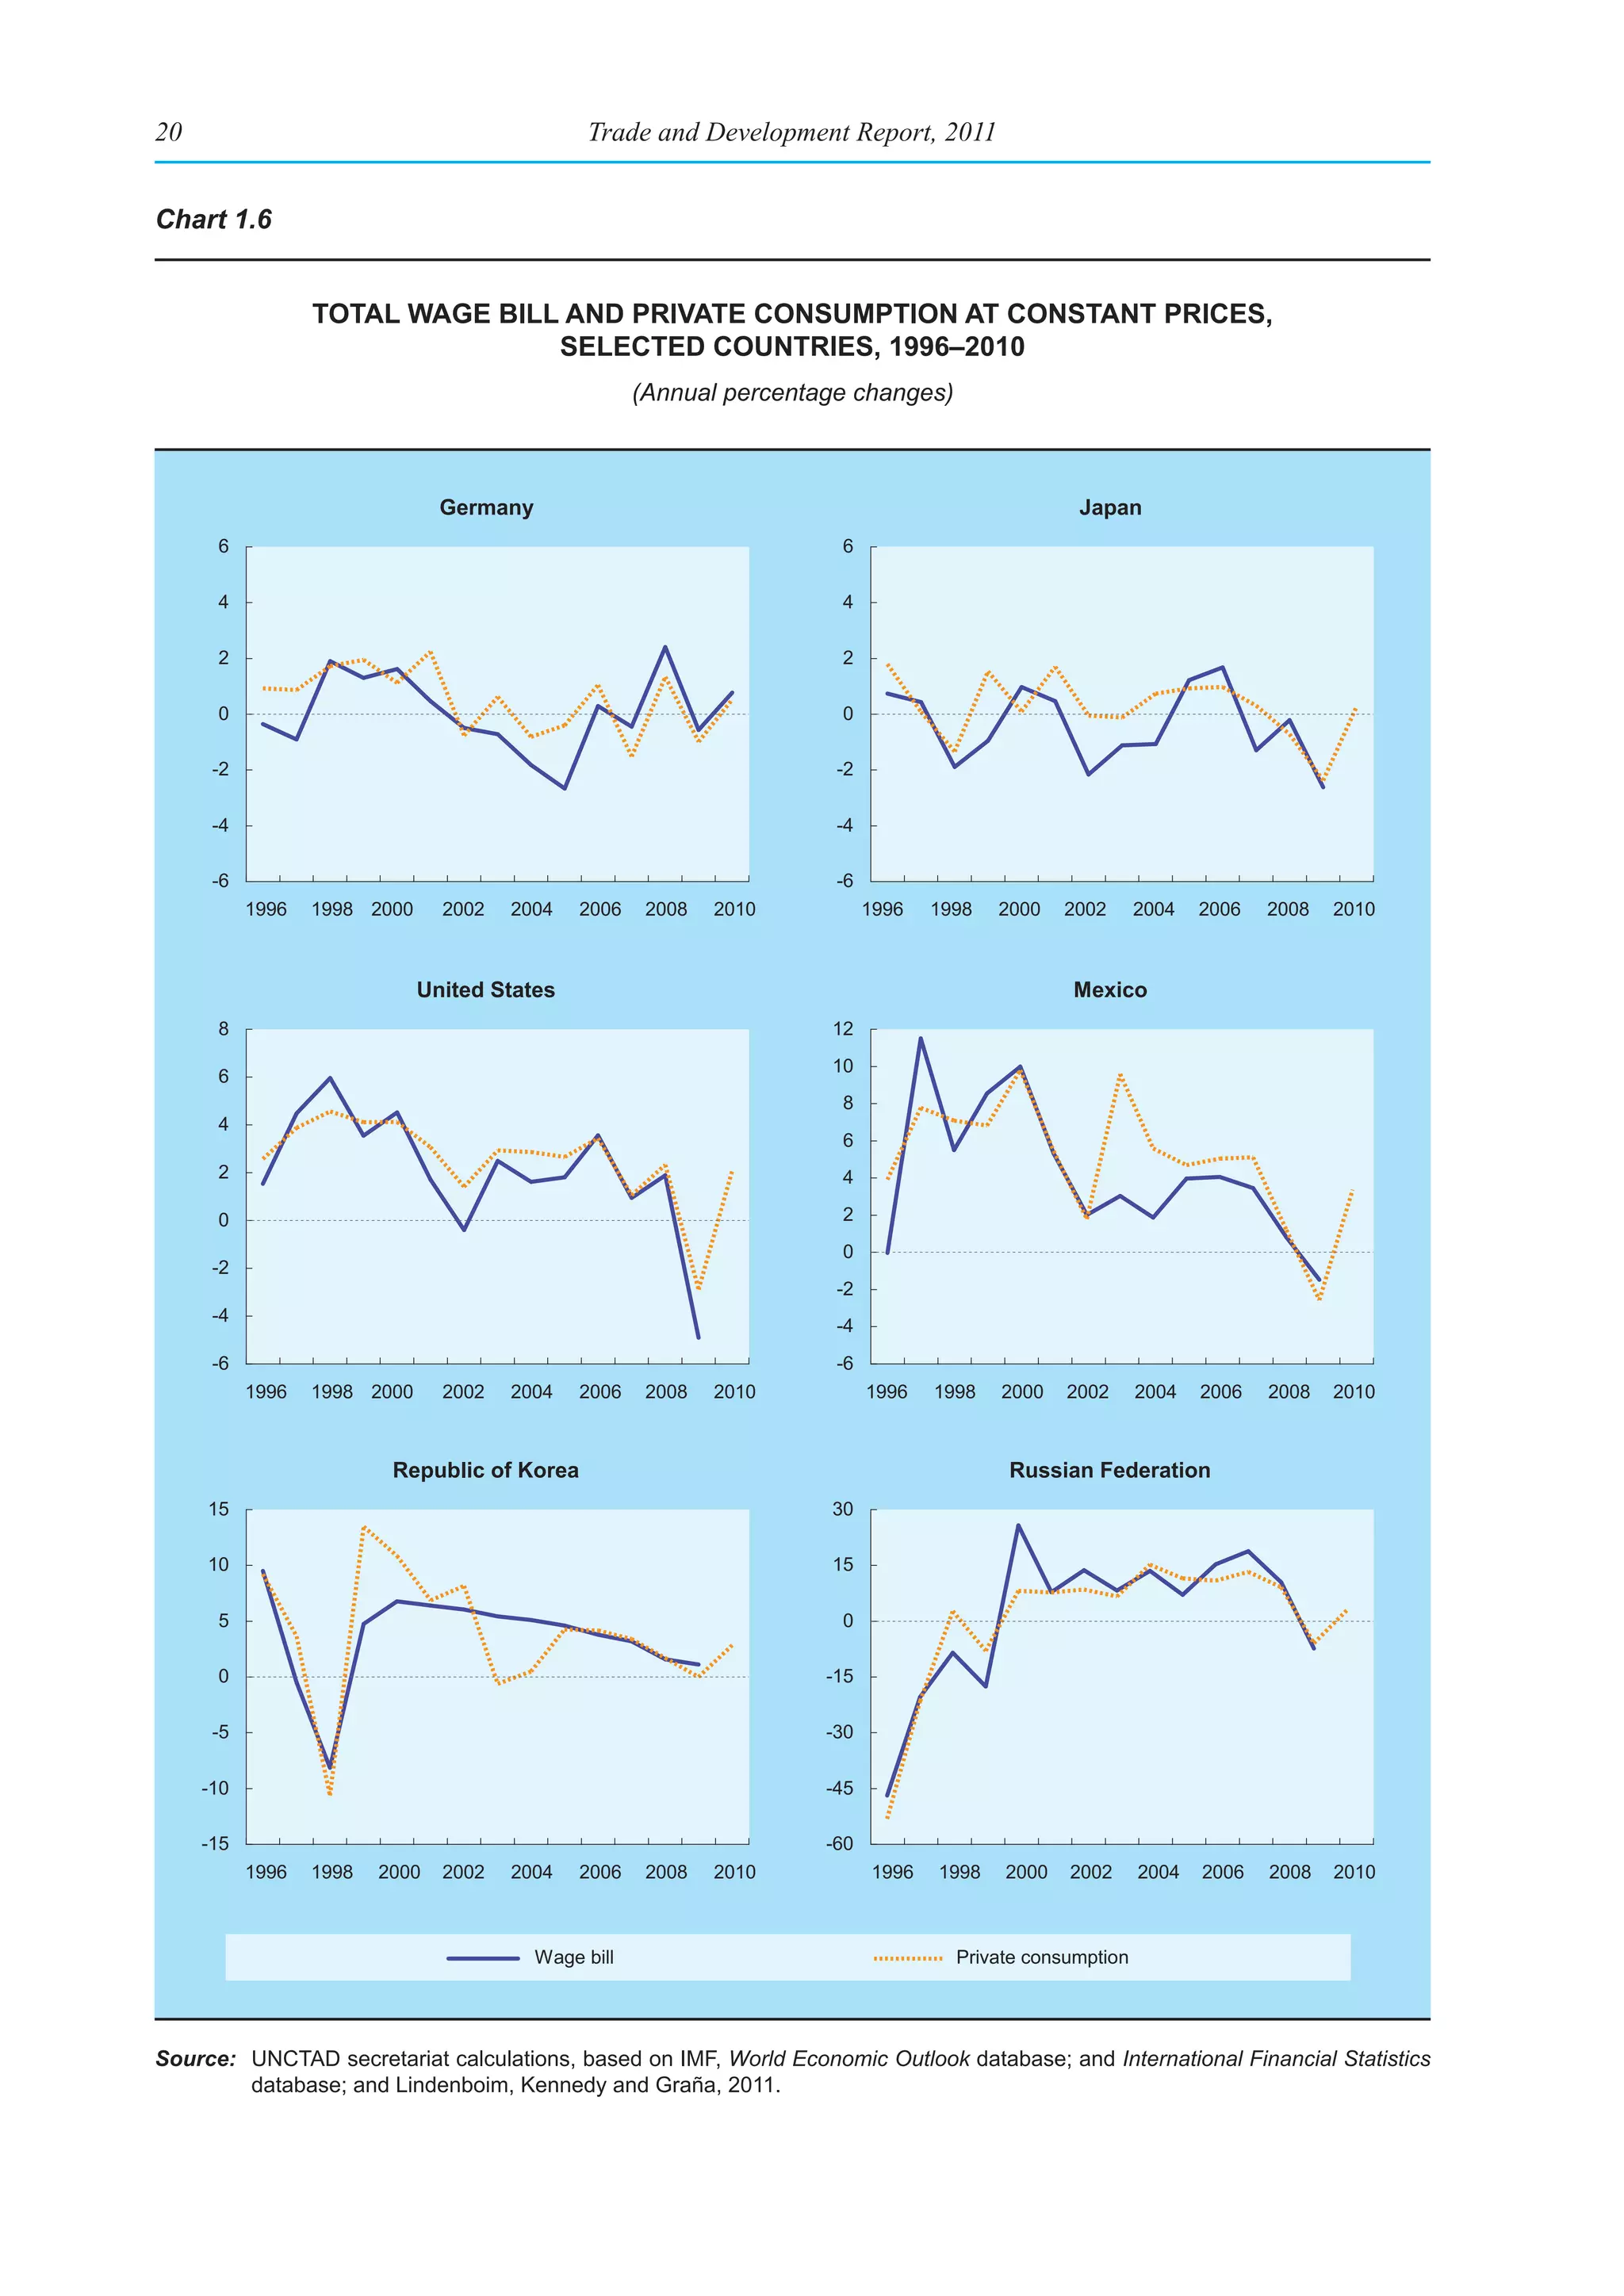
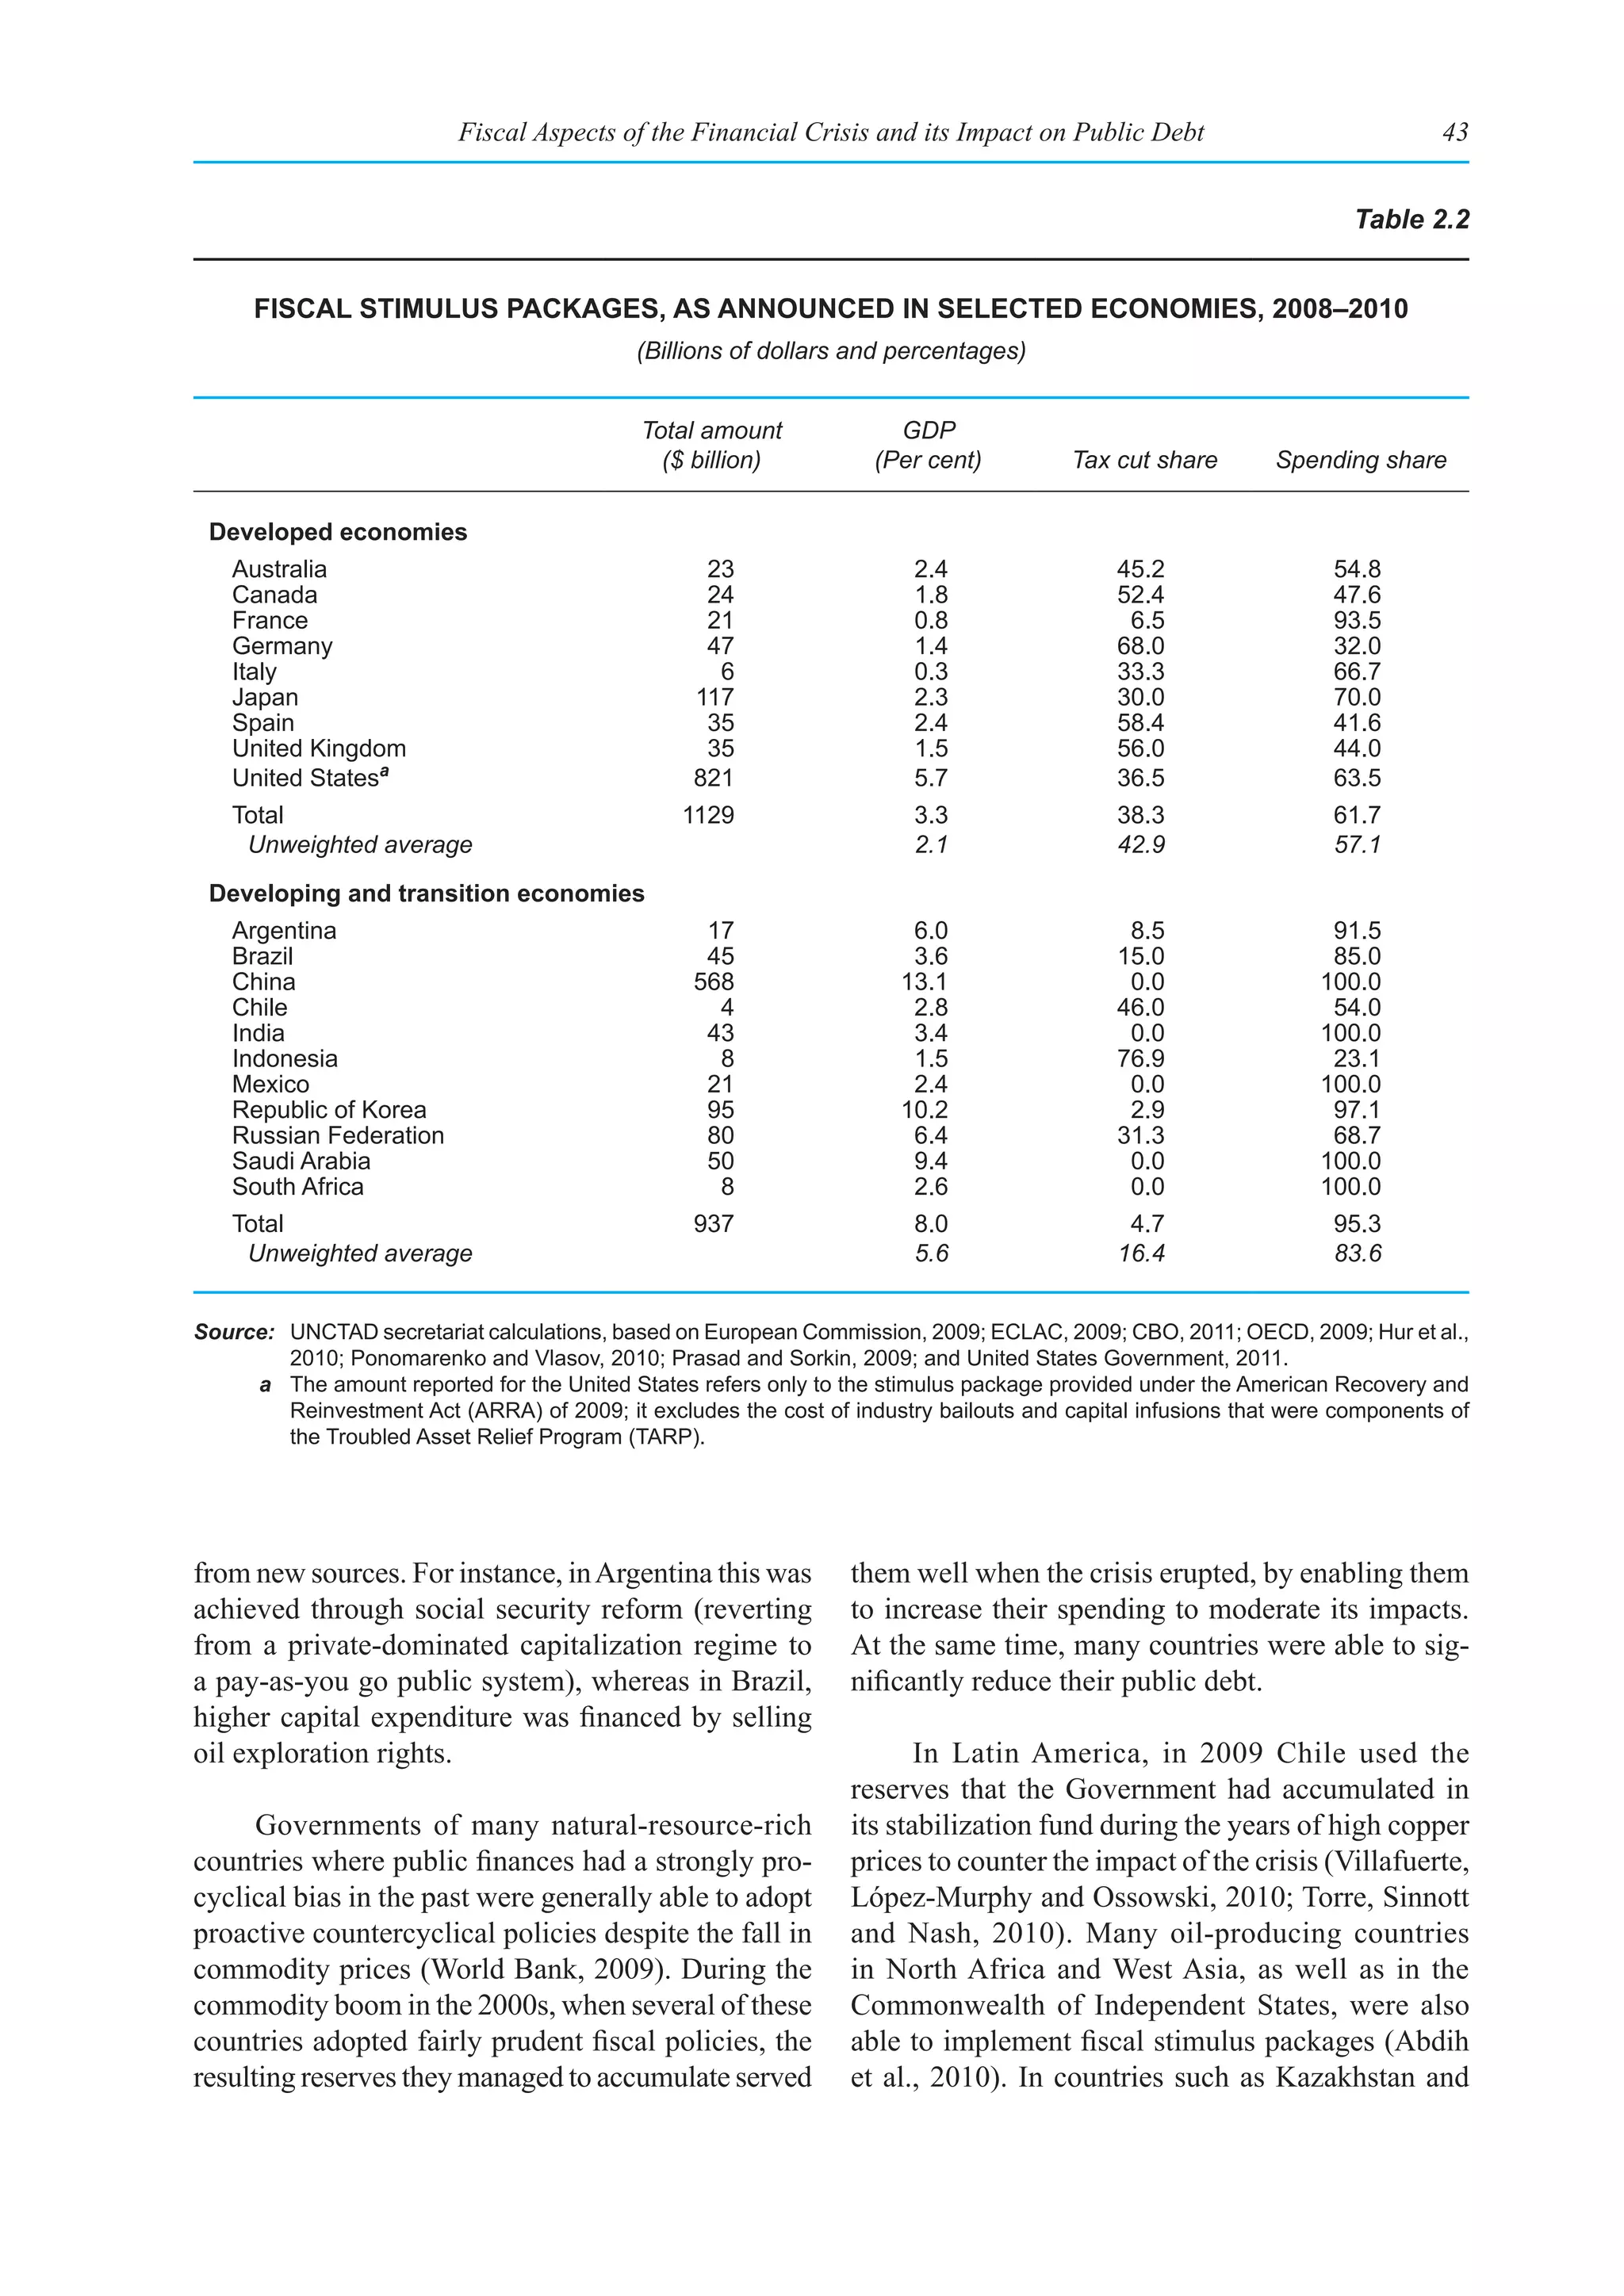
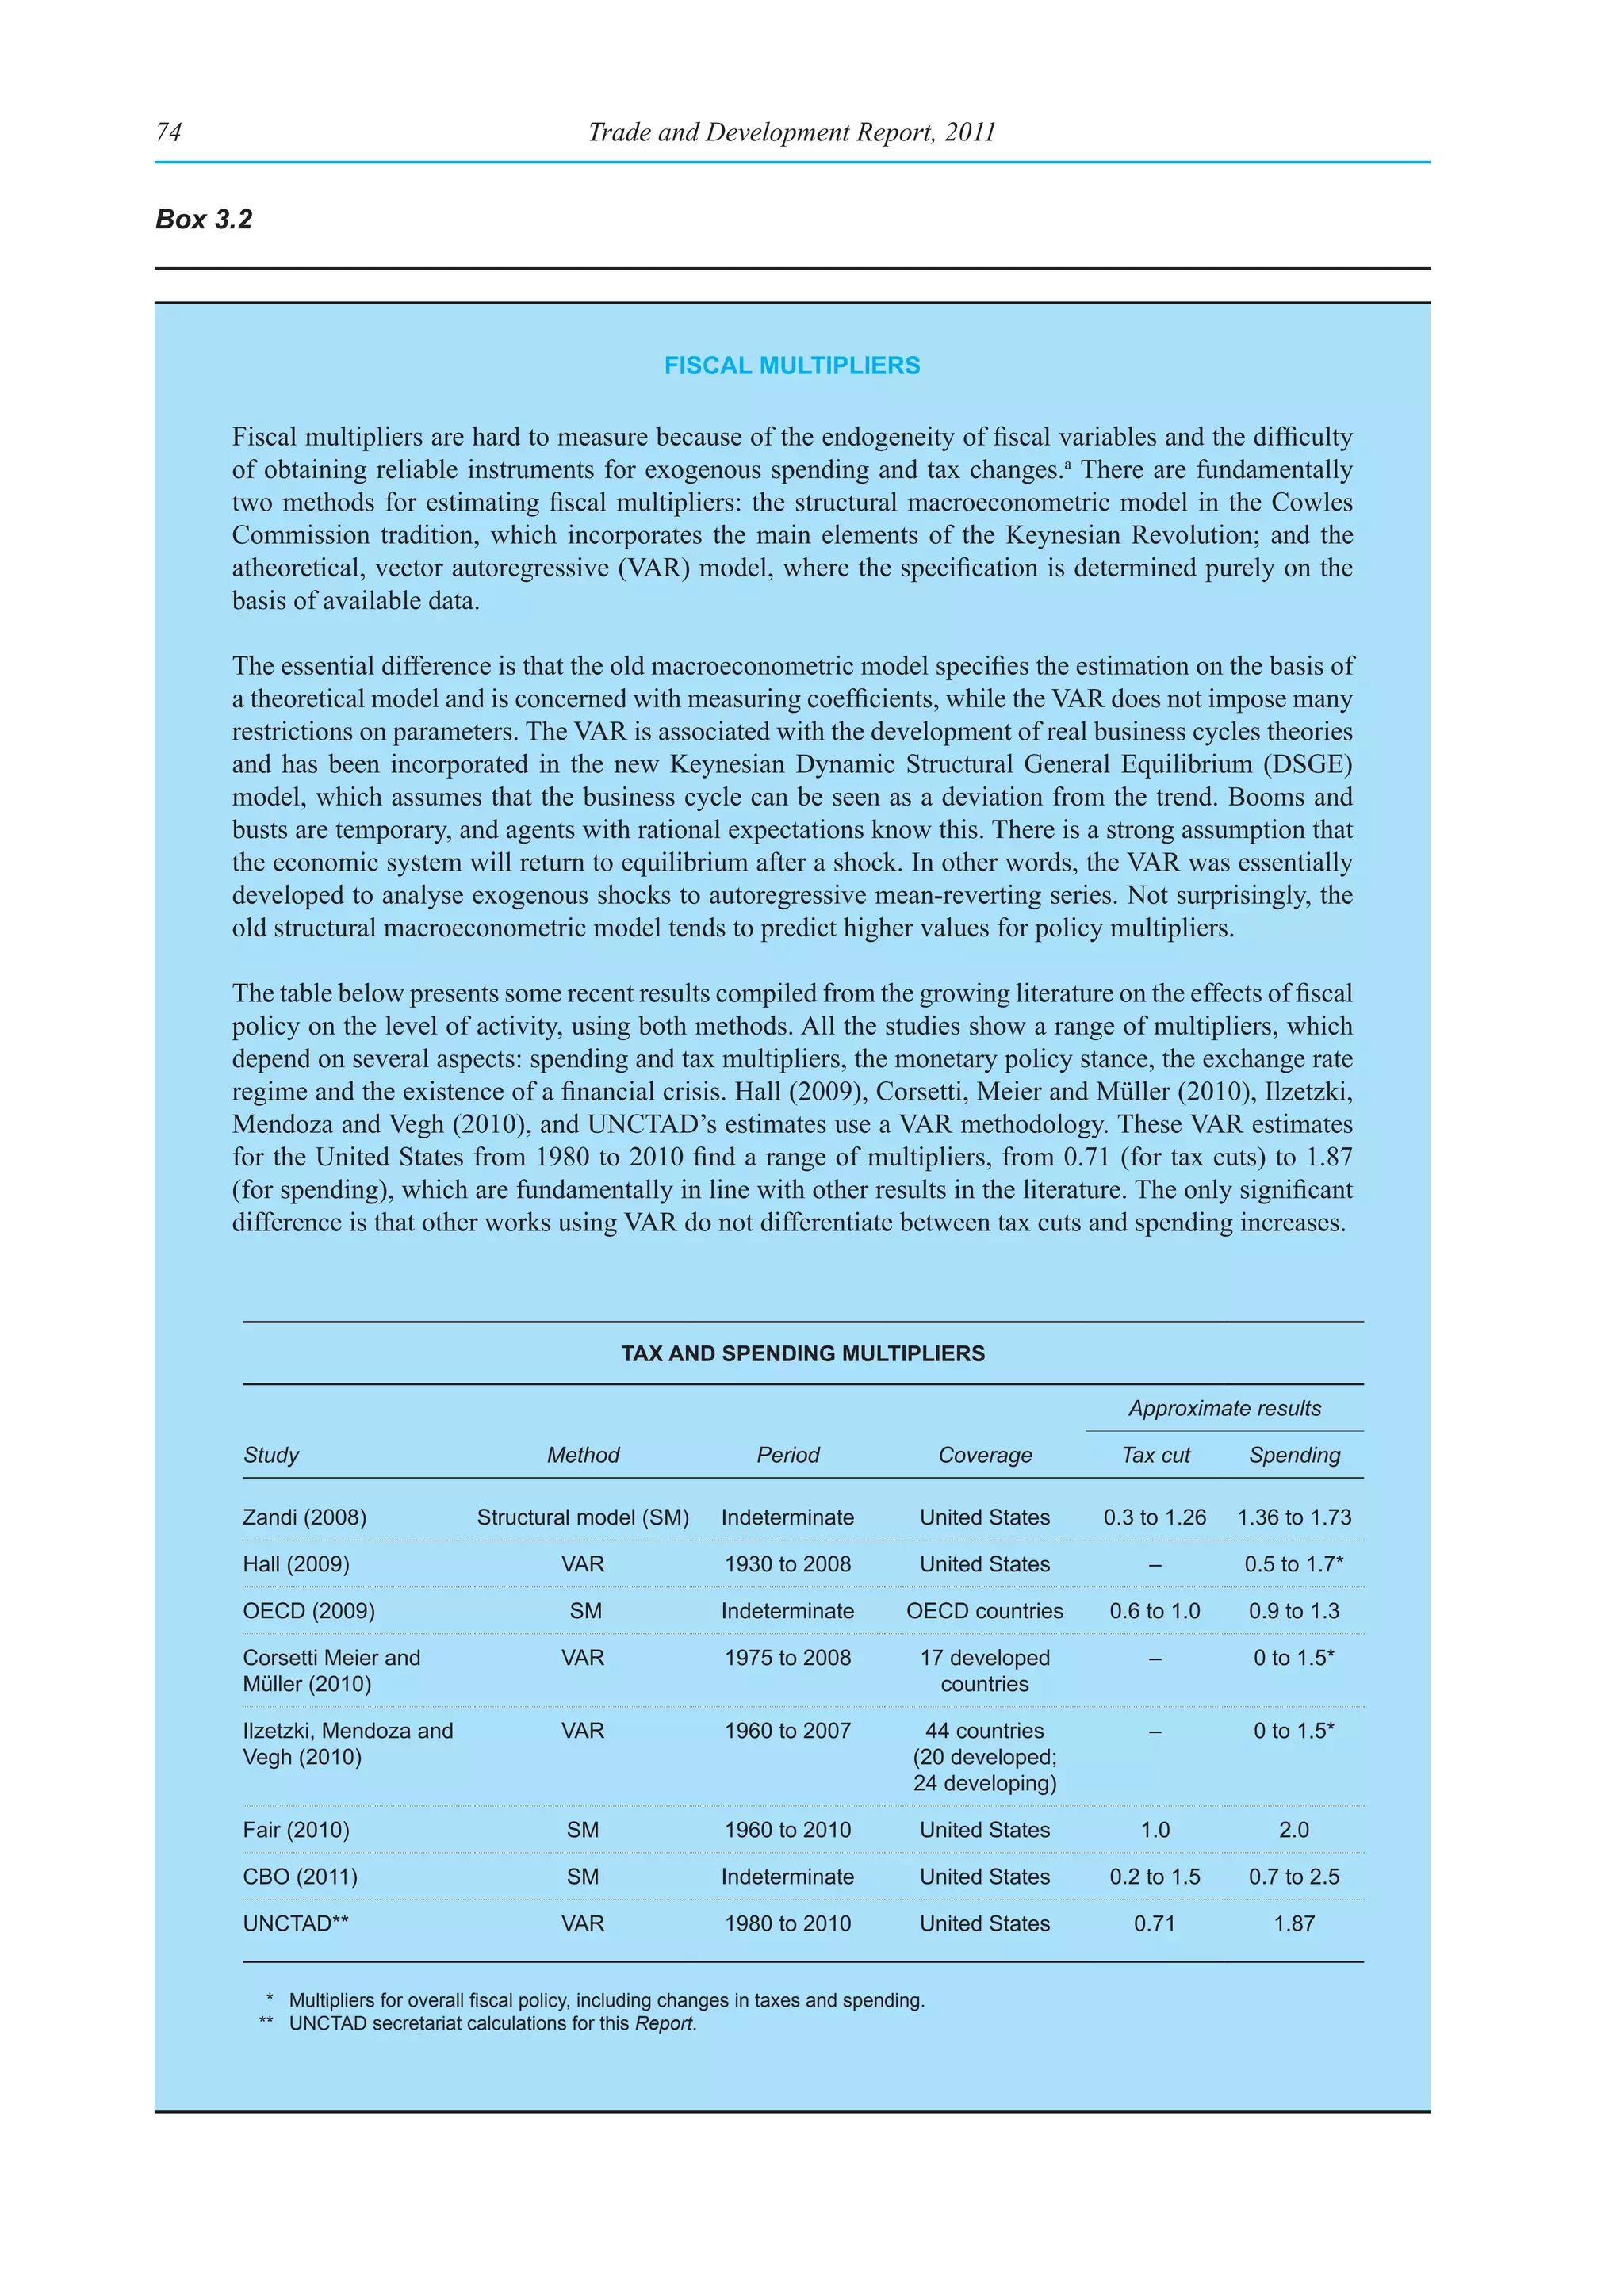
This document is the United Nations Conference on Trade and Development's Trade and Development Report for 2011. It discusses post-crisis policy challenges in the world economy. The report analyzes recent trends in the global economy, including slowing growth, declining international trade, and volatility in commodity markets. It examines issues related to incomes policies and global economic imbalances. Additionally, the report assesses progress toward global cooperation on rebalancing growth and development.


![Current Trends and Issues in the World Economy 3
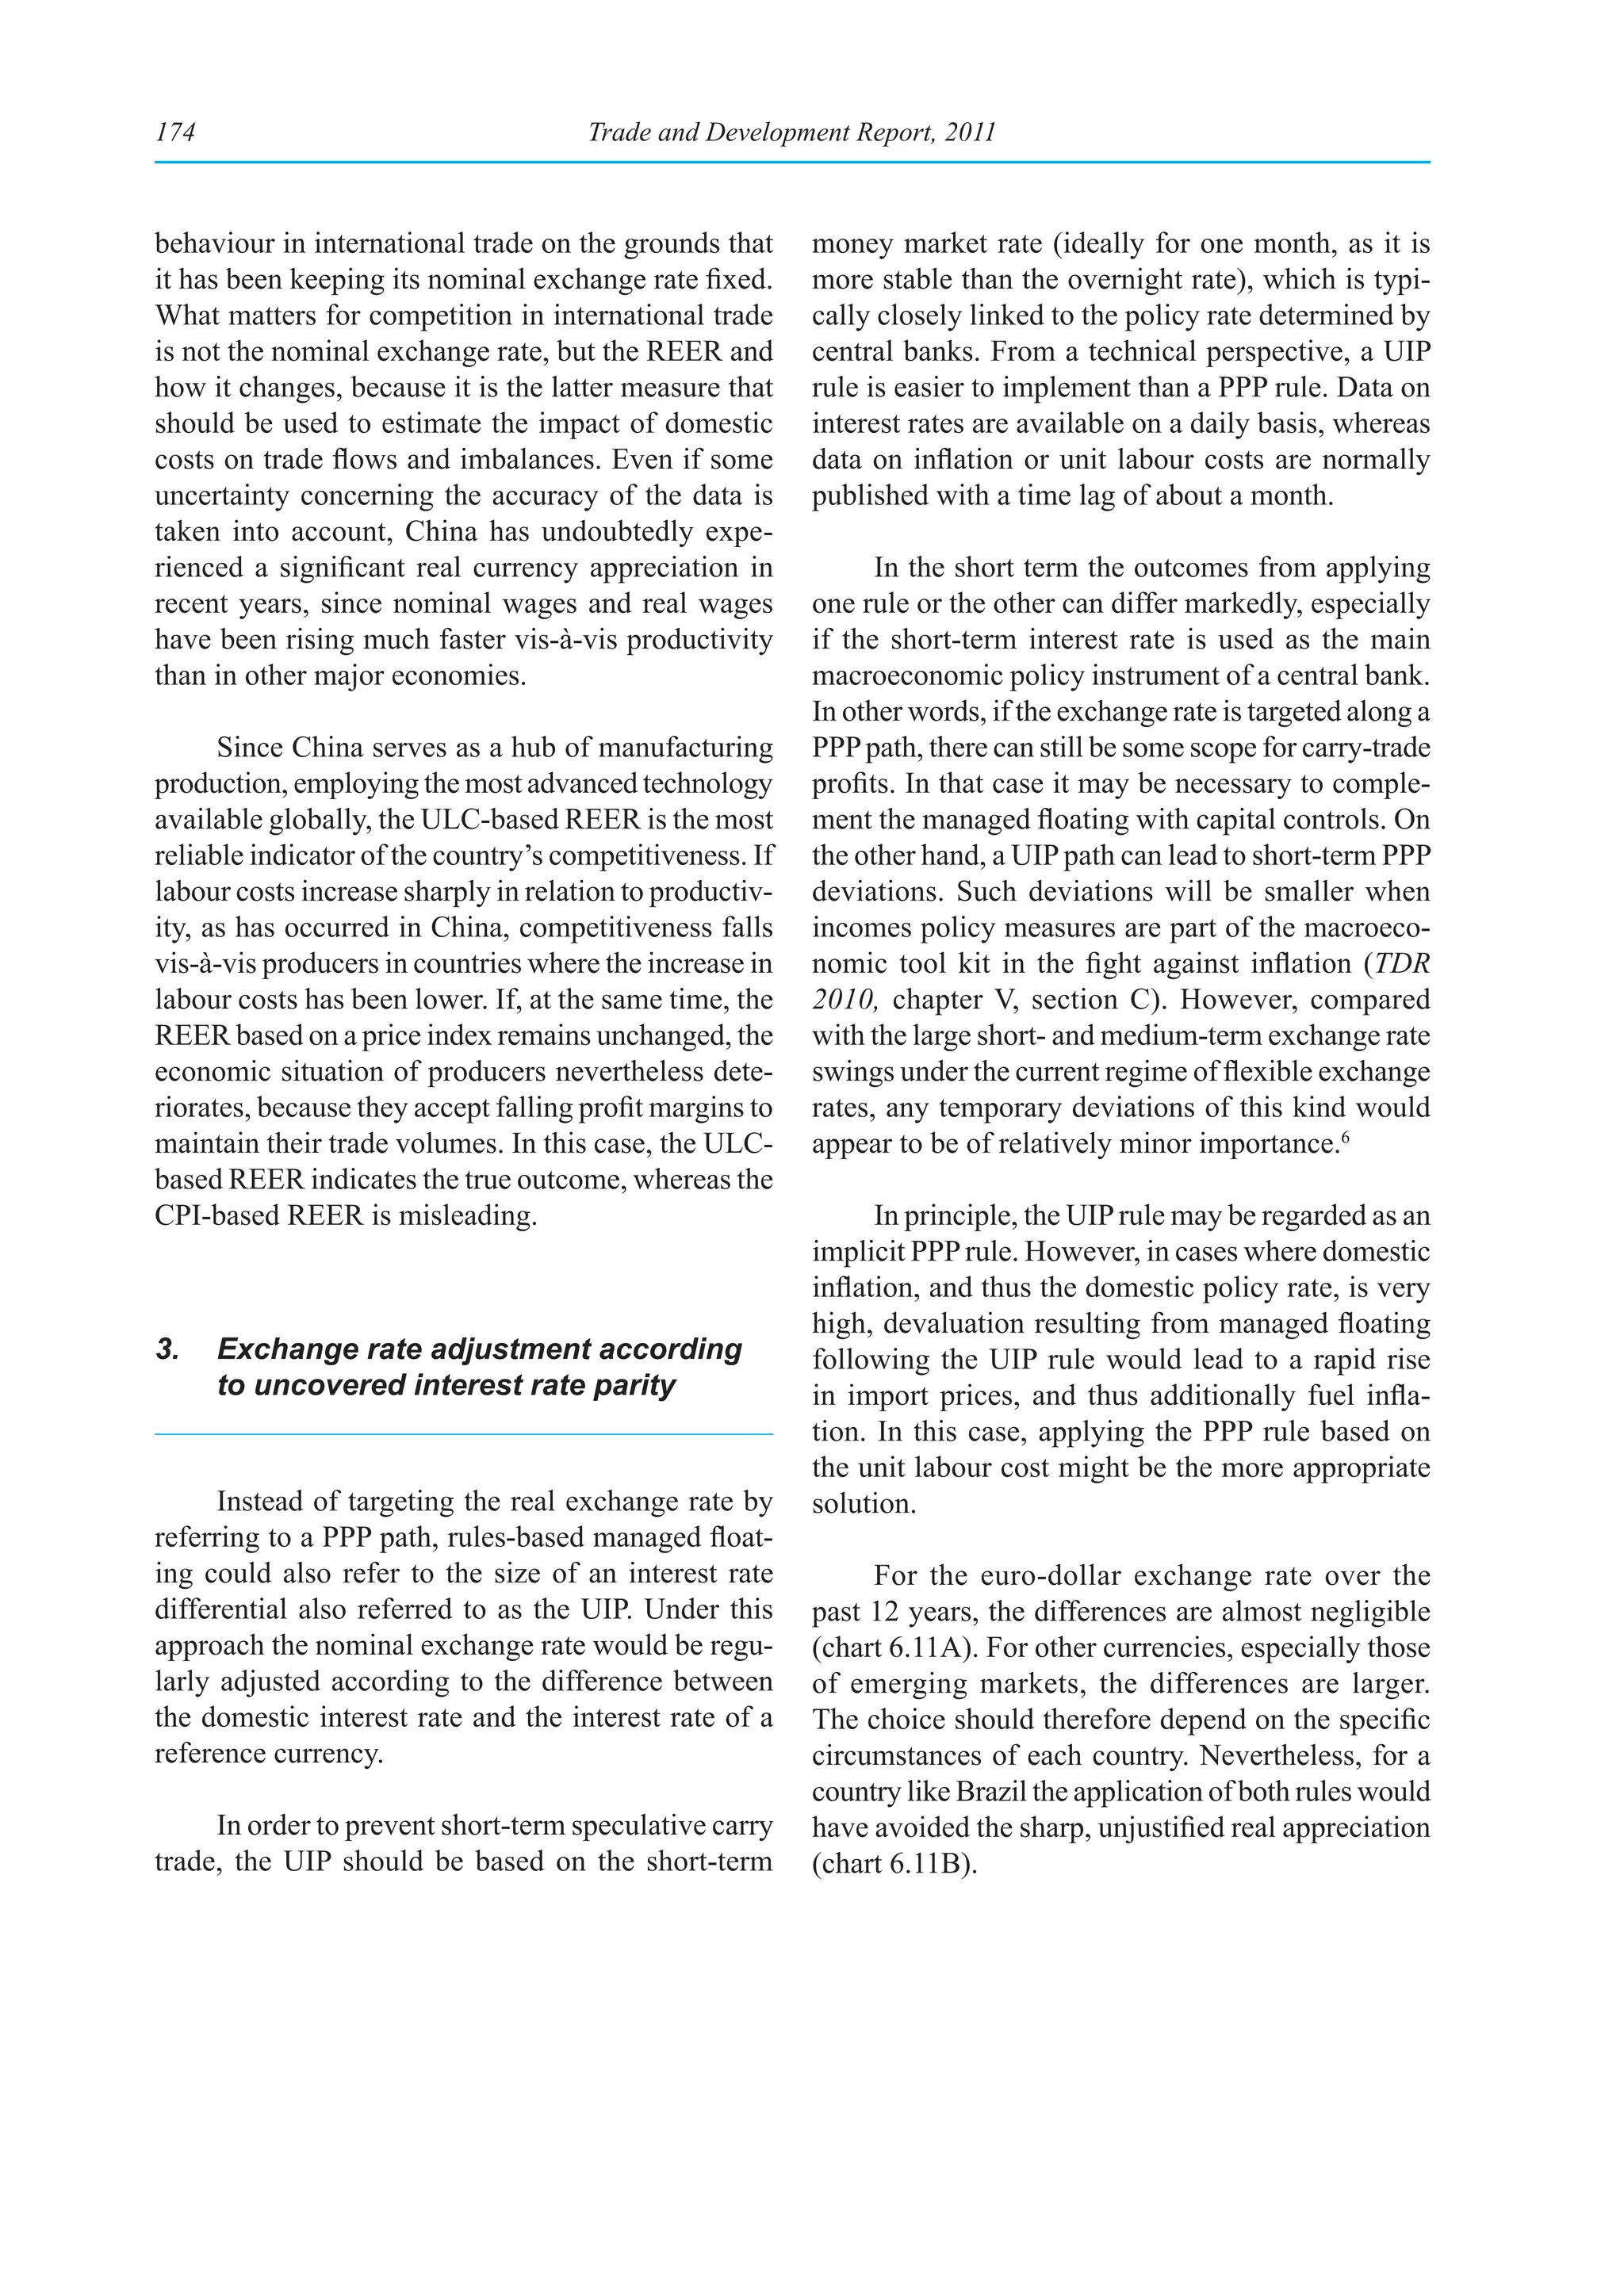
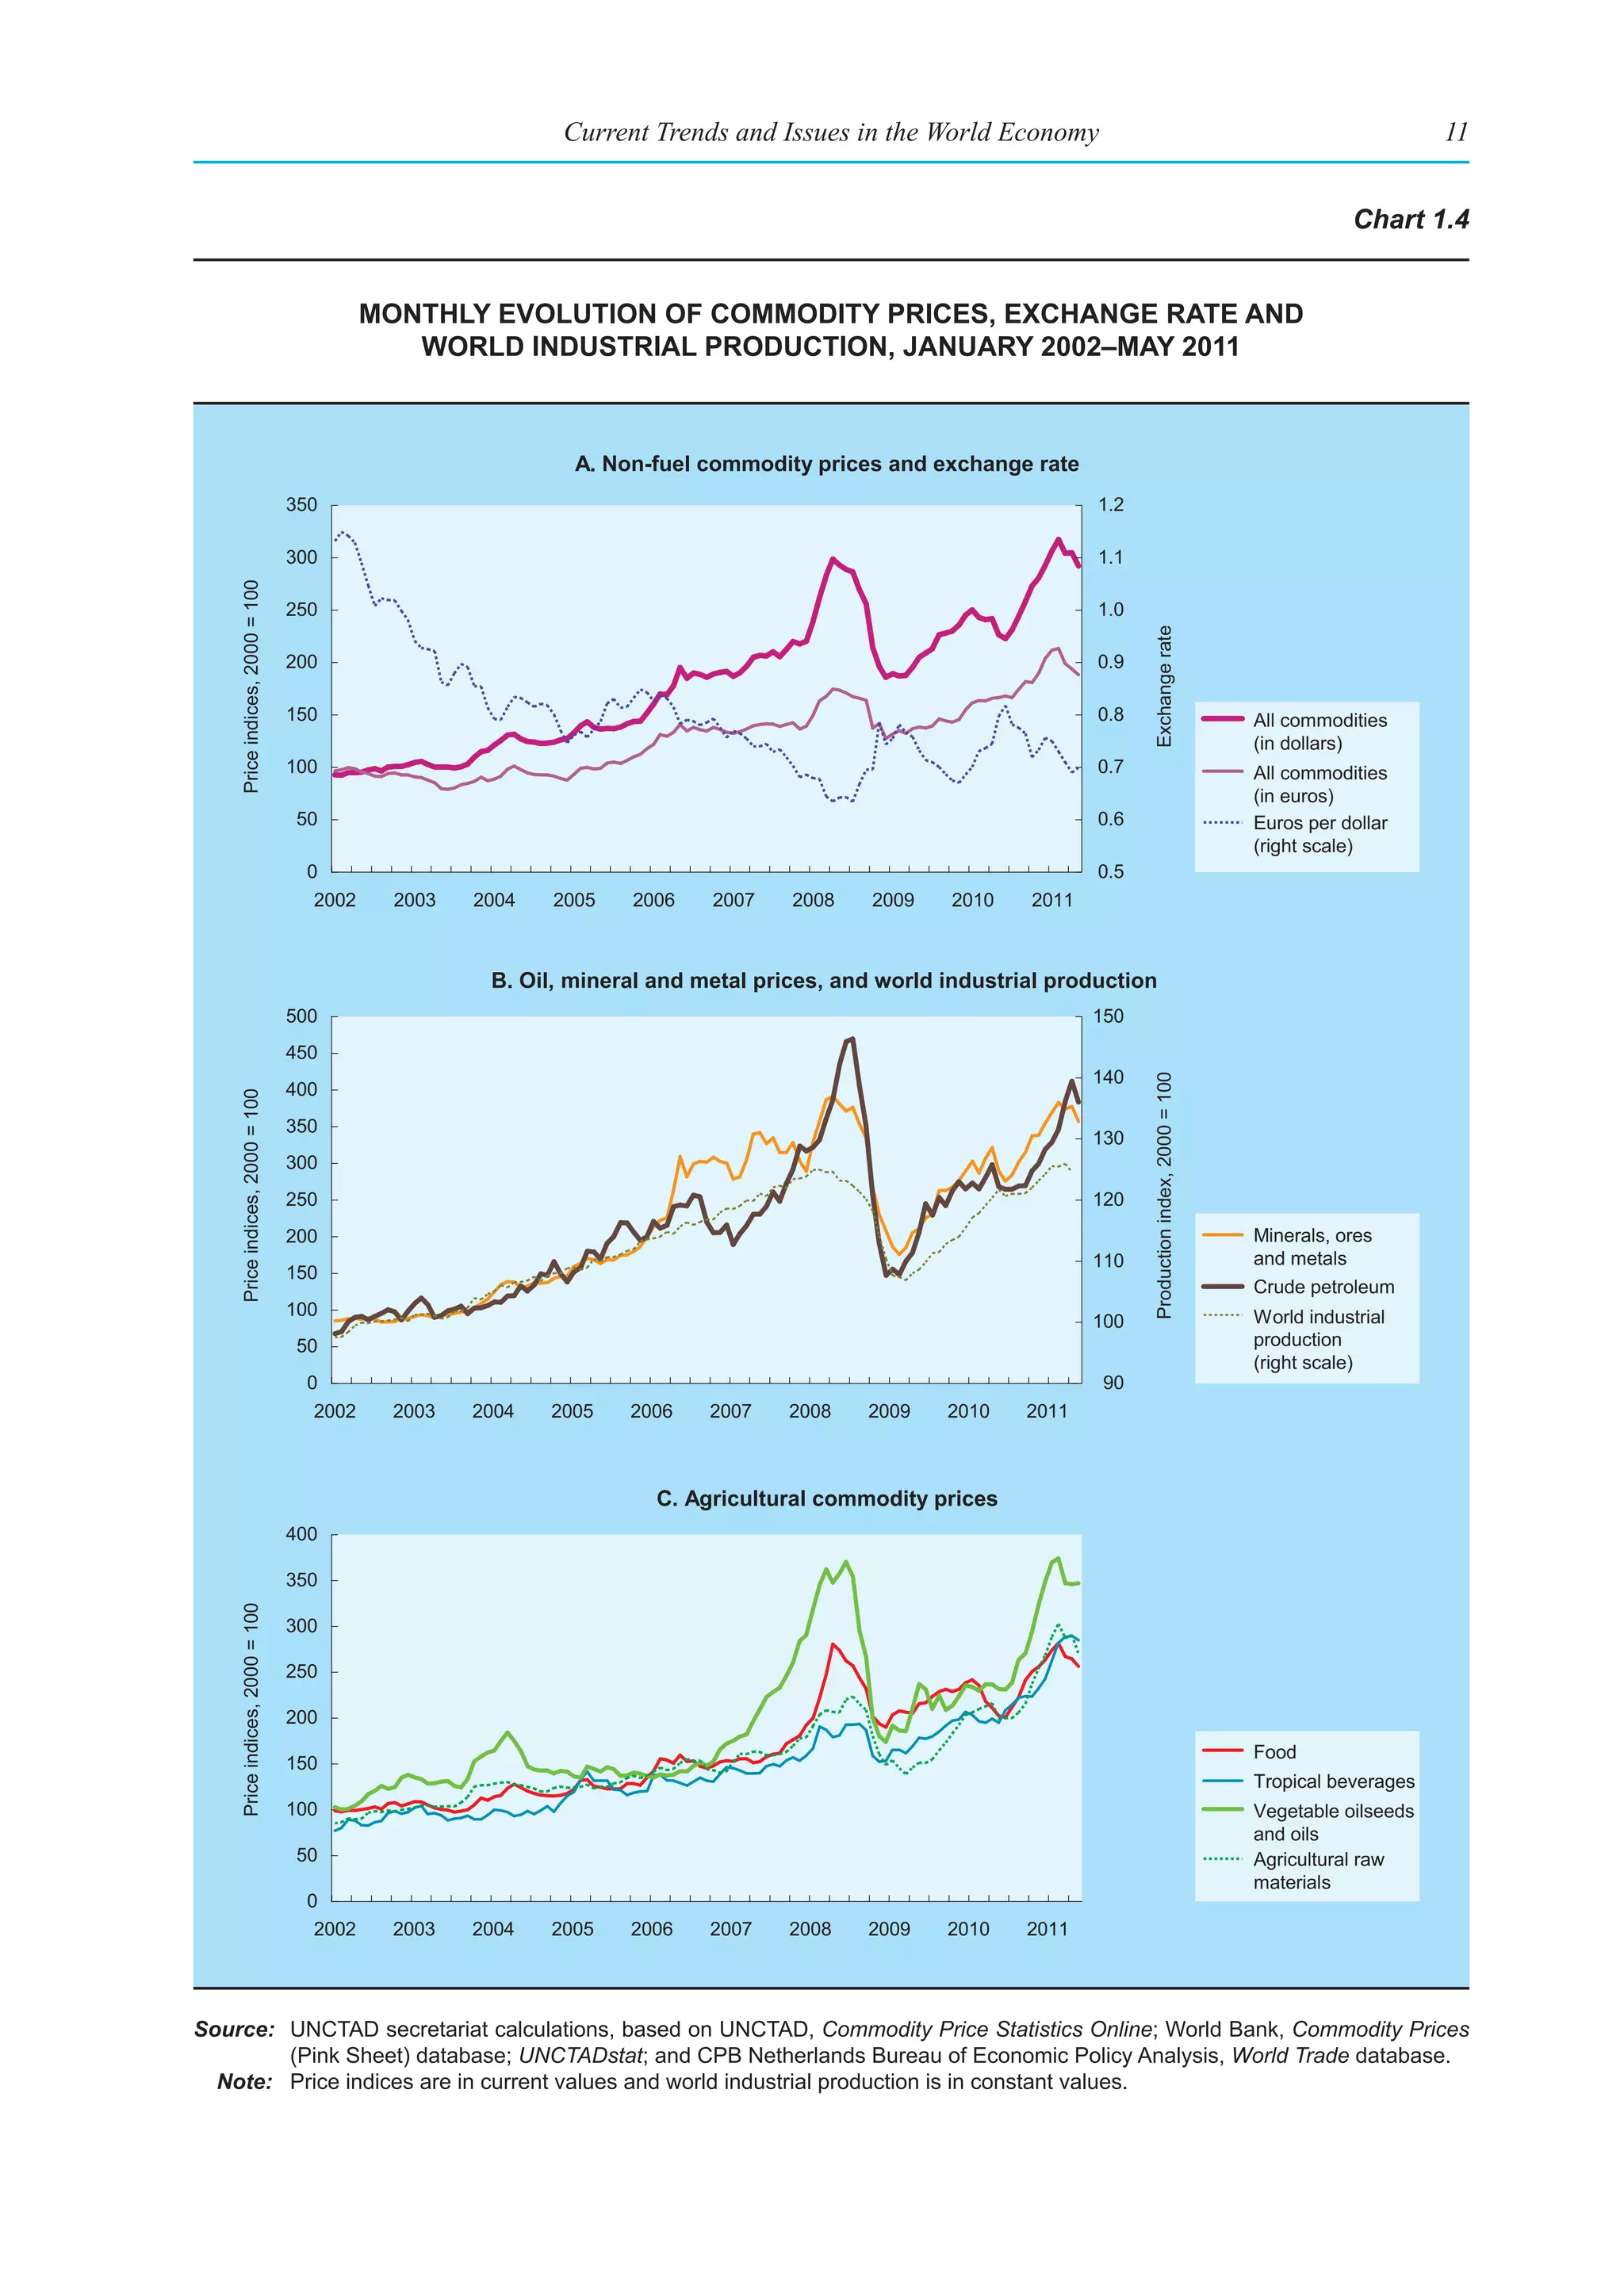
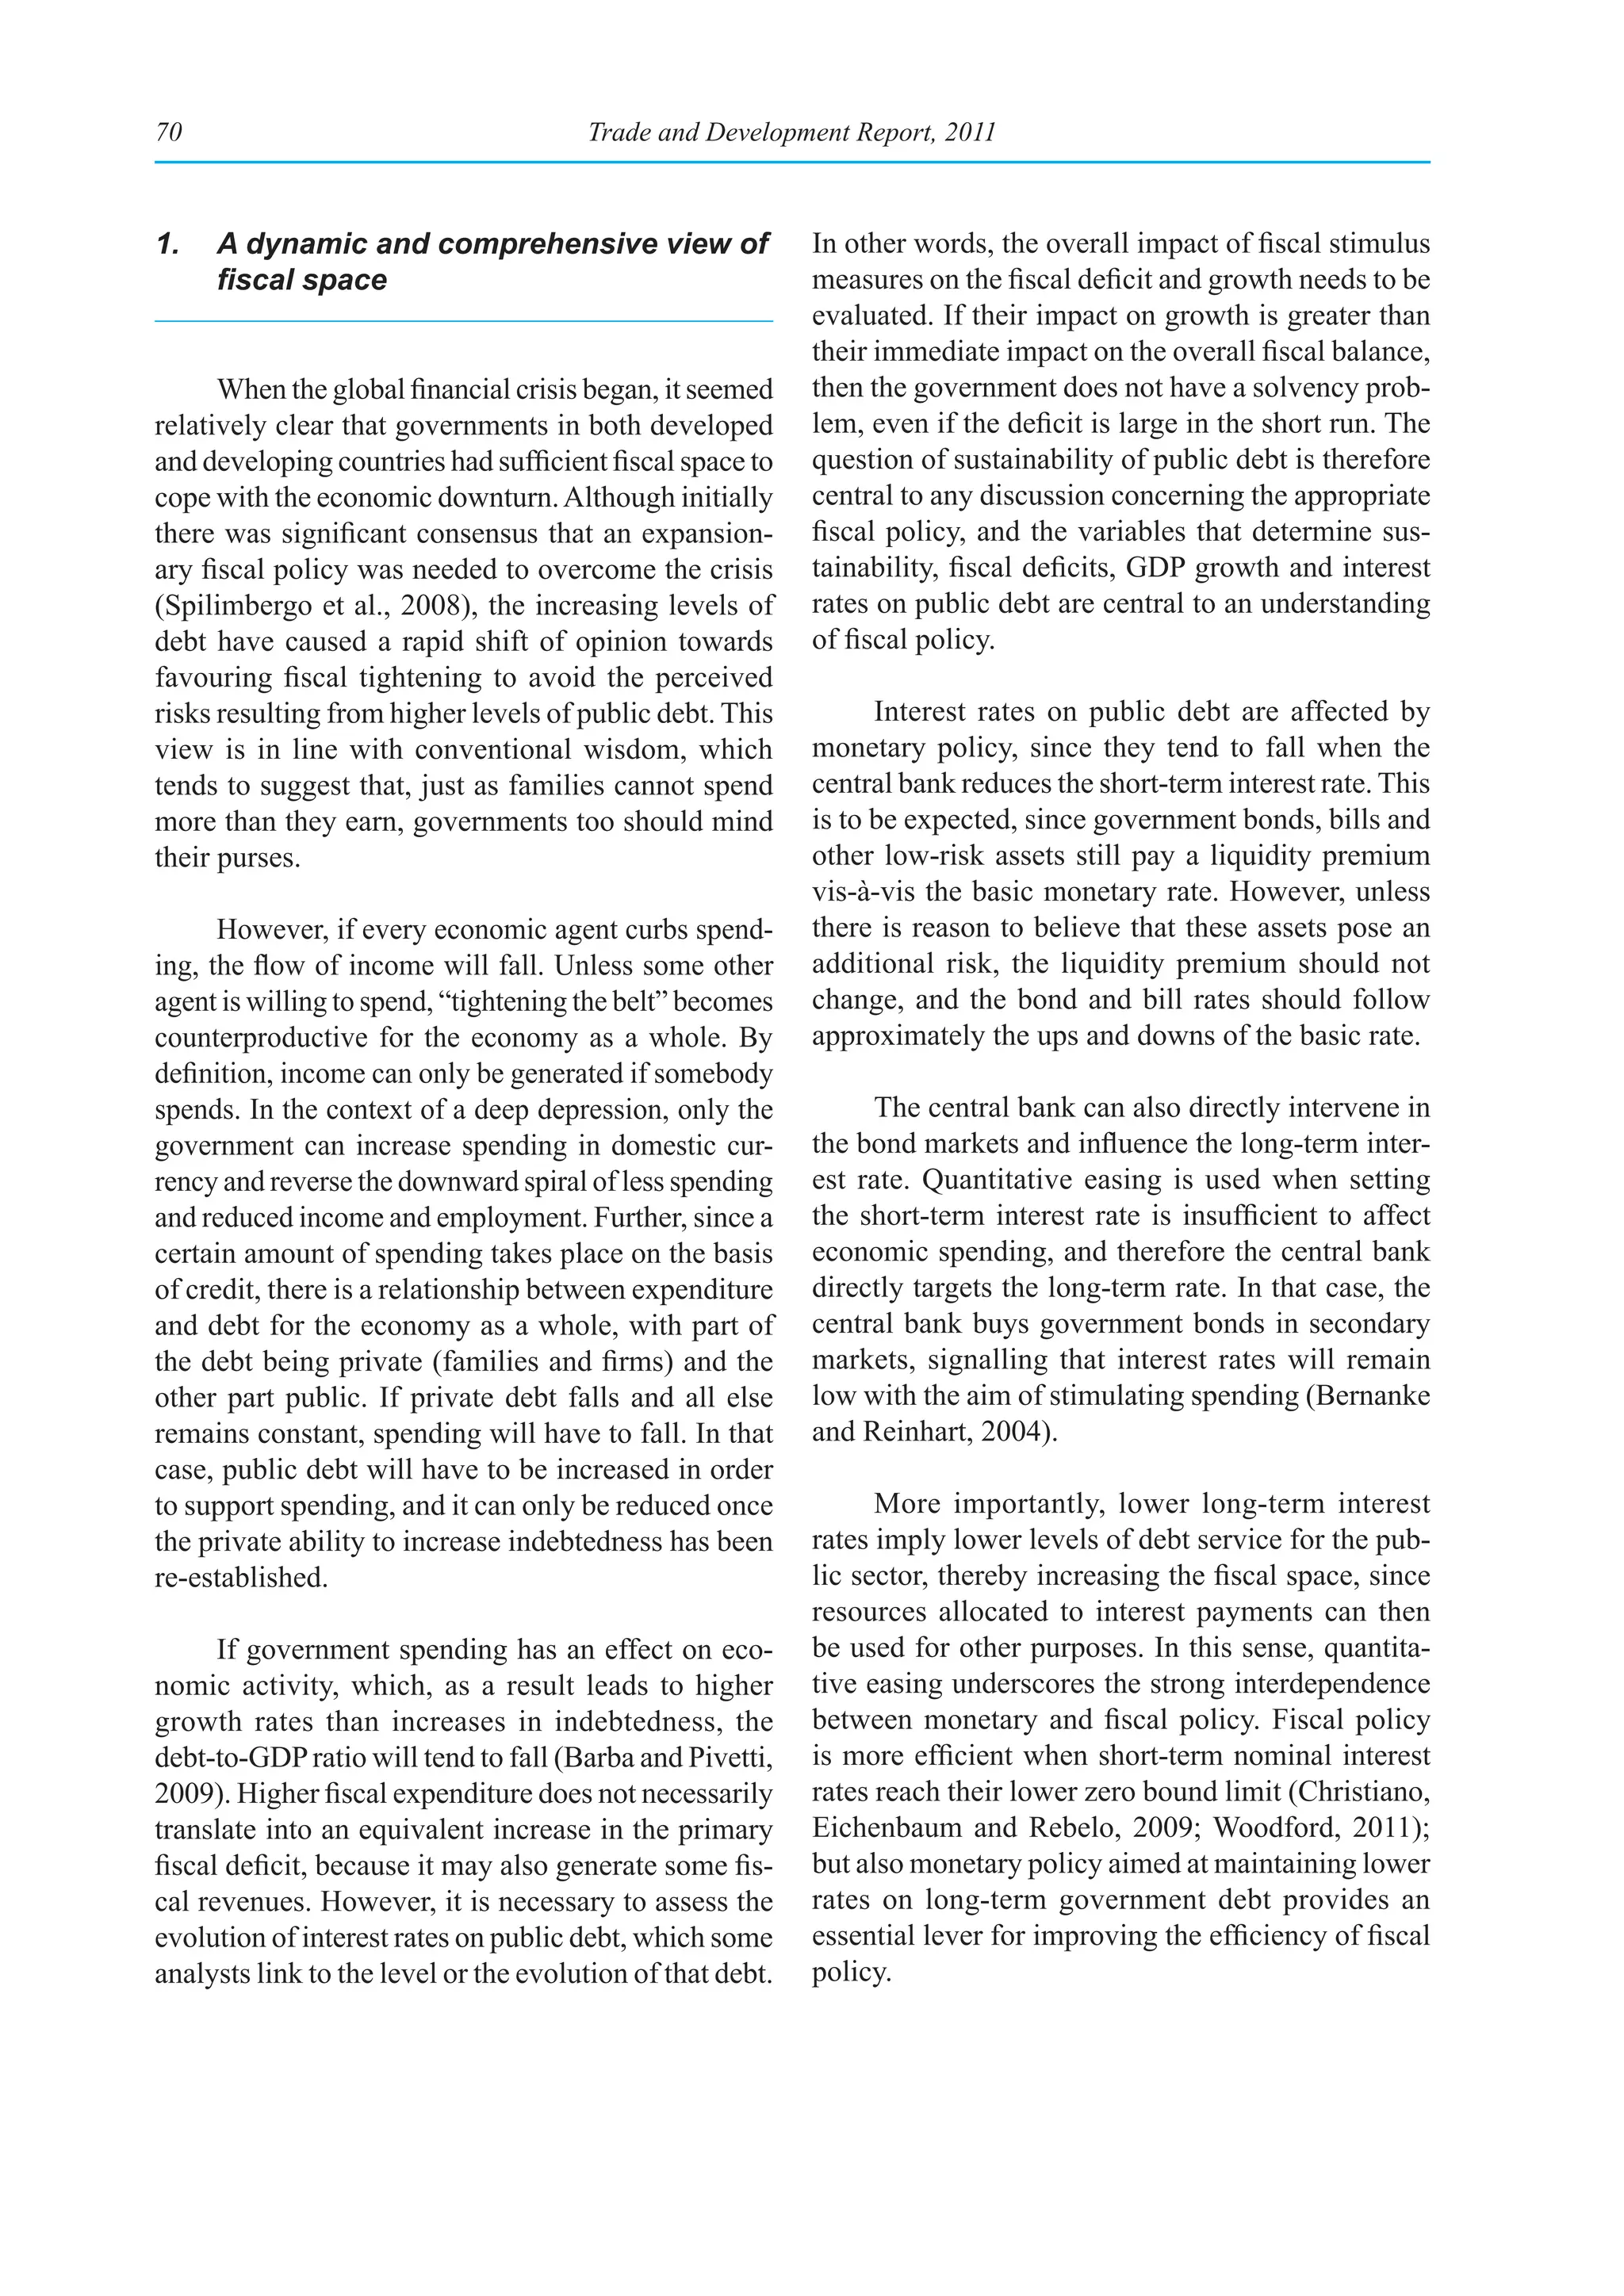
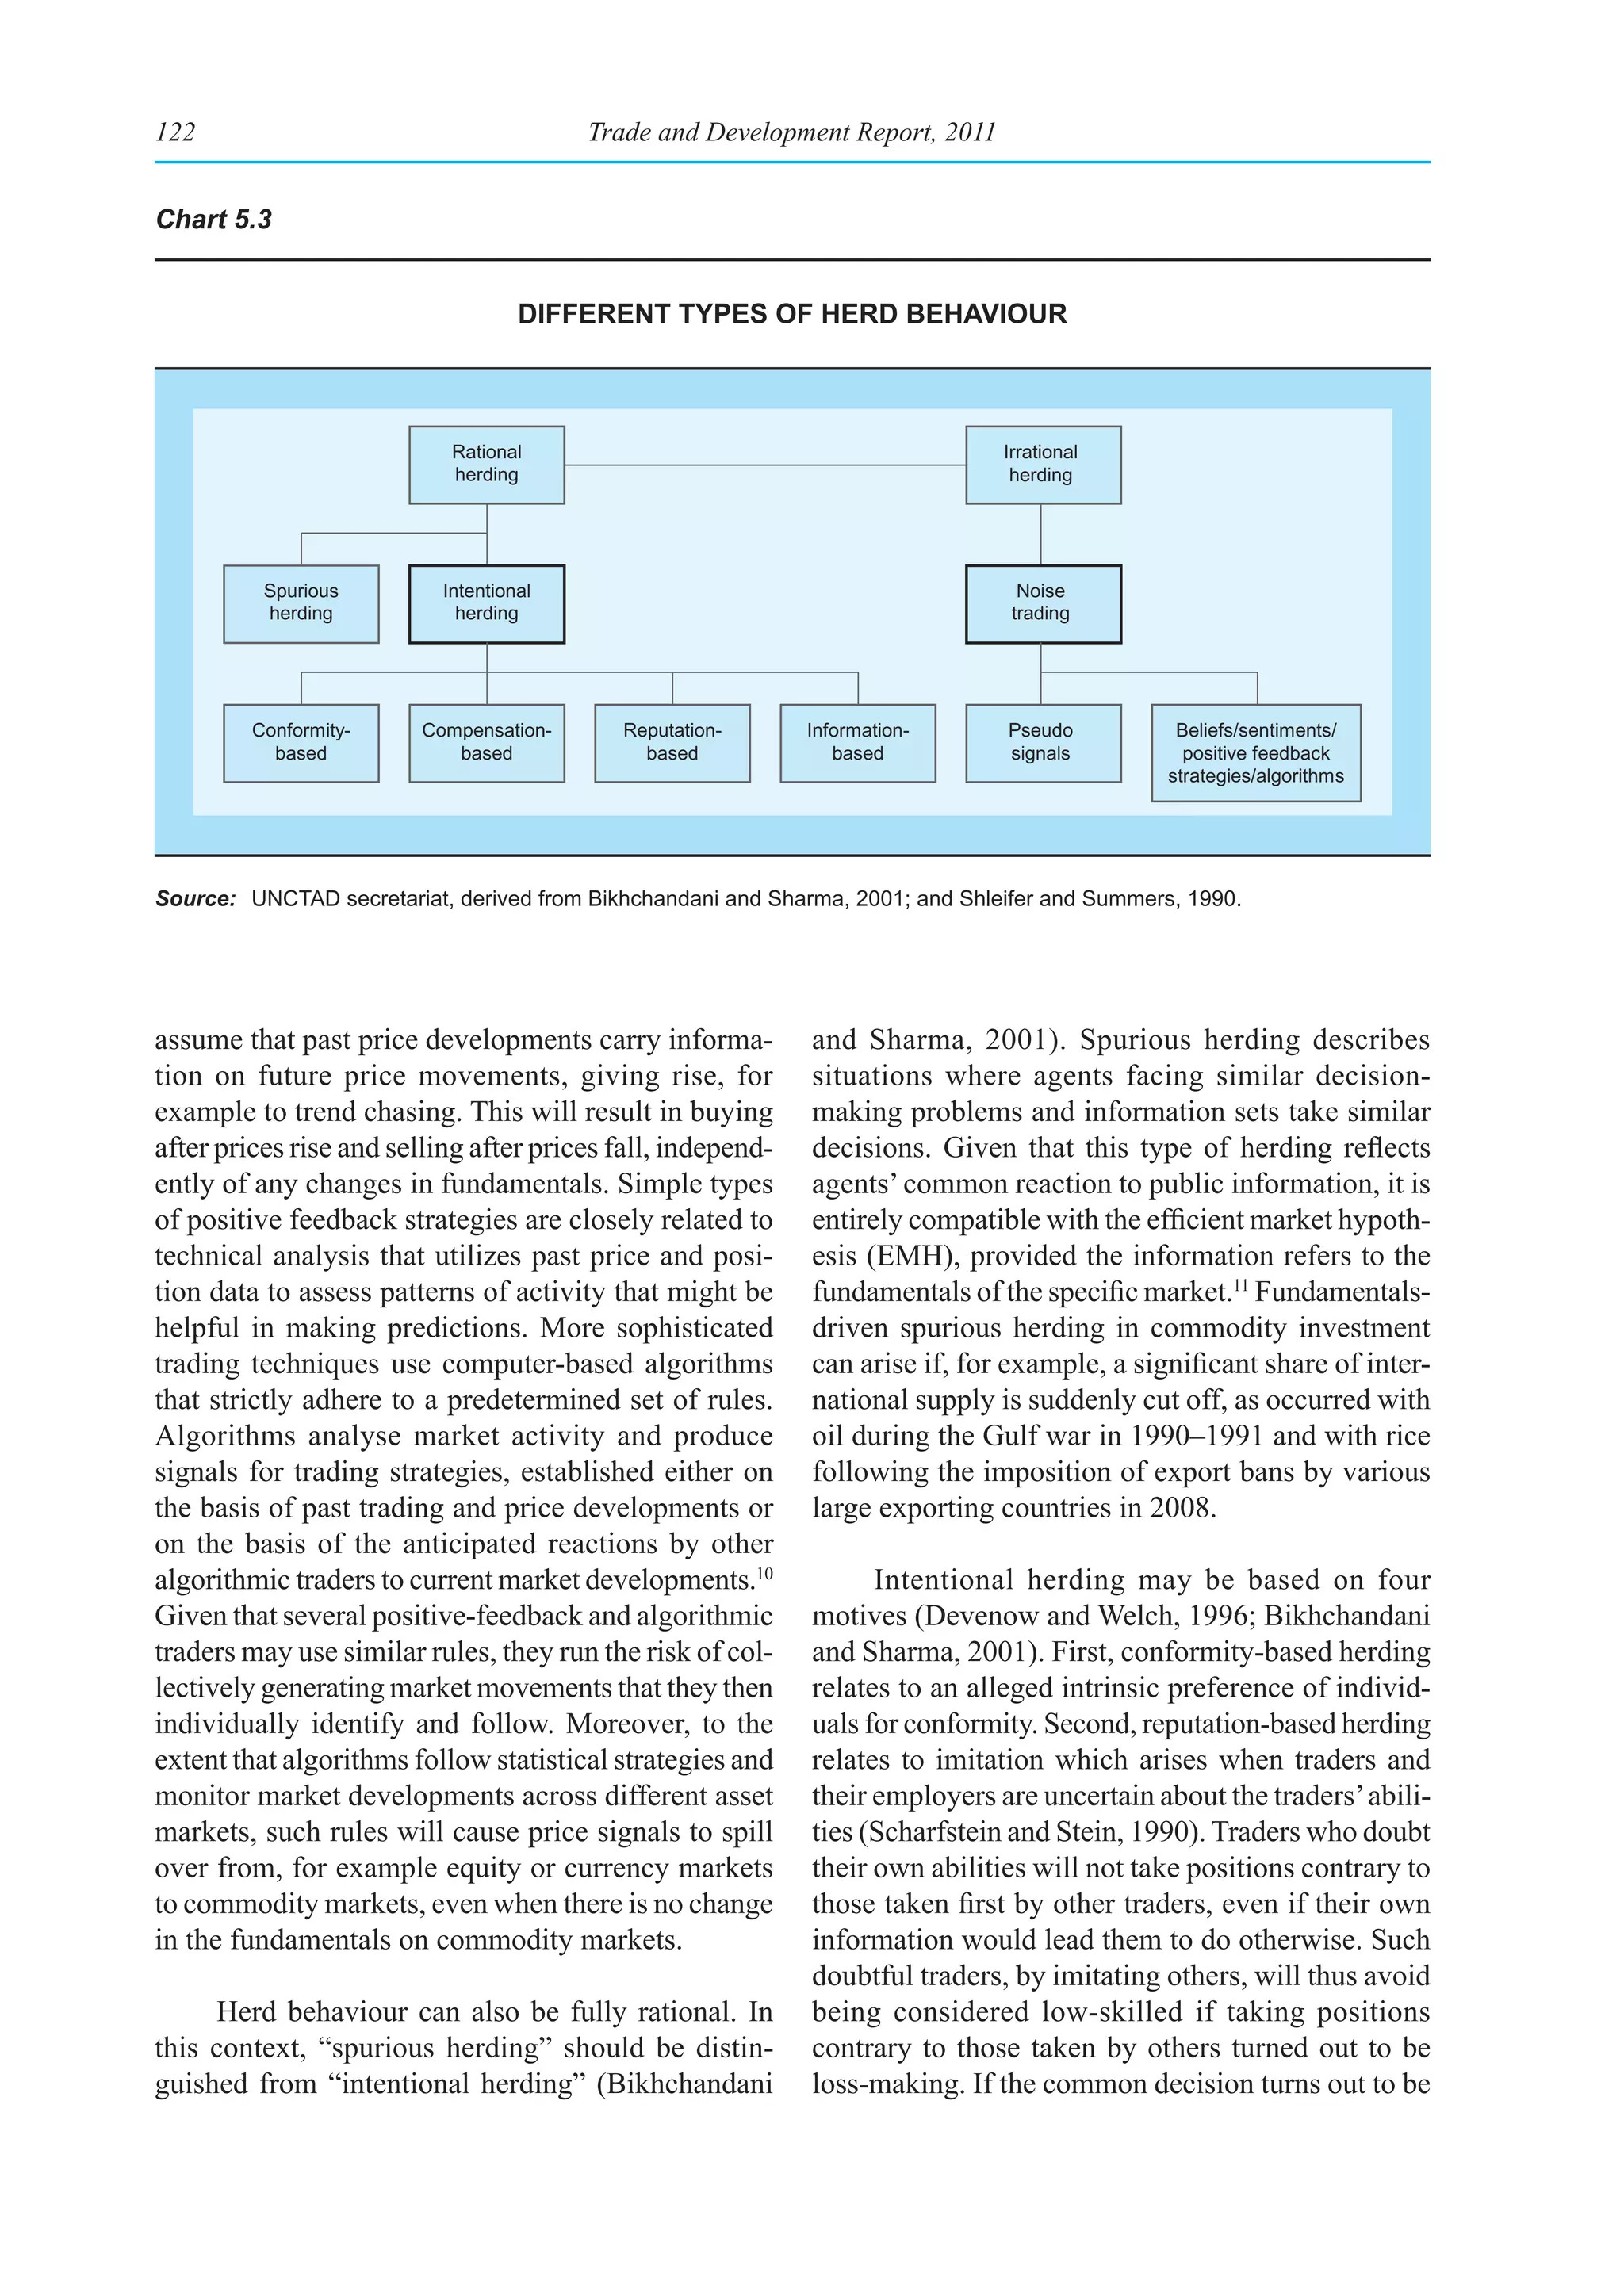
is already under way. For example, the International However, economic expansion in developing
Monetary Fund (IMF) believes fiscal expansion is no countries faces several challenges. Paradoxically,
longer needed since “private demand has, for the most some of their problems result from their resistance
part, taken the baton” (IMF, 2011a: xv). Moreover, to financial contagion during the recent crisis. In
the Bank for International Settlements (BIS) argues particular, because emerging market economies
that inflation is presently the main risk in an otherwise appeared to be less risky, they attracted even more
recovering world economy, and therefore suggests short-term capital inflows. Such flows may generate
“policy [interest] rates should rise globally” (BIS, asset bubbles and pressures for exchange rate appre-
2011: xii). According to these views, economic policy ciation, which would erode their competitiveness.
should no longer aim at stimulating growth, but instead Moreover, higher inflation in several of these coun-
should focus on controlling inflation and reducing fis- tries, owing largely to commodity price increases,
cal deficits and public debt. But with nearly all the has led them to tighten monetary policy and raise
governments of the large developed economies try- interest rates, which further attract foreign capital
ing to curb public expenditure, including cutting or in the form of carry-trade operations. At the same
freezing public sector wages, the consequent dimin- time, volatility in highly financialized commodity
ished expectations of private households threaten to markets suggests that a negative shock originating in
derail recovery of the world economy. With weak developed economies might exert a strong downward
labour market indicators in the United States, risks pressure on the prices of primary commodity exports,
of financial contagion in Europe and a deterioration as already happened in 2008 (see chapter V of this
in some leading indicators for global manufacturing Report). Hence, despite the greater role of domes-
(JP Morgan, 2011), the implementation of restrictive tic markets in driving growth, there are significant
macroeconomic policies increases the probability of external risks to sustained economic expansion in
a prolonged period of mediocre growth, if not of an developing countries due to economic weaknesses
outright contraction, in developed economies. in developed economies and the lack of significant
reforms in international financial markets.
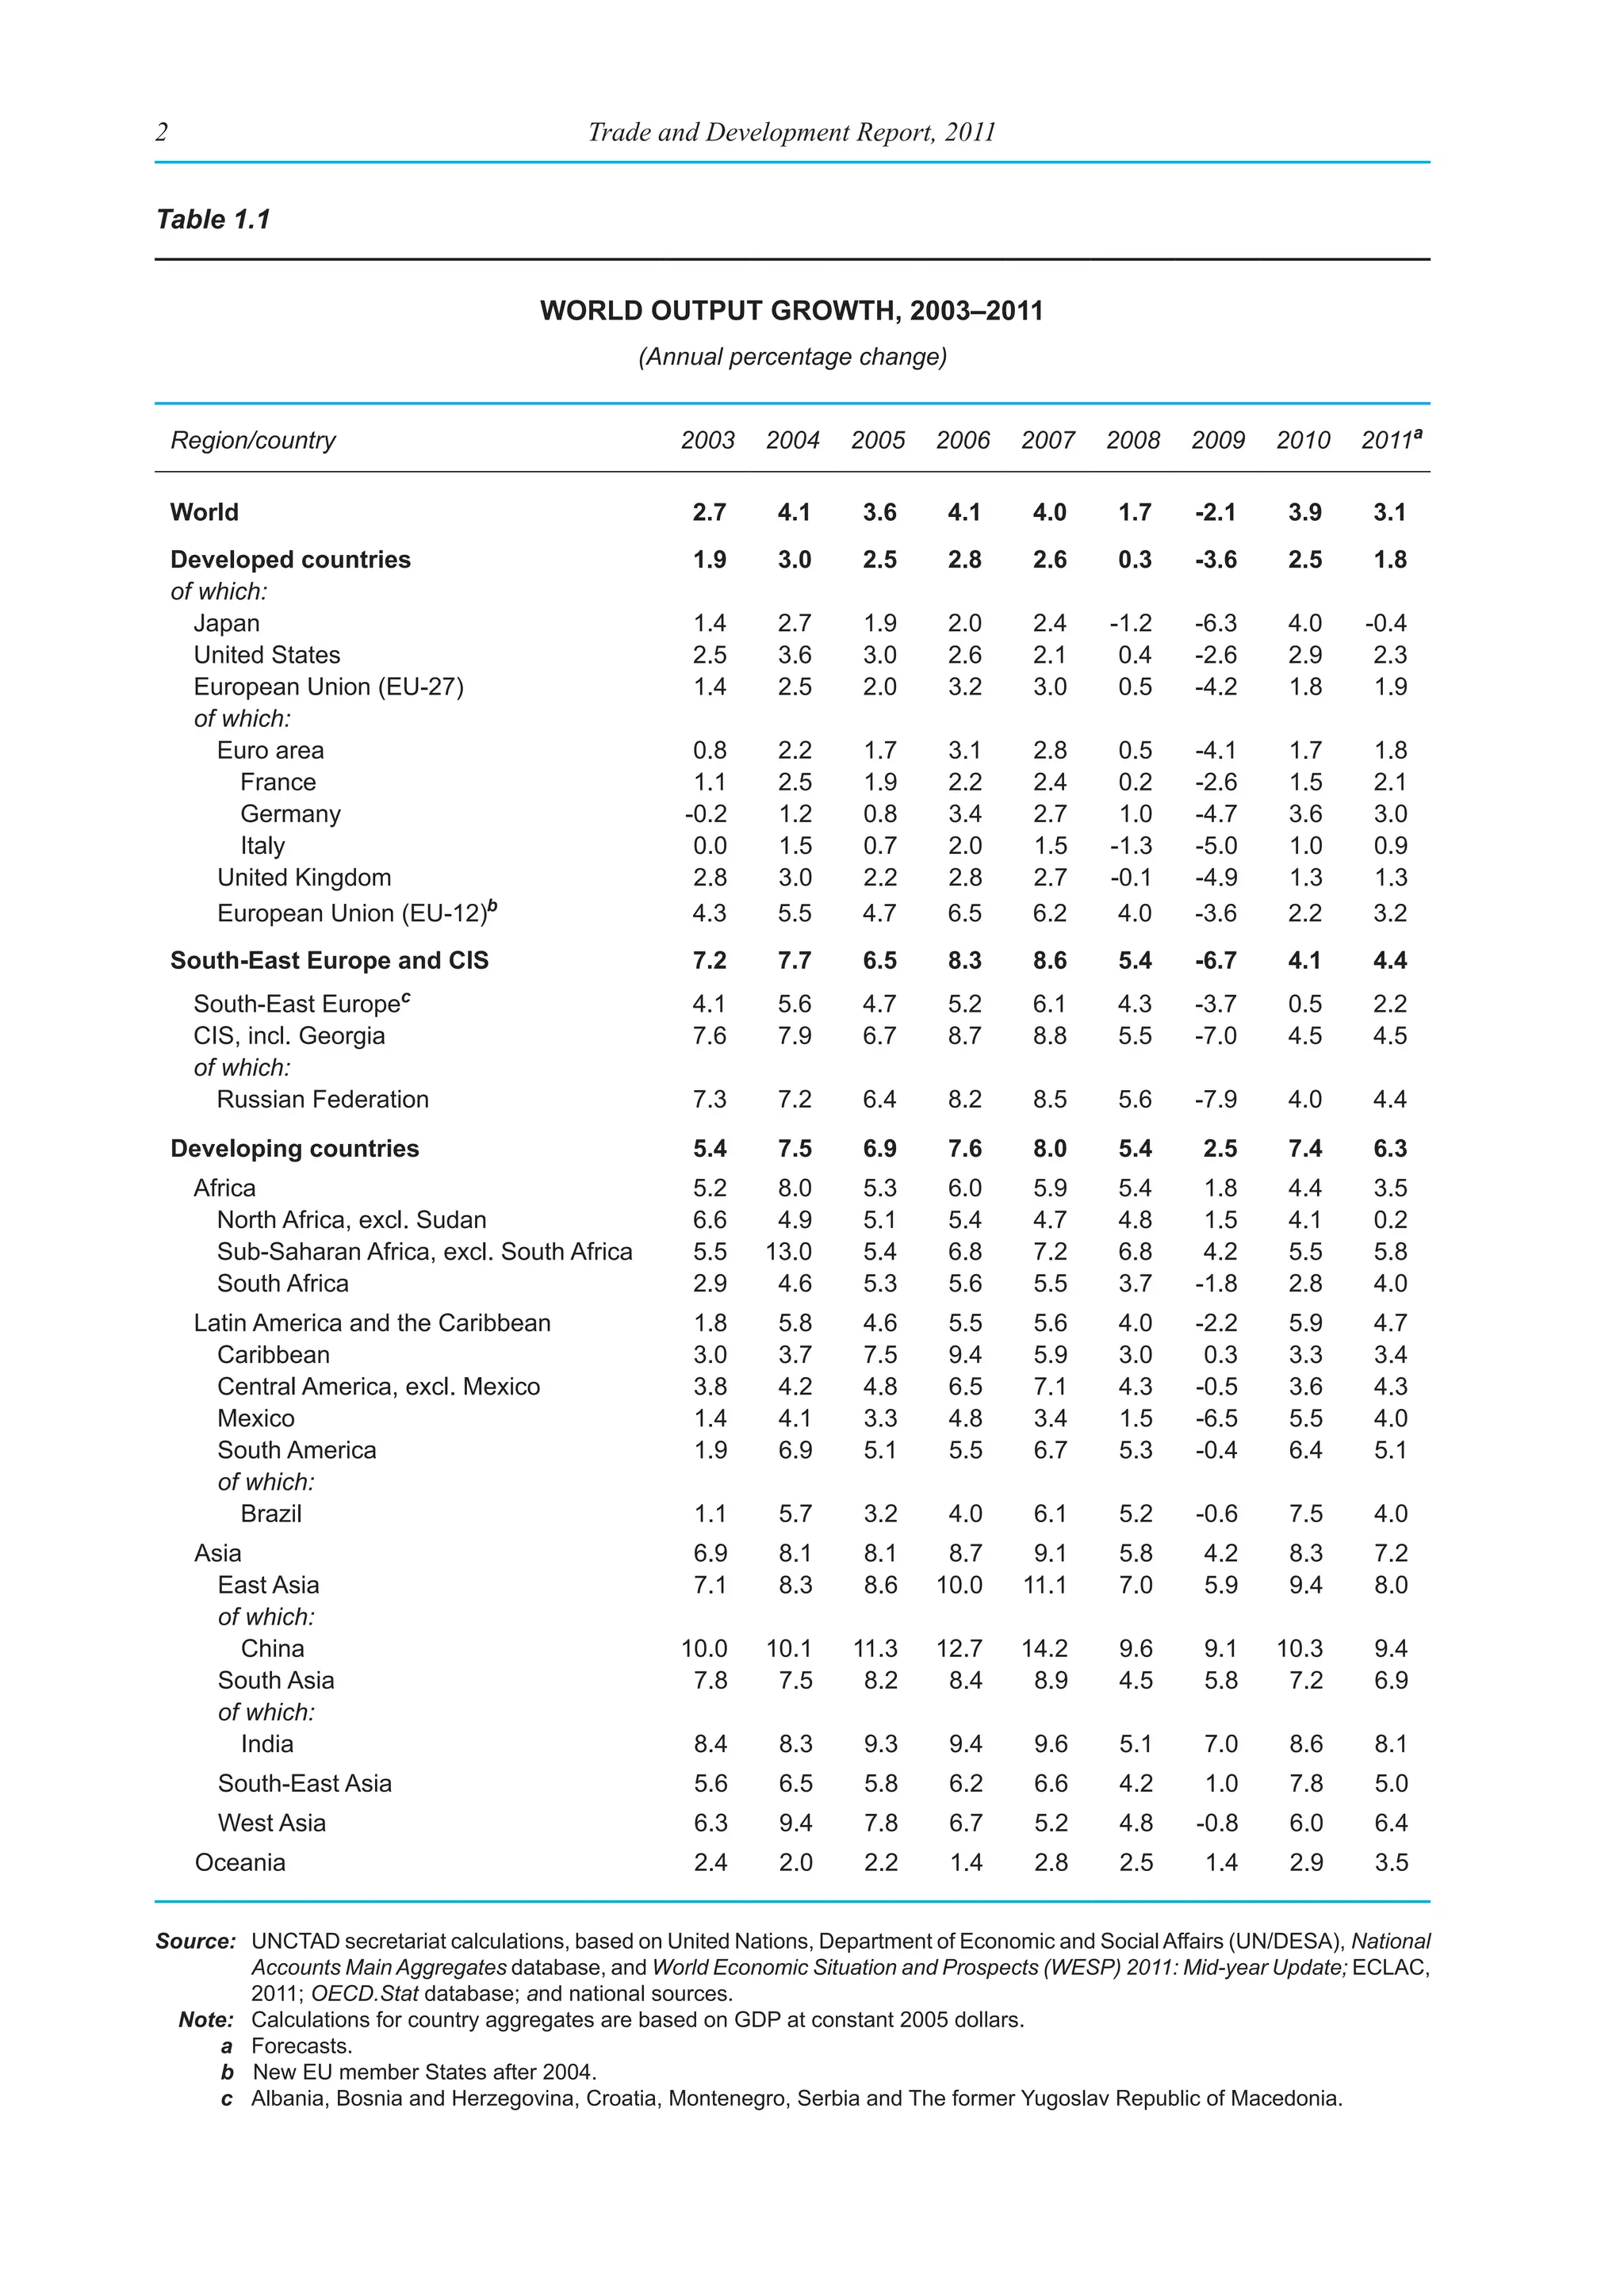
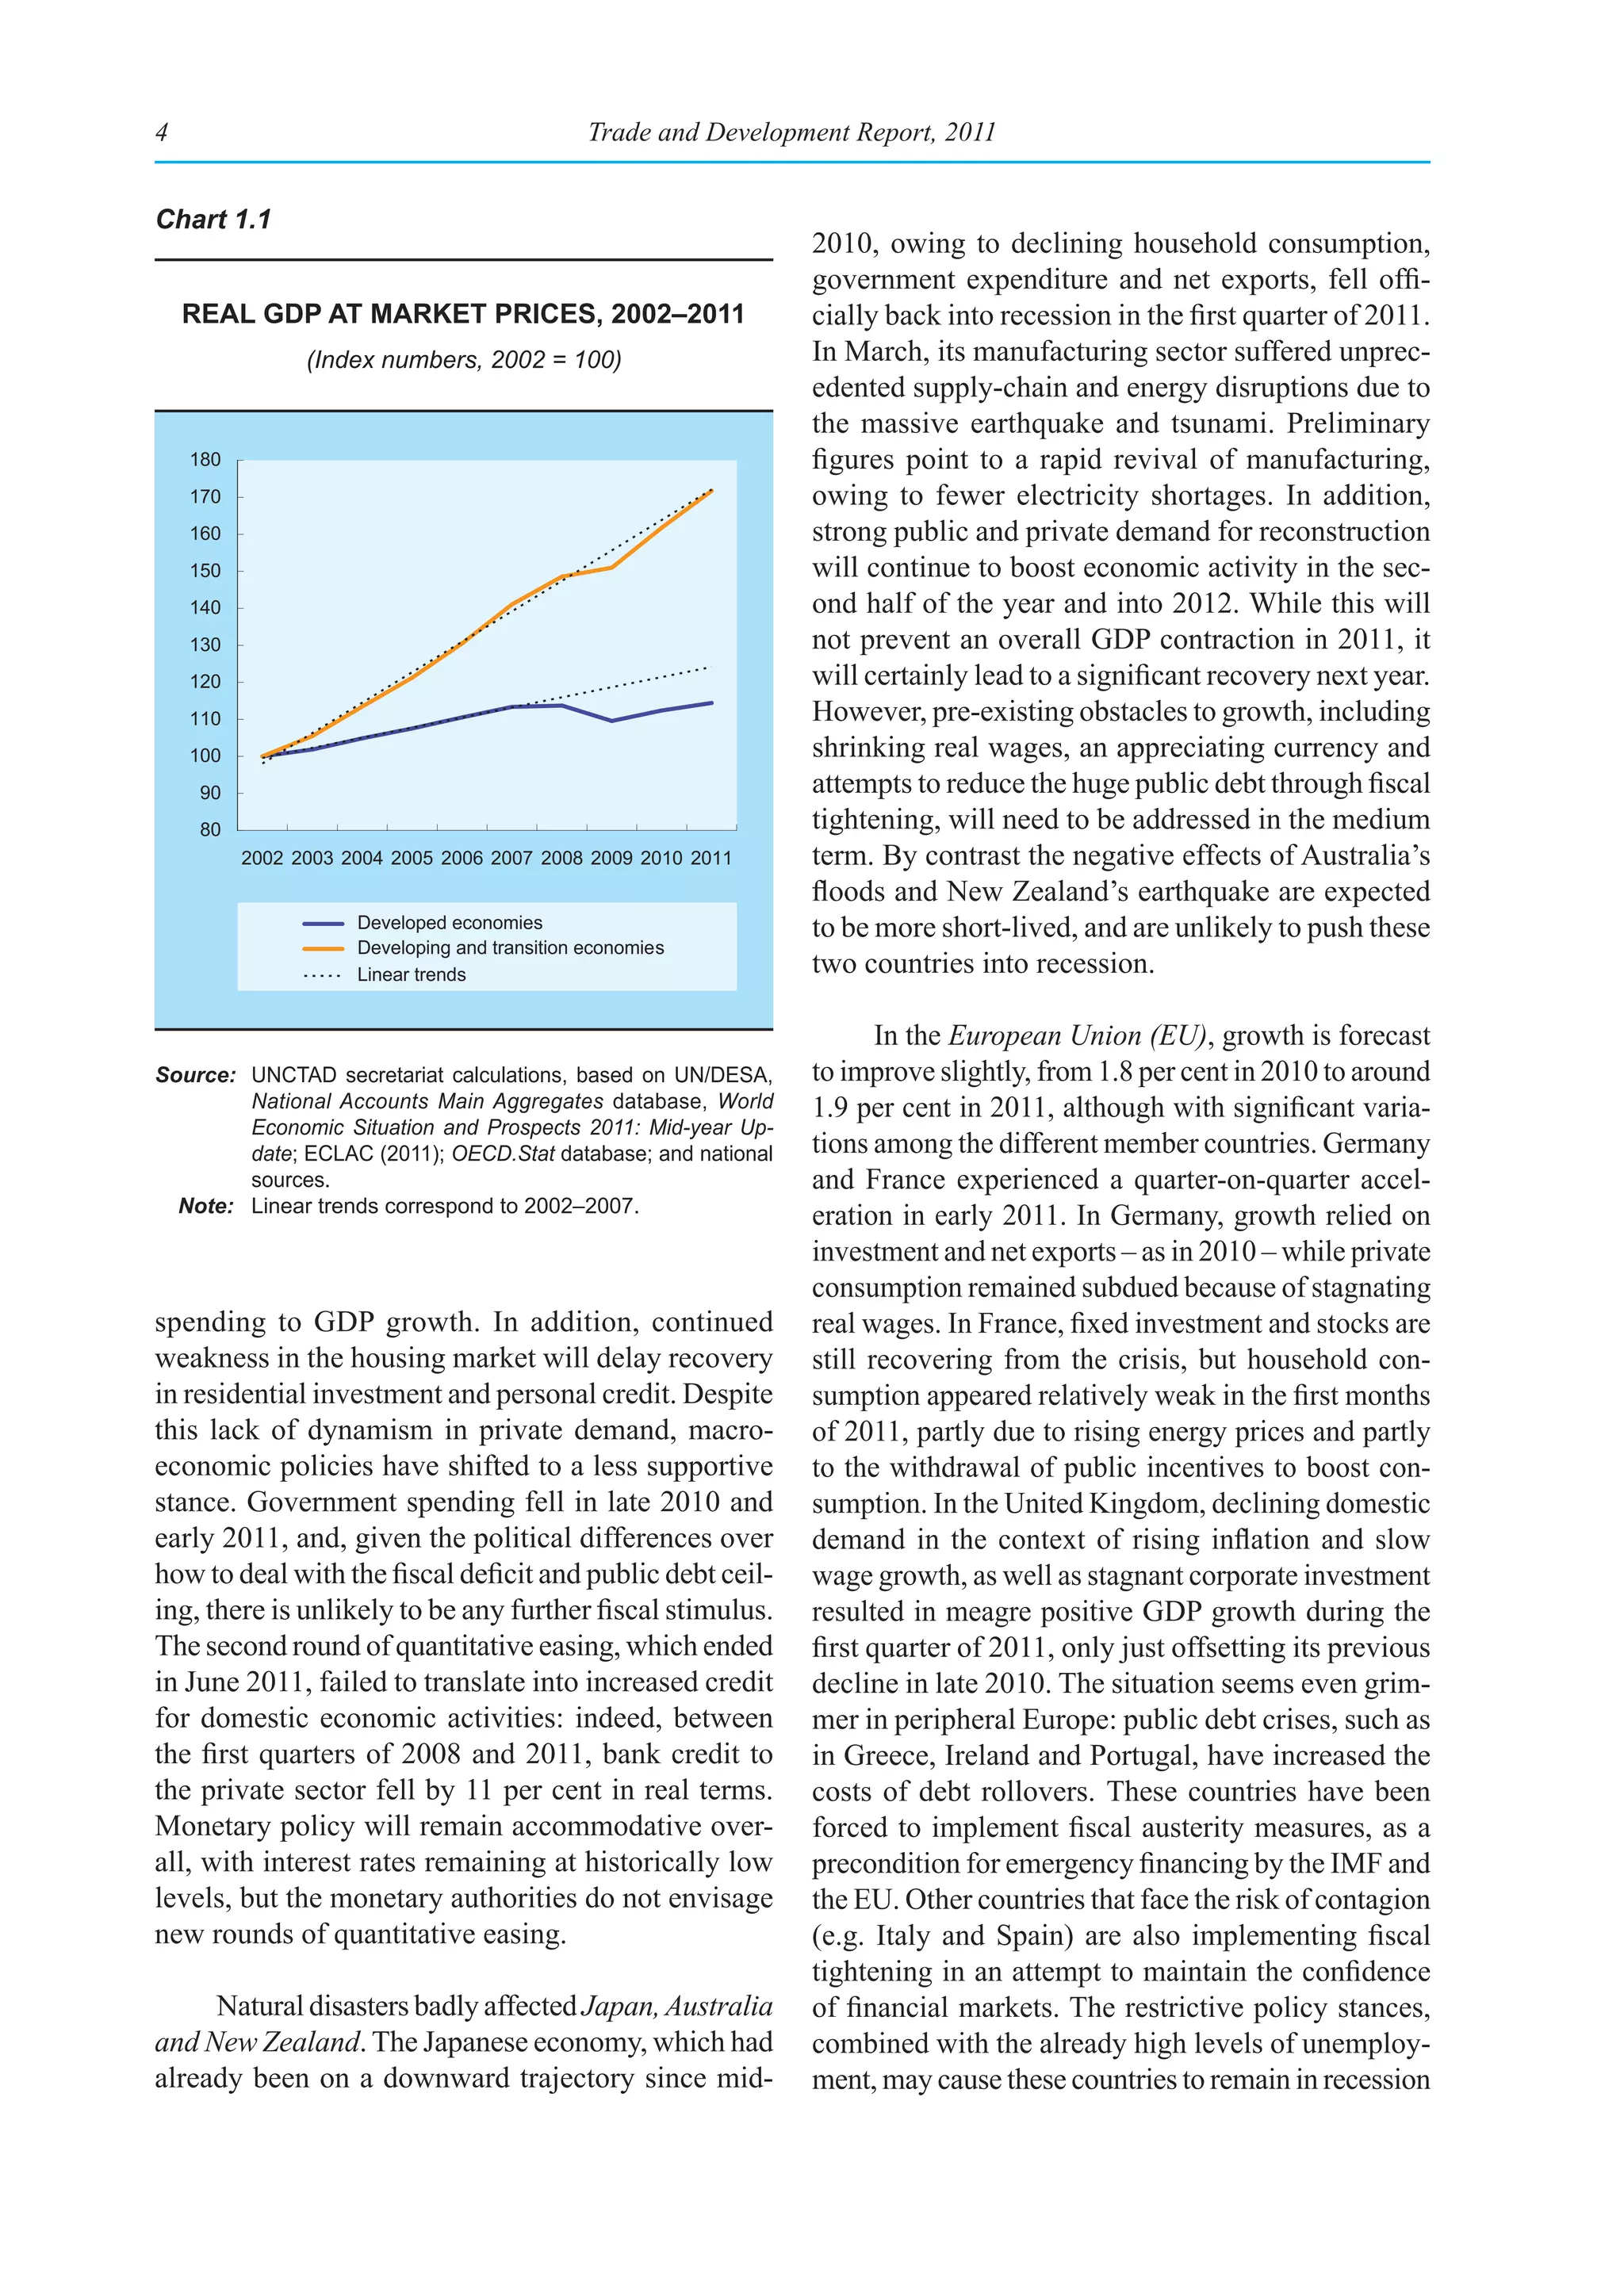
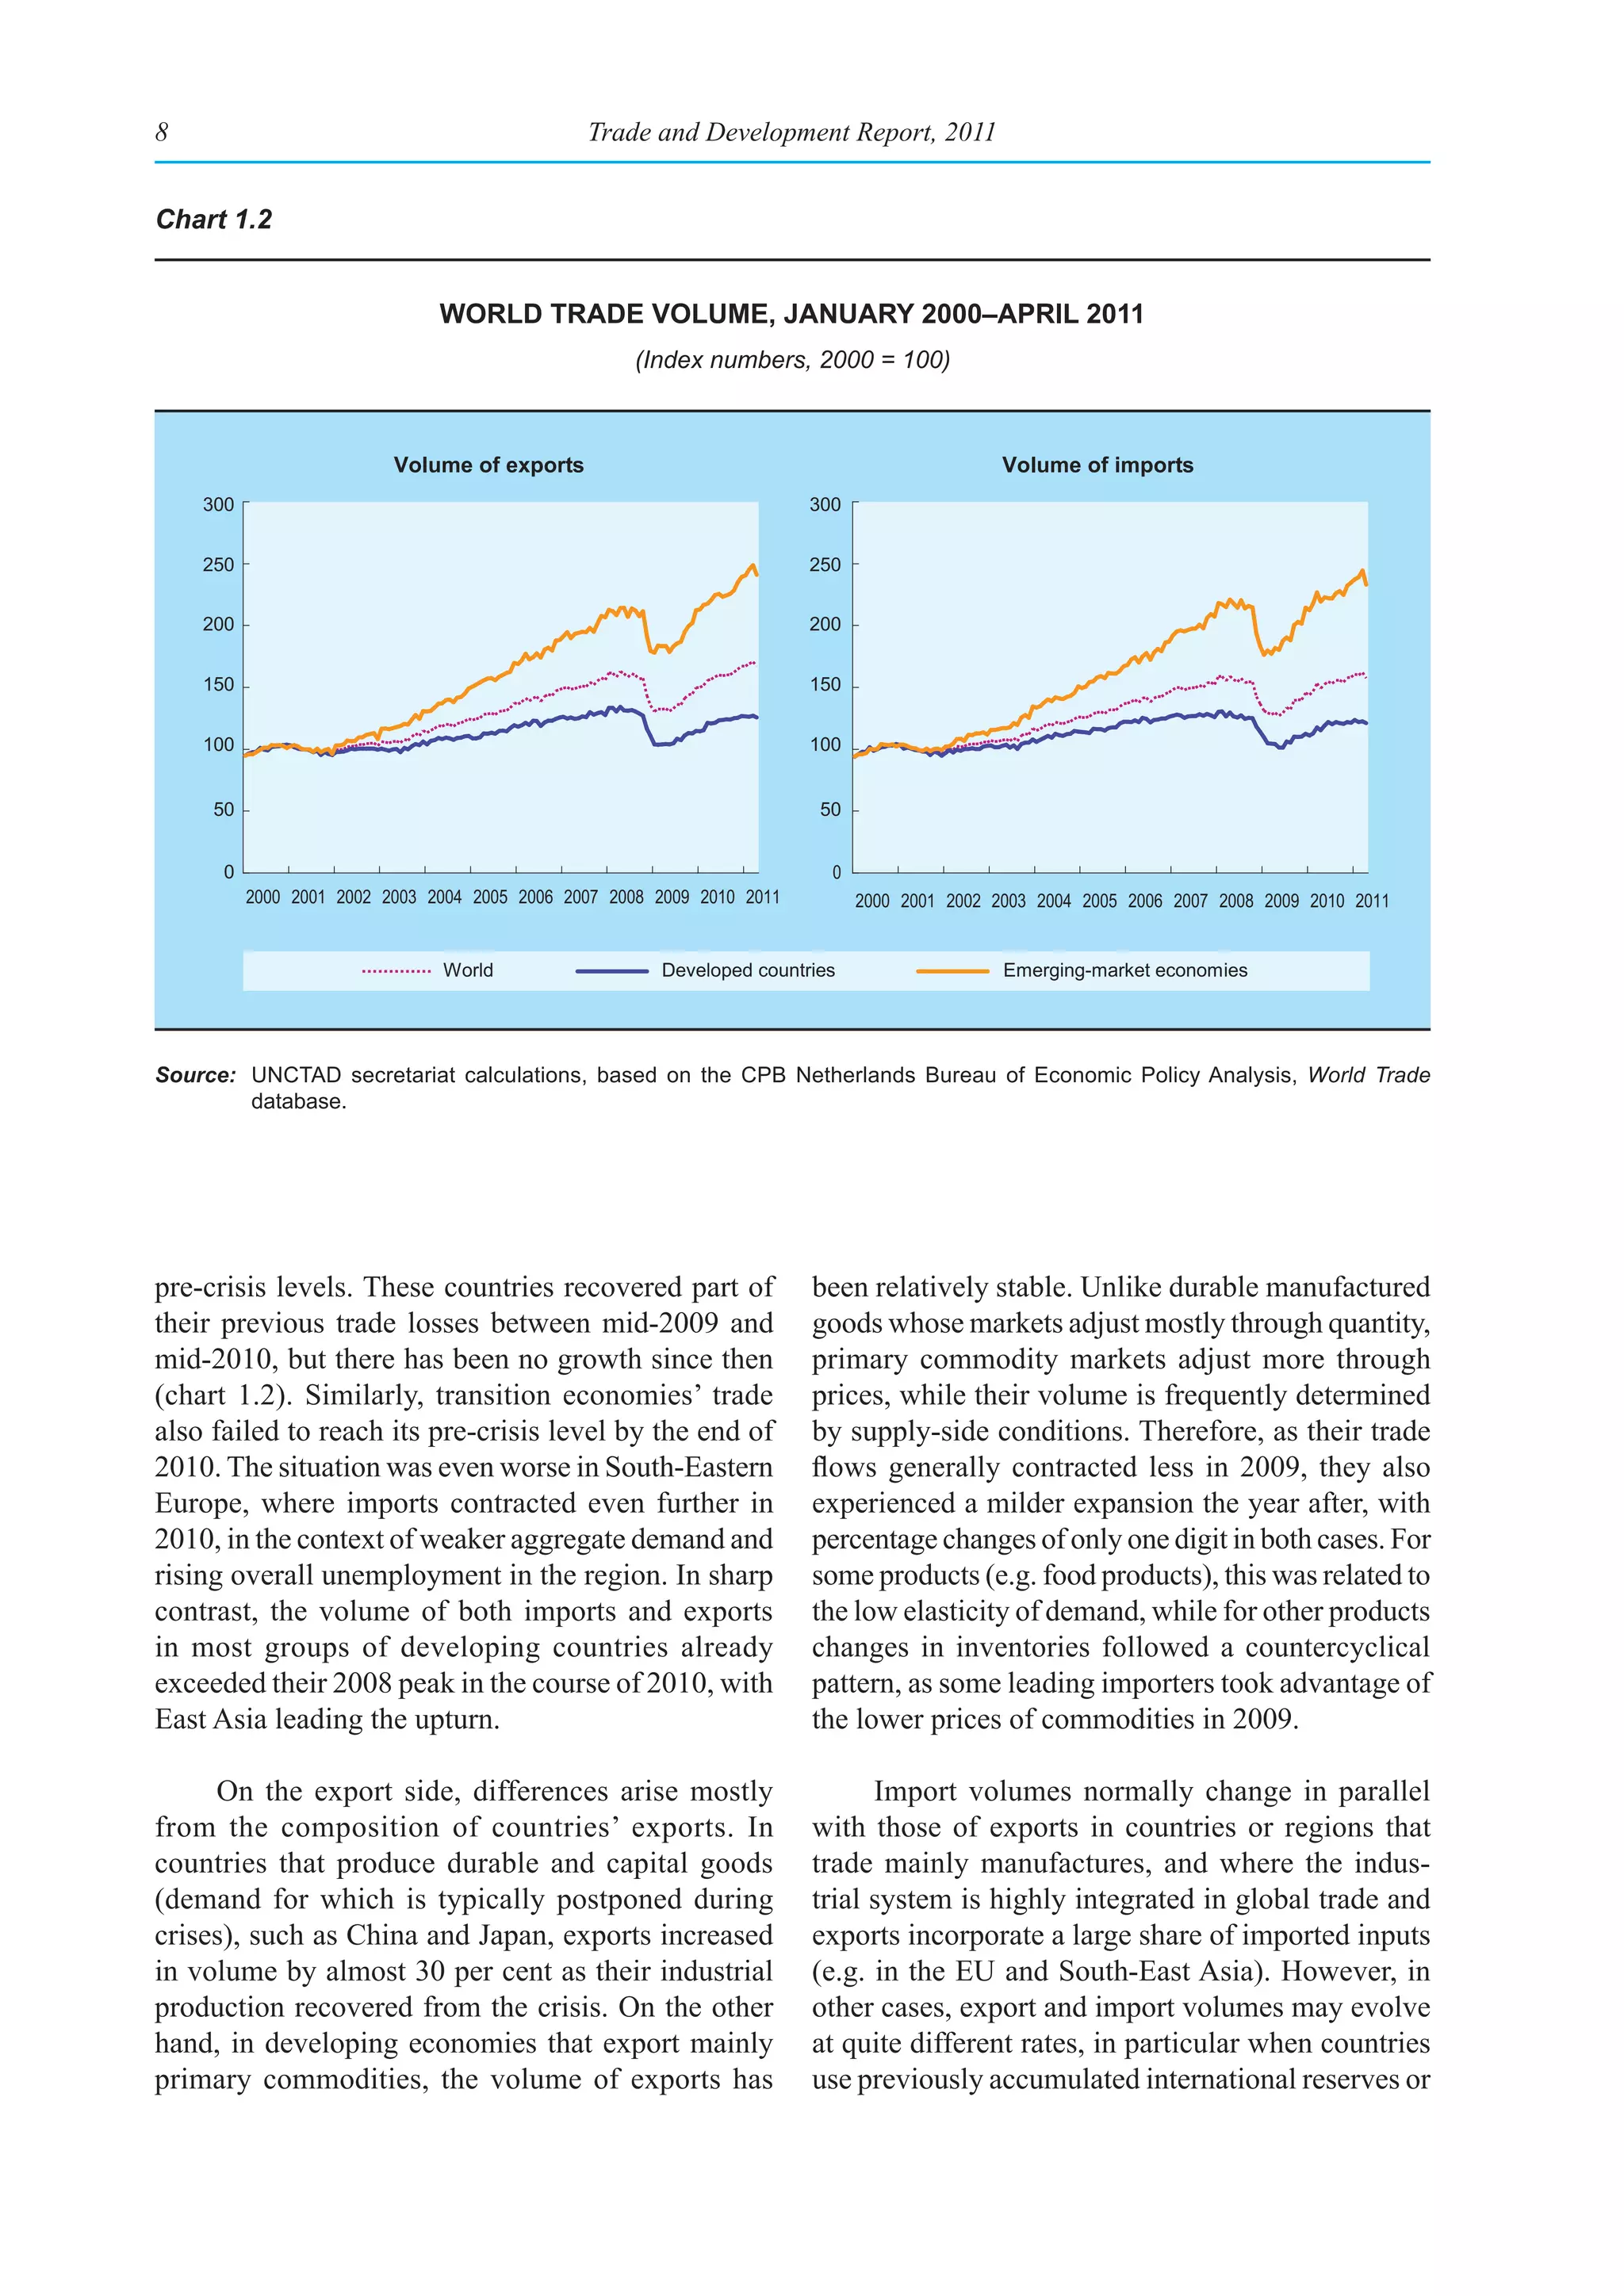
Developing economies present a different pic-
ture. Rapid recovery from the crisis and the subsequent It is therefore evident that the widely varying
sustained growth have been the result of various fac- pace of economic recovery is one of the main char-
tors, including countercyclical measures, the recovery acteristics of the post-crisis world economy. While
of commodity prices since mid-2009 and an expan- developing and transition economies, as a group,
sion of real wages. Some analysts suggest that higher have regained their pre-crisis growth trend follow-
commodity prices have been the main cause of recov- ing the 2008–2009 slowdown, growth in developed
ery in developing countries (IMF, 2011a). However, economies remains very sluggish, which suggests
while the higher prices have been essential for com- that their economic output is currently well below
modity exporters, commodity-importing developing potential (chart 1.1). In the United States, economic
countries have also grown at a rapid pace. A major recovery has been stalling since early 2011, so that
factor that should not be underestimated is that in growth is too slow to significantly reduce unemploy-
many developing countries the Great Recession has ment. Labour indicators deteriorated sharply between
not led to cuts in real wages; on the contrary, domes- the end of 2007 and mid-2009, with steep increases
tic income and demand have remained on a growth in both unemployment and underemployment rates,
trajectory. In that sense, the recovery in many devel- and they did not improve with the subsequent eco-
oping countries, which has been largely wage-led, nomic recovery. In the first quarter of 2011, payroll
contrasts with that of developed economies, which employment remained below its level of the first
is associated with wage stagnation. In addition, since quarter of 2009 (at the trough of the economic cycle),
the financial systems in developing countries were and real hourly wages remained stagnant. As a result,
largely unaffected by the most recent crisis, their wage-earners did not profit at all from the economic
domestic demand is further supported by the avail- recovery; between the second quarter of 2009 and
ability of domestic credit. Therefore, their growth has the first quarter of 2011, it was corporate profits that
become increasingly dependent on the expansion of captured 92 per cent of the accumulated growth in
domestic markets, which may explain the continuing national income. Such a recovery, which has been
growth and resilience of these economies, despite referred to as “jobless and wageless” (Sum et al.,
slow growth in developed countries. 2011), implies little, if any, contribution of consumer](https://image.slidesharecdn.com/tradeanddevelopmentreport2011-110906230532-phpapp02/75/Trade-and-development-report-2011-35-2048.jpg)
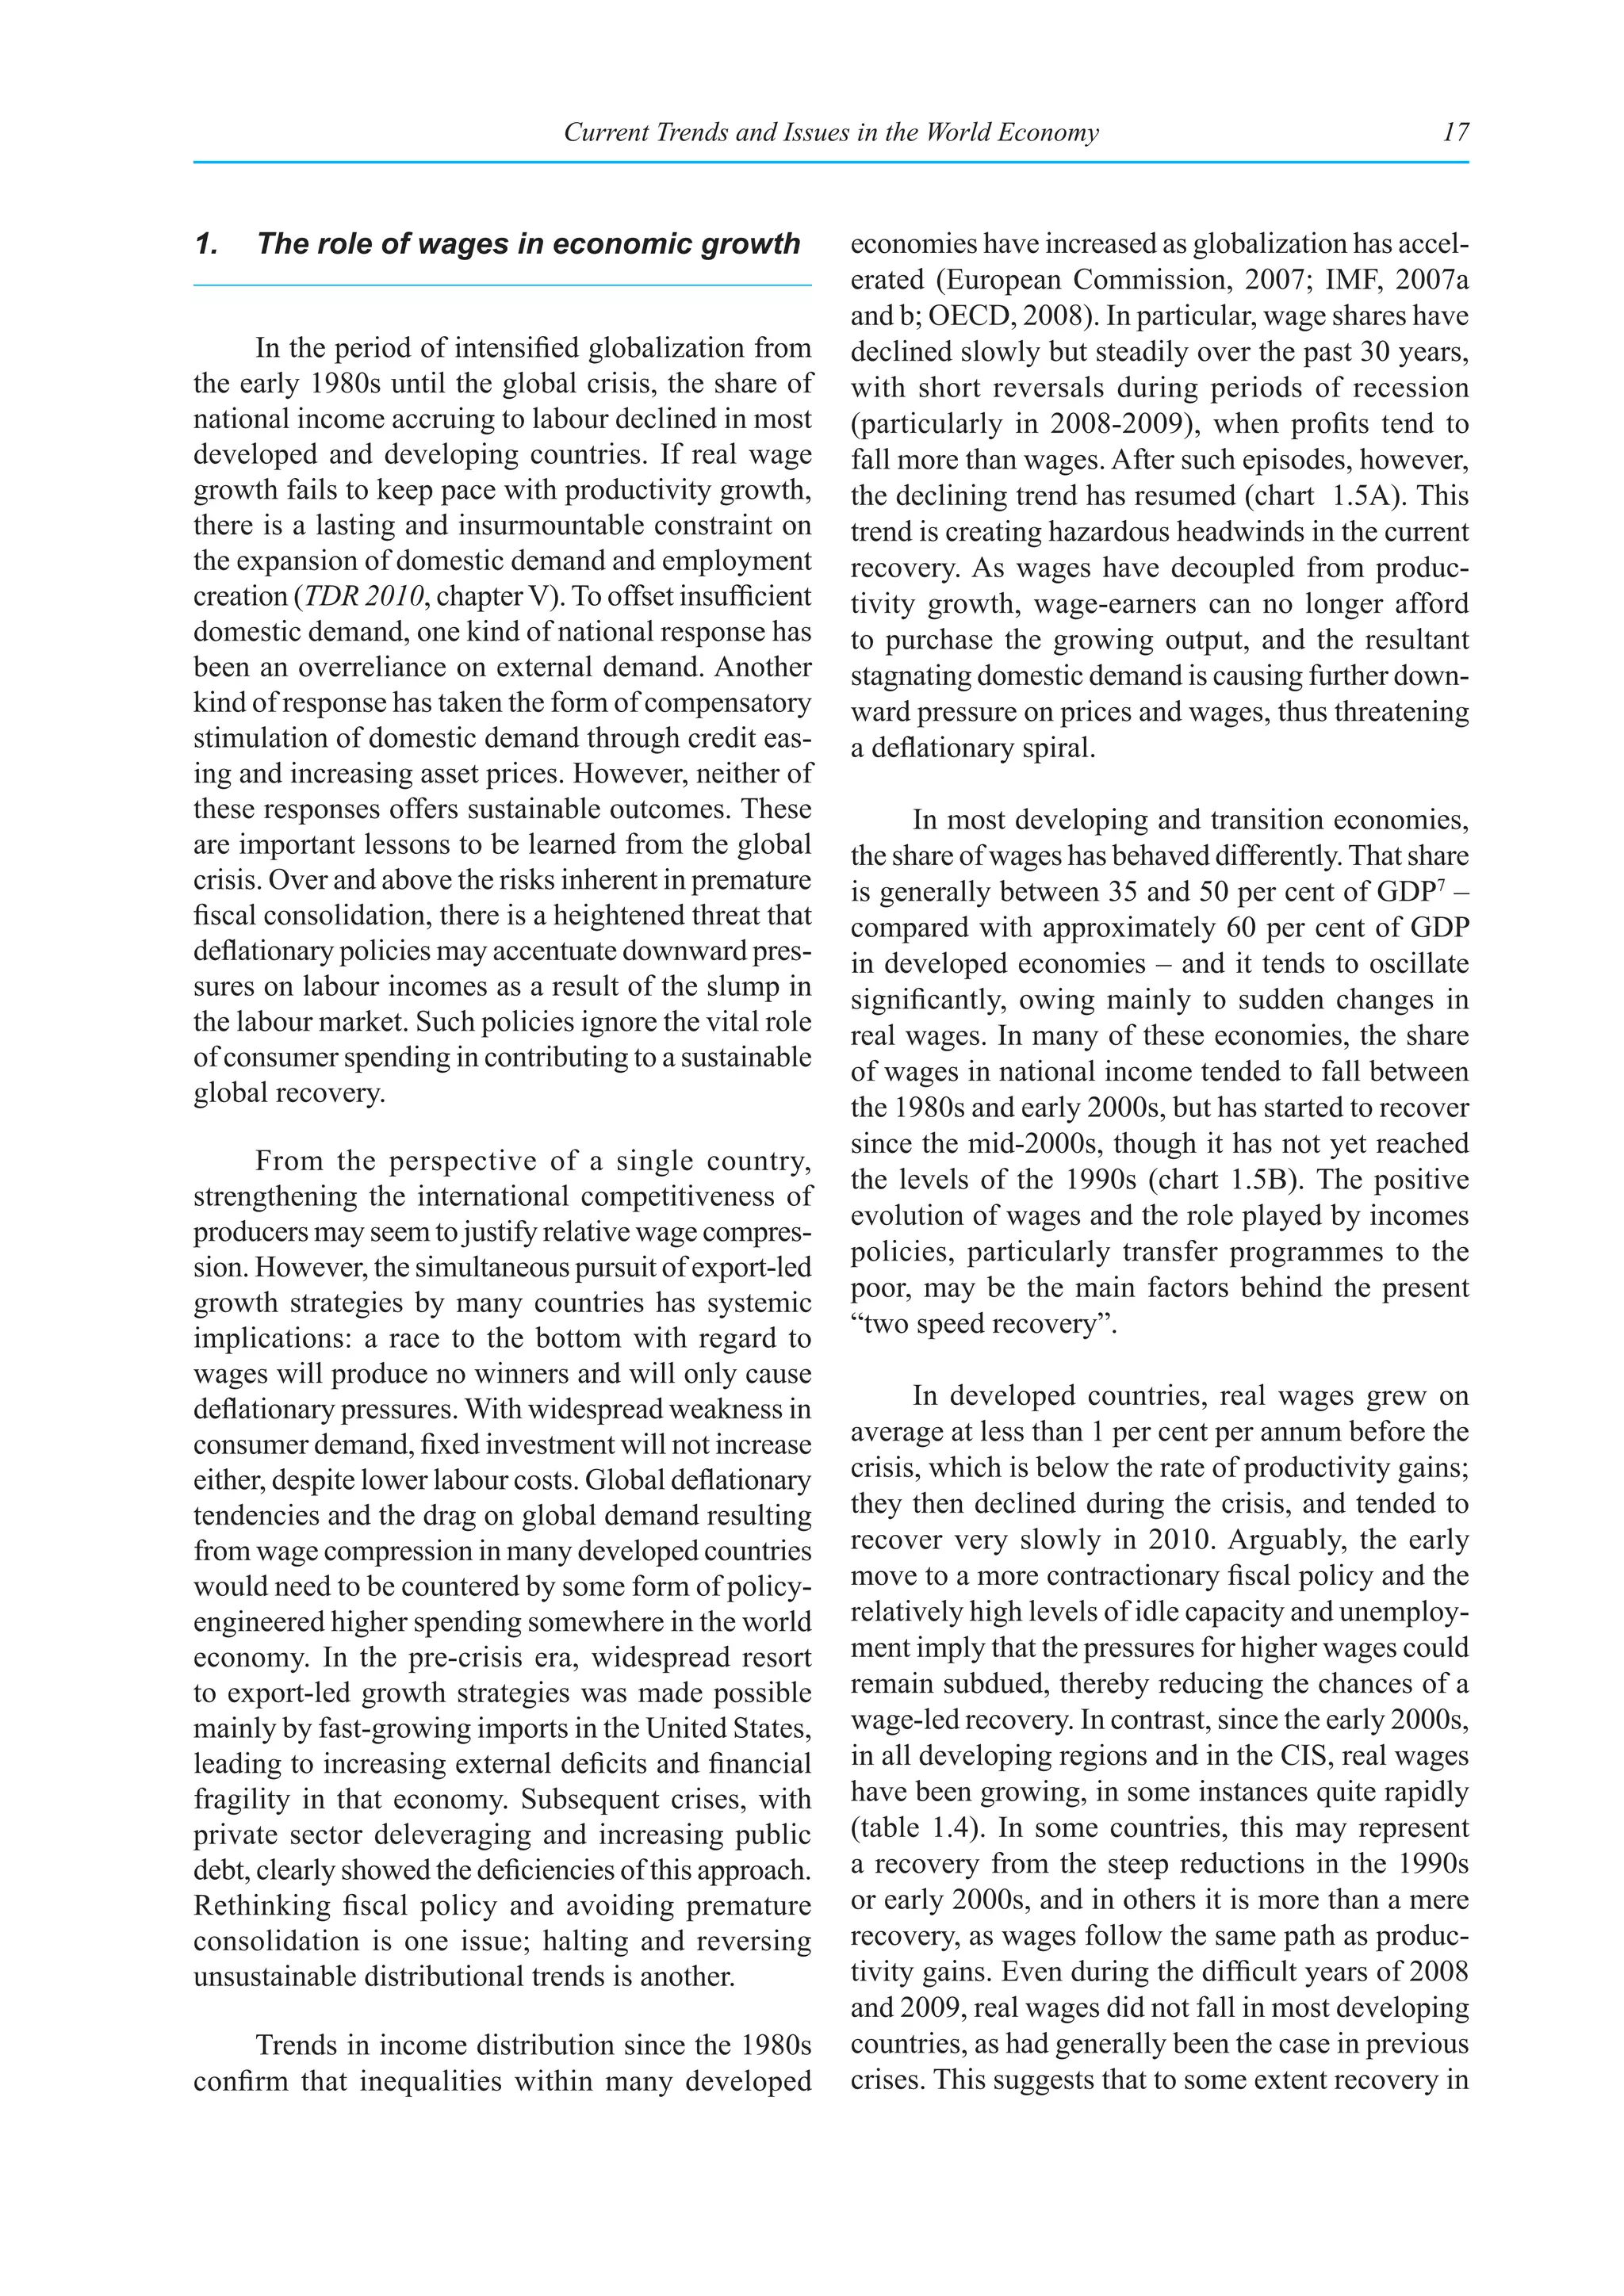
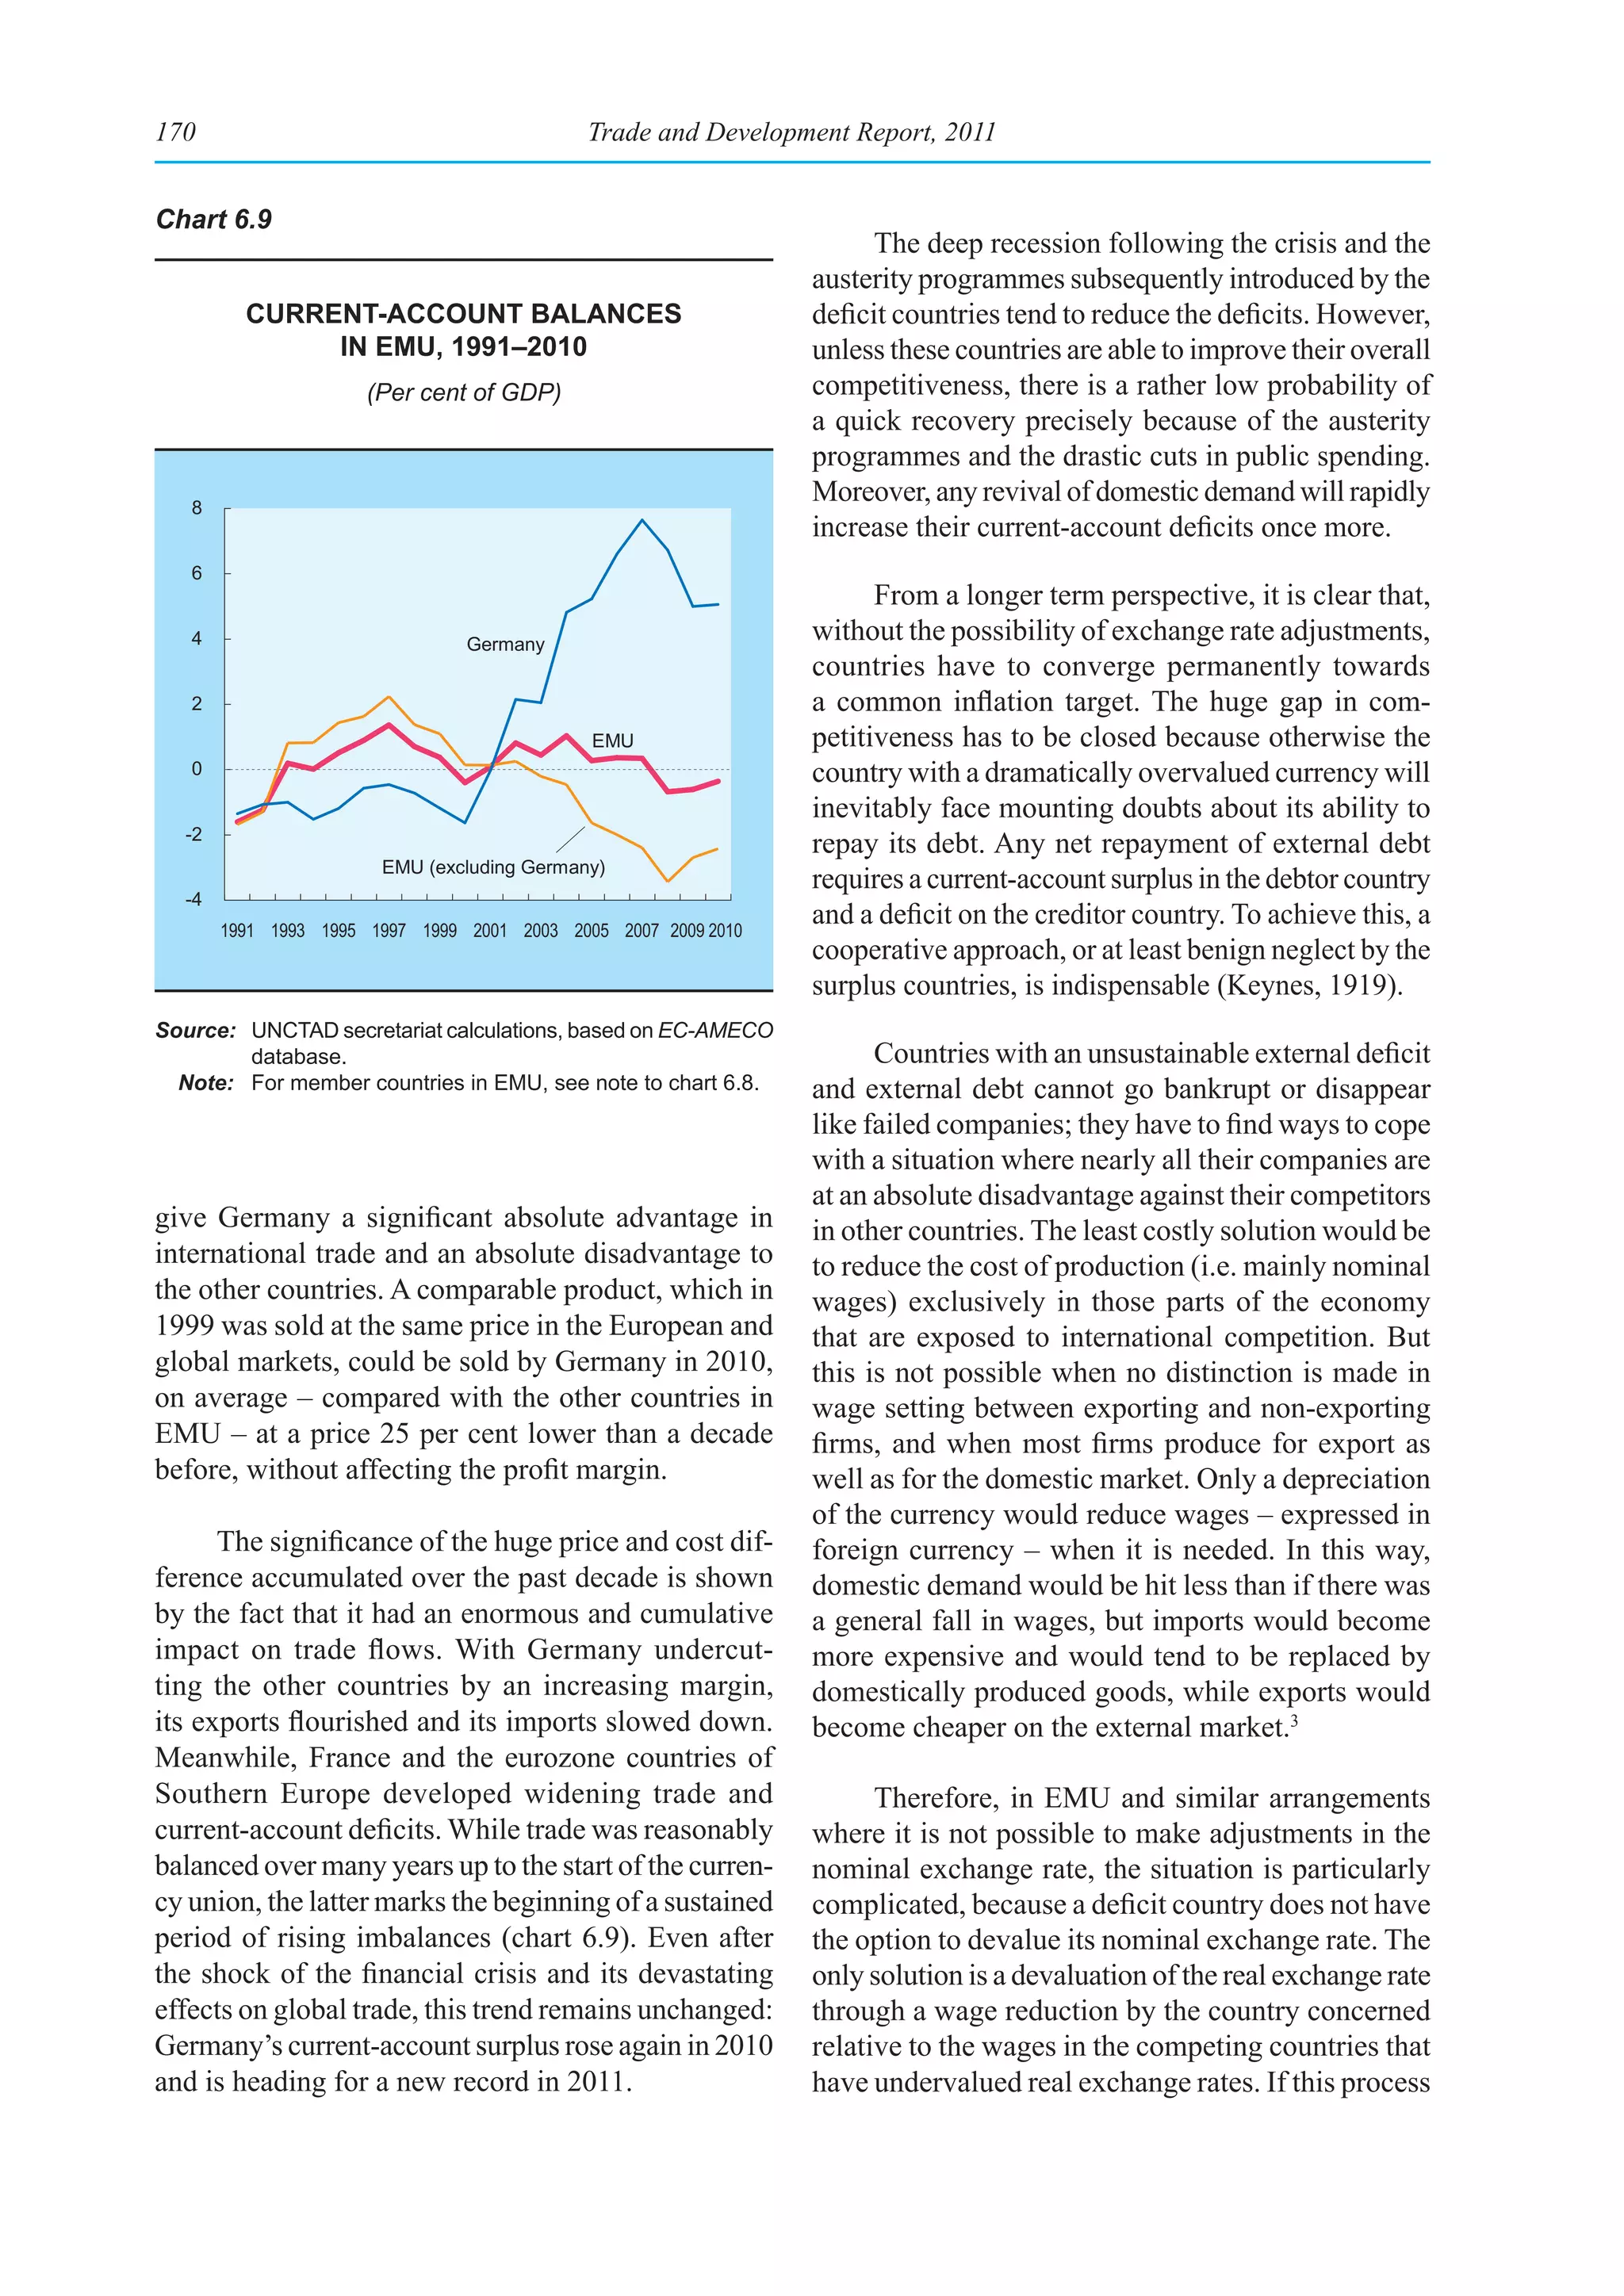
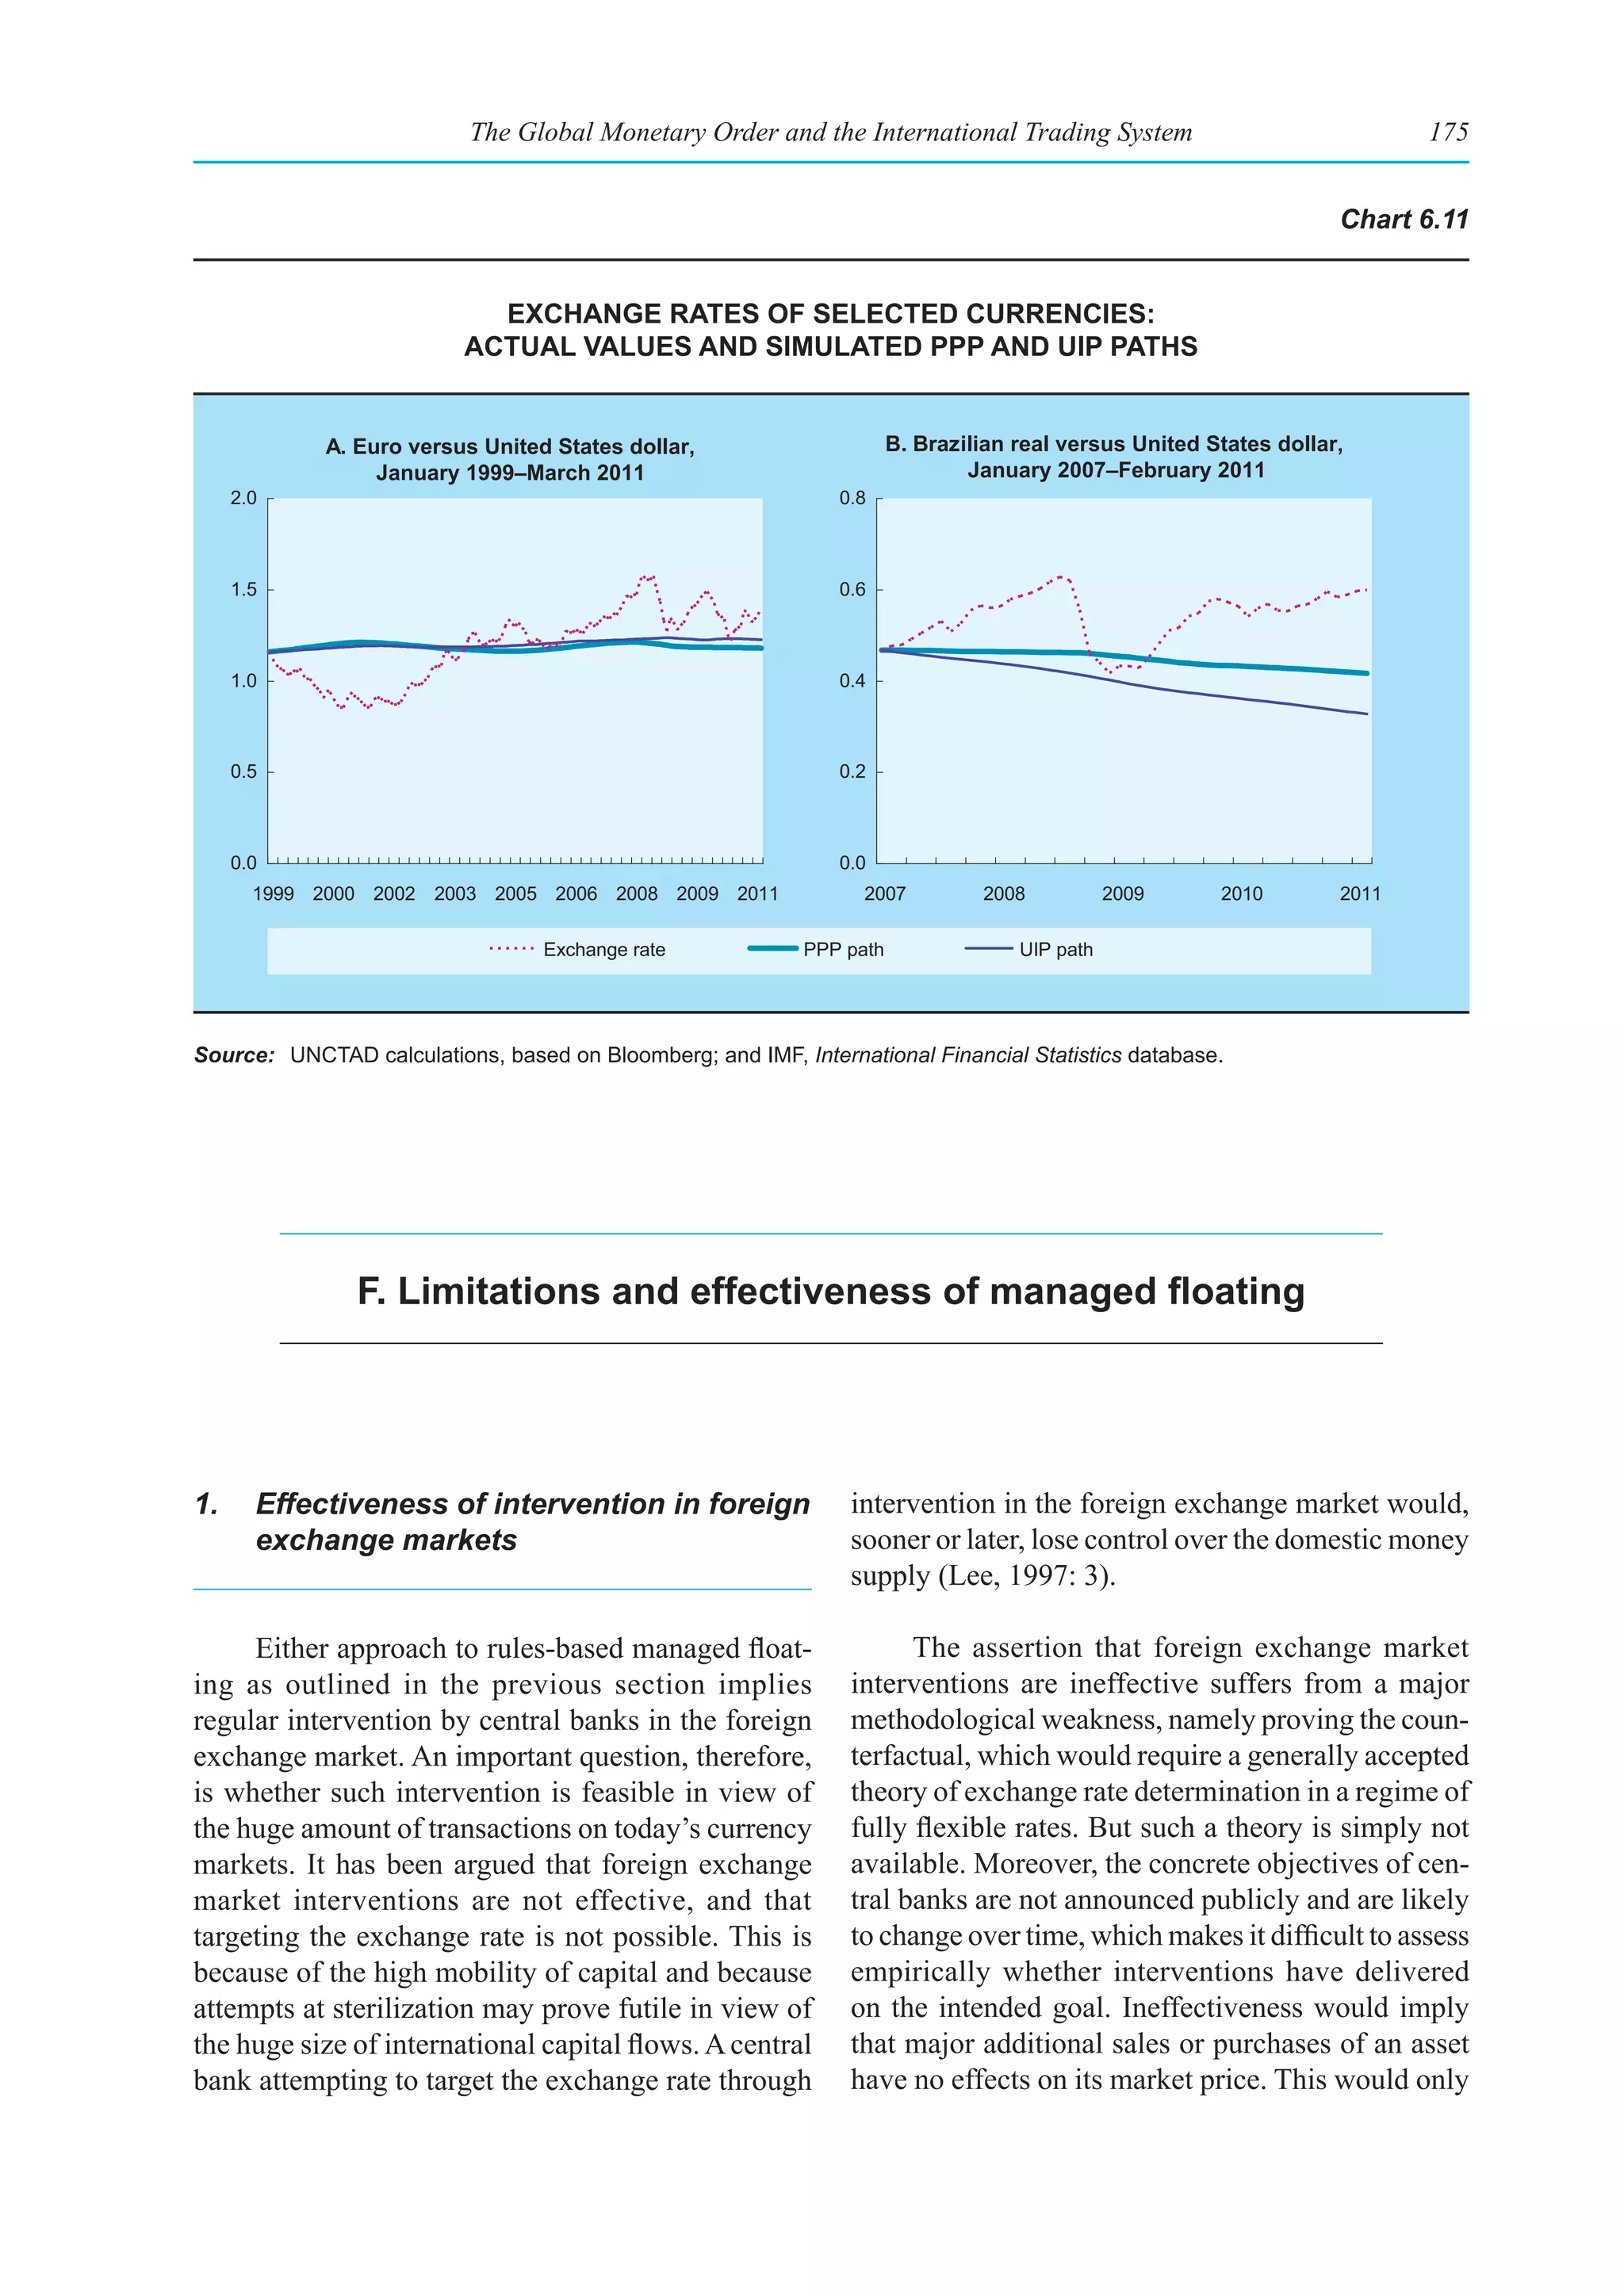
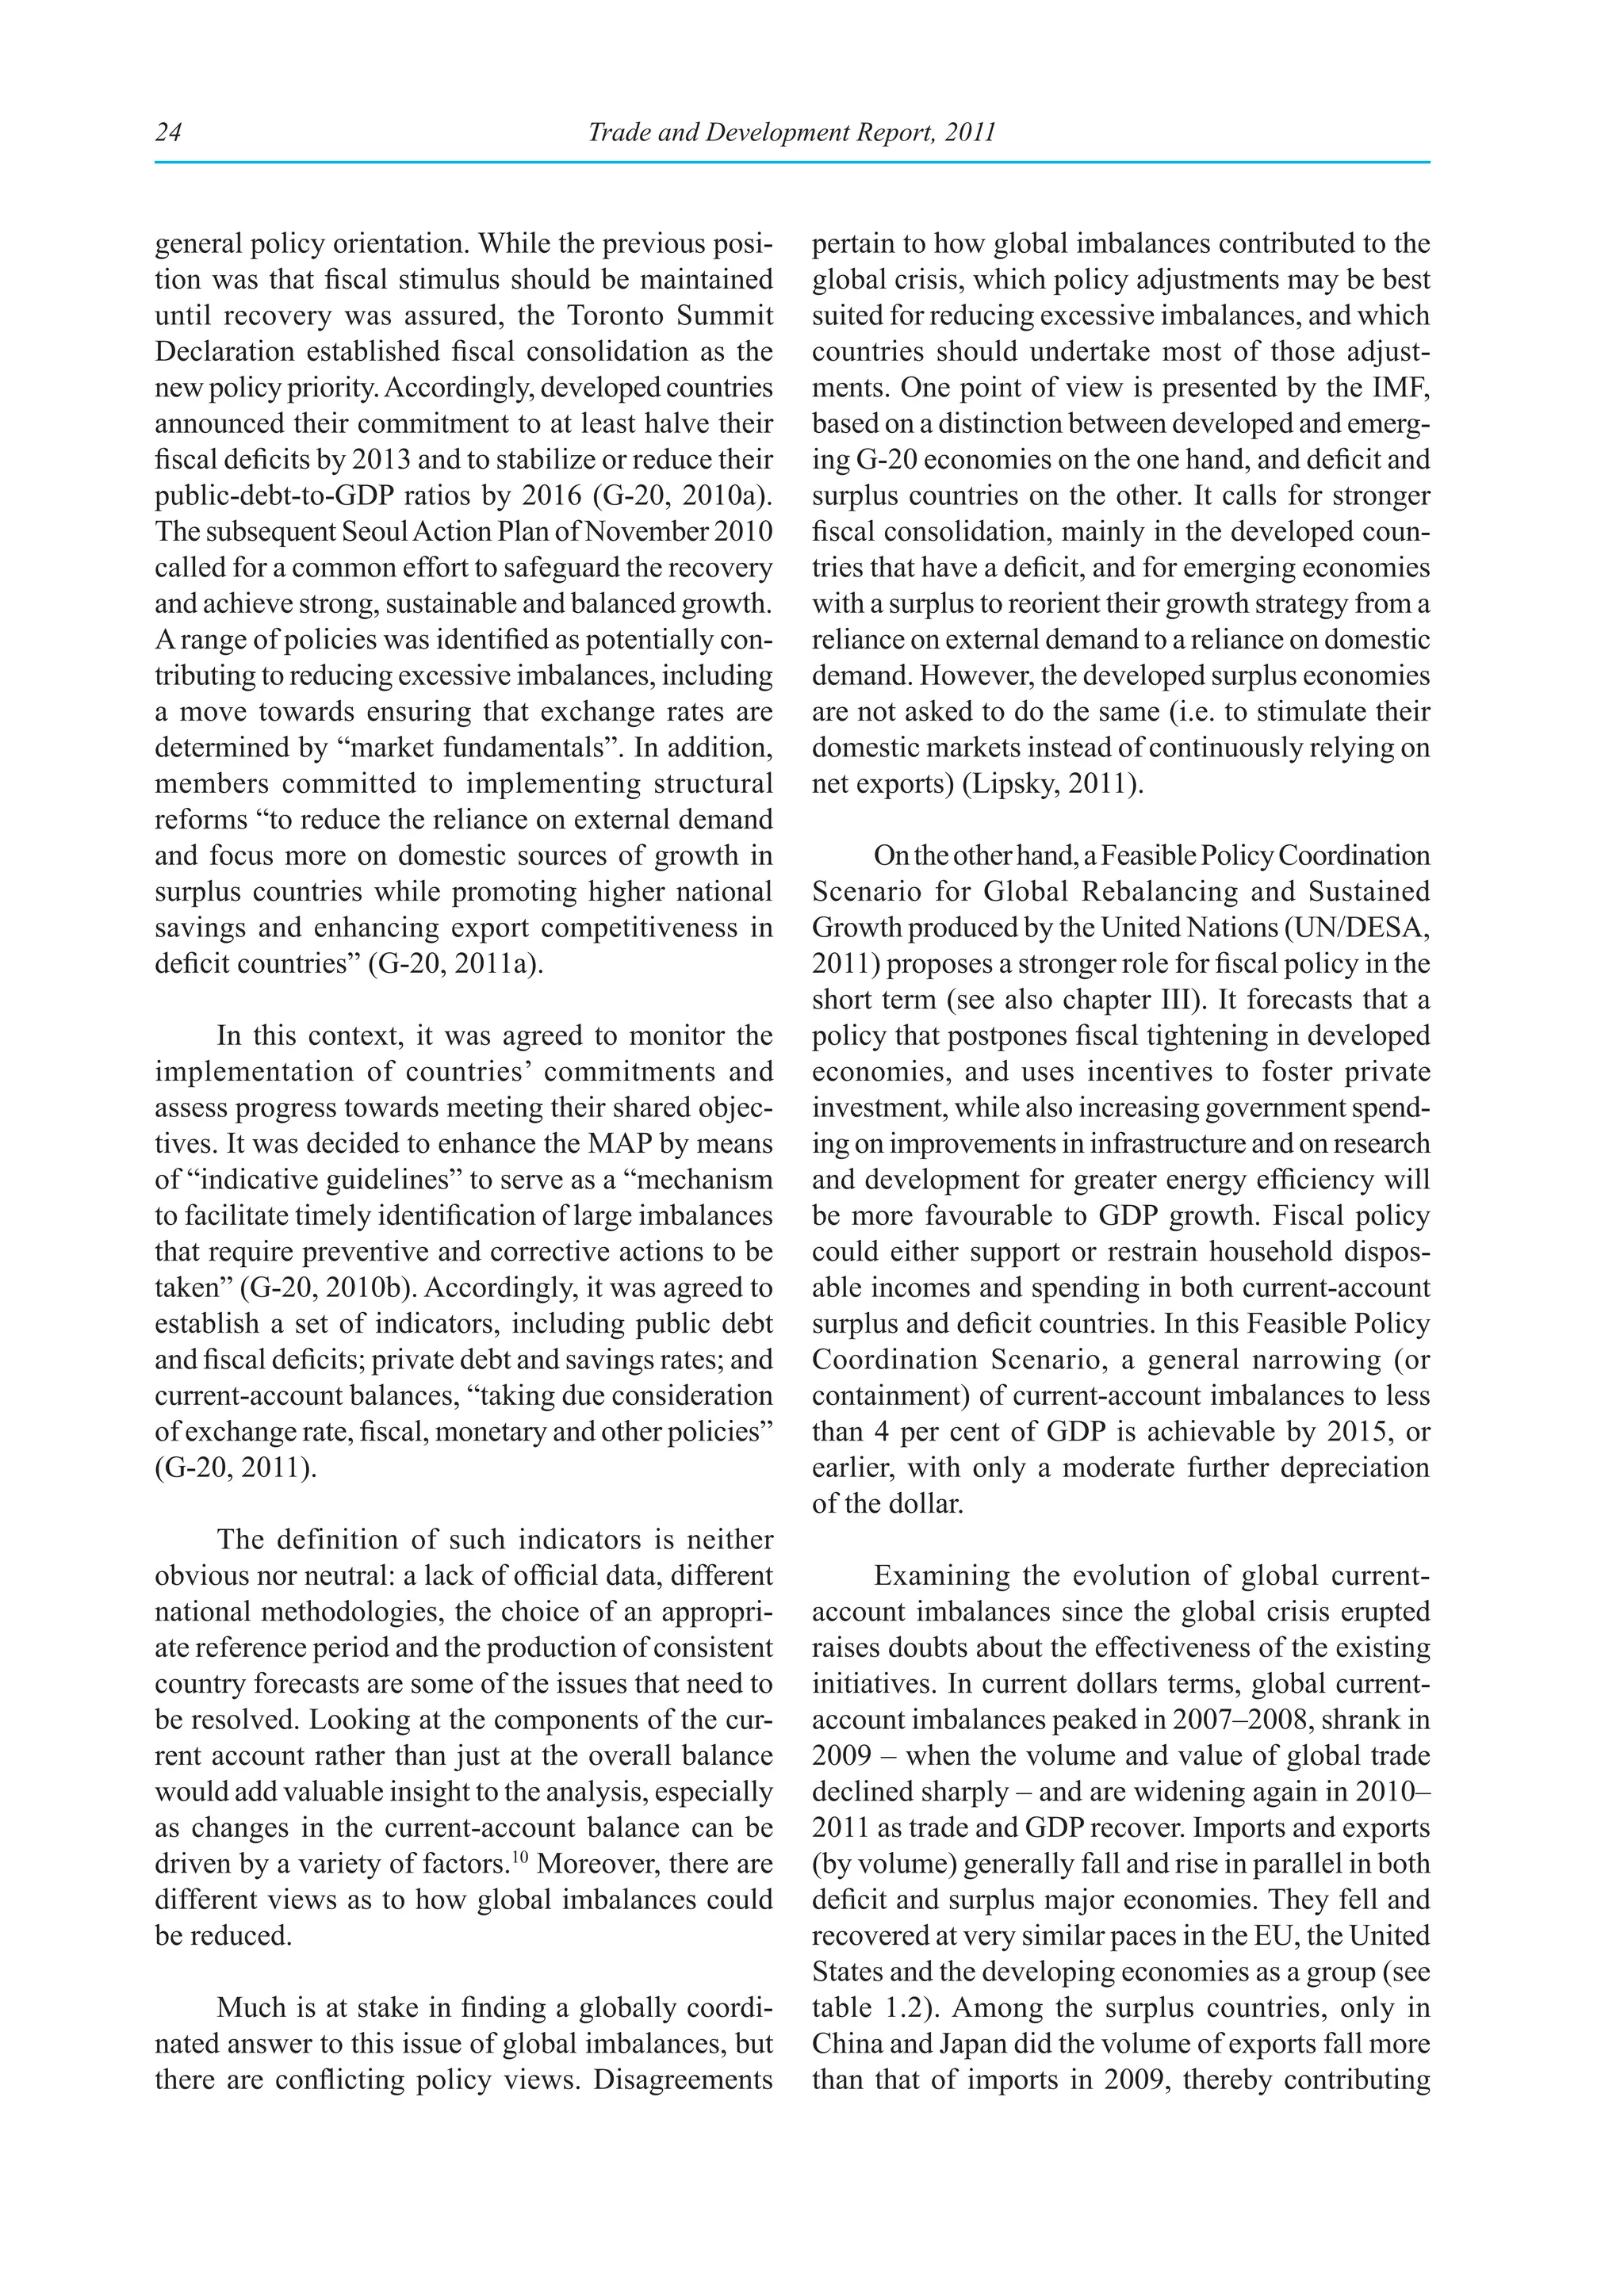
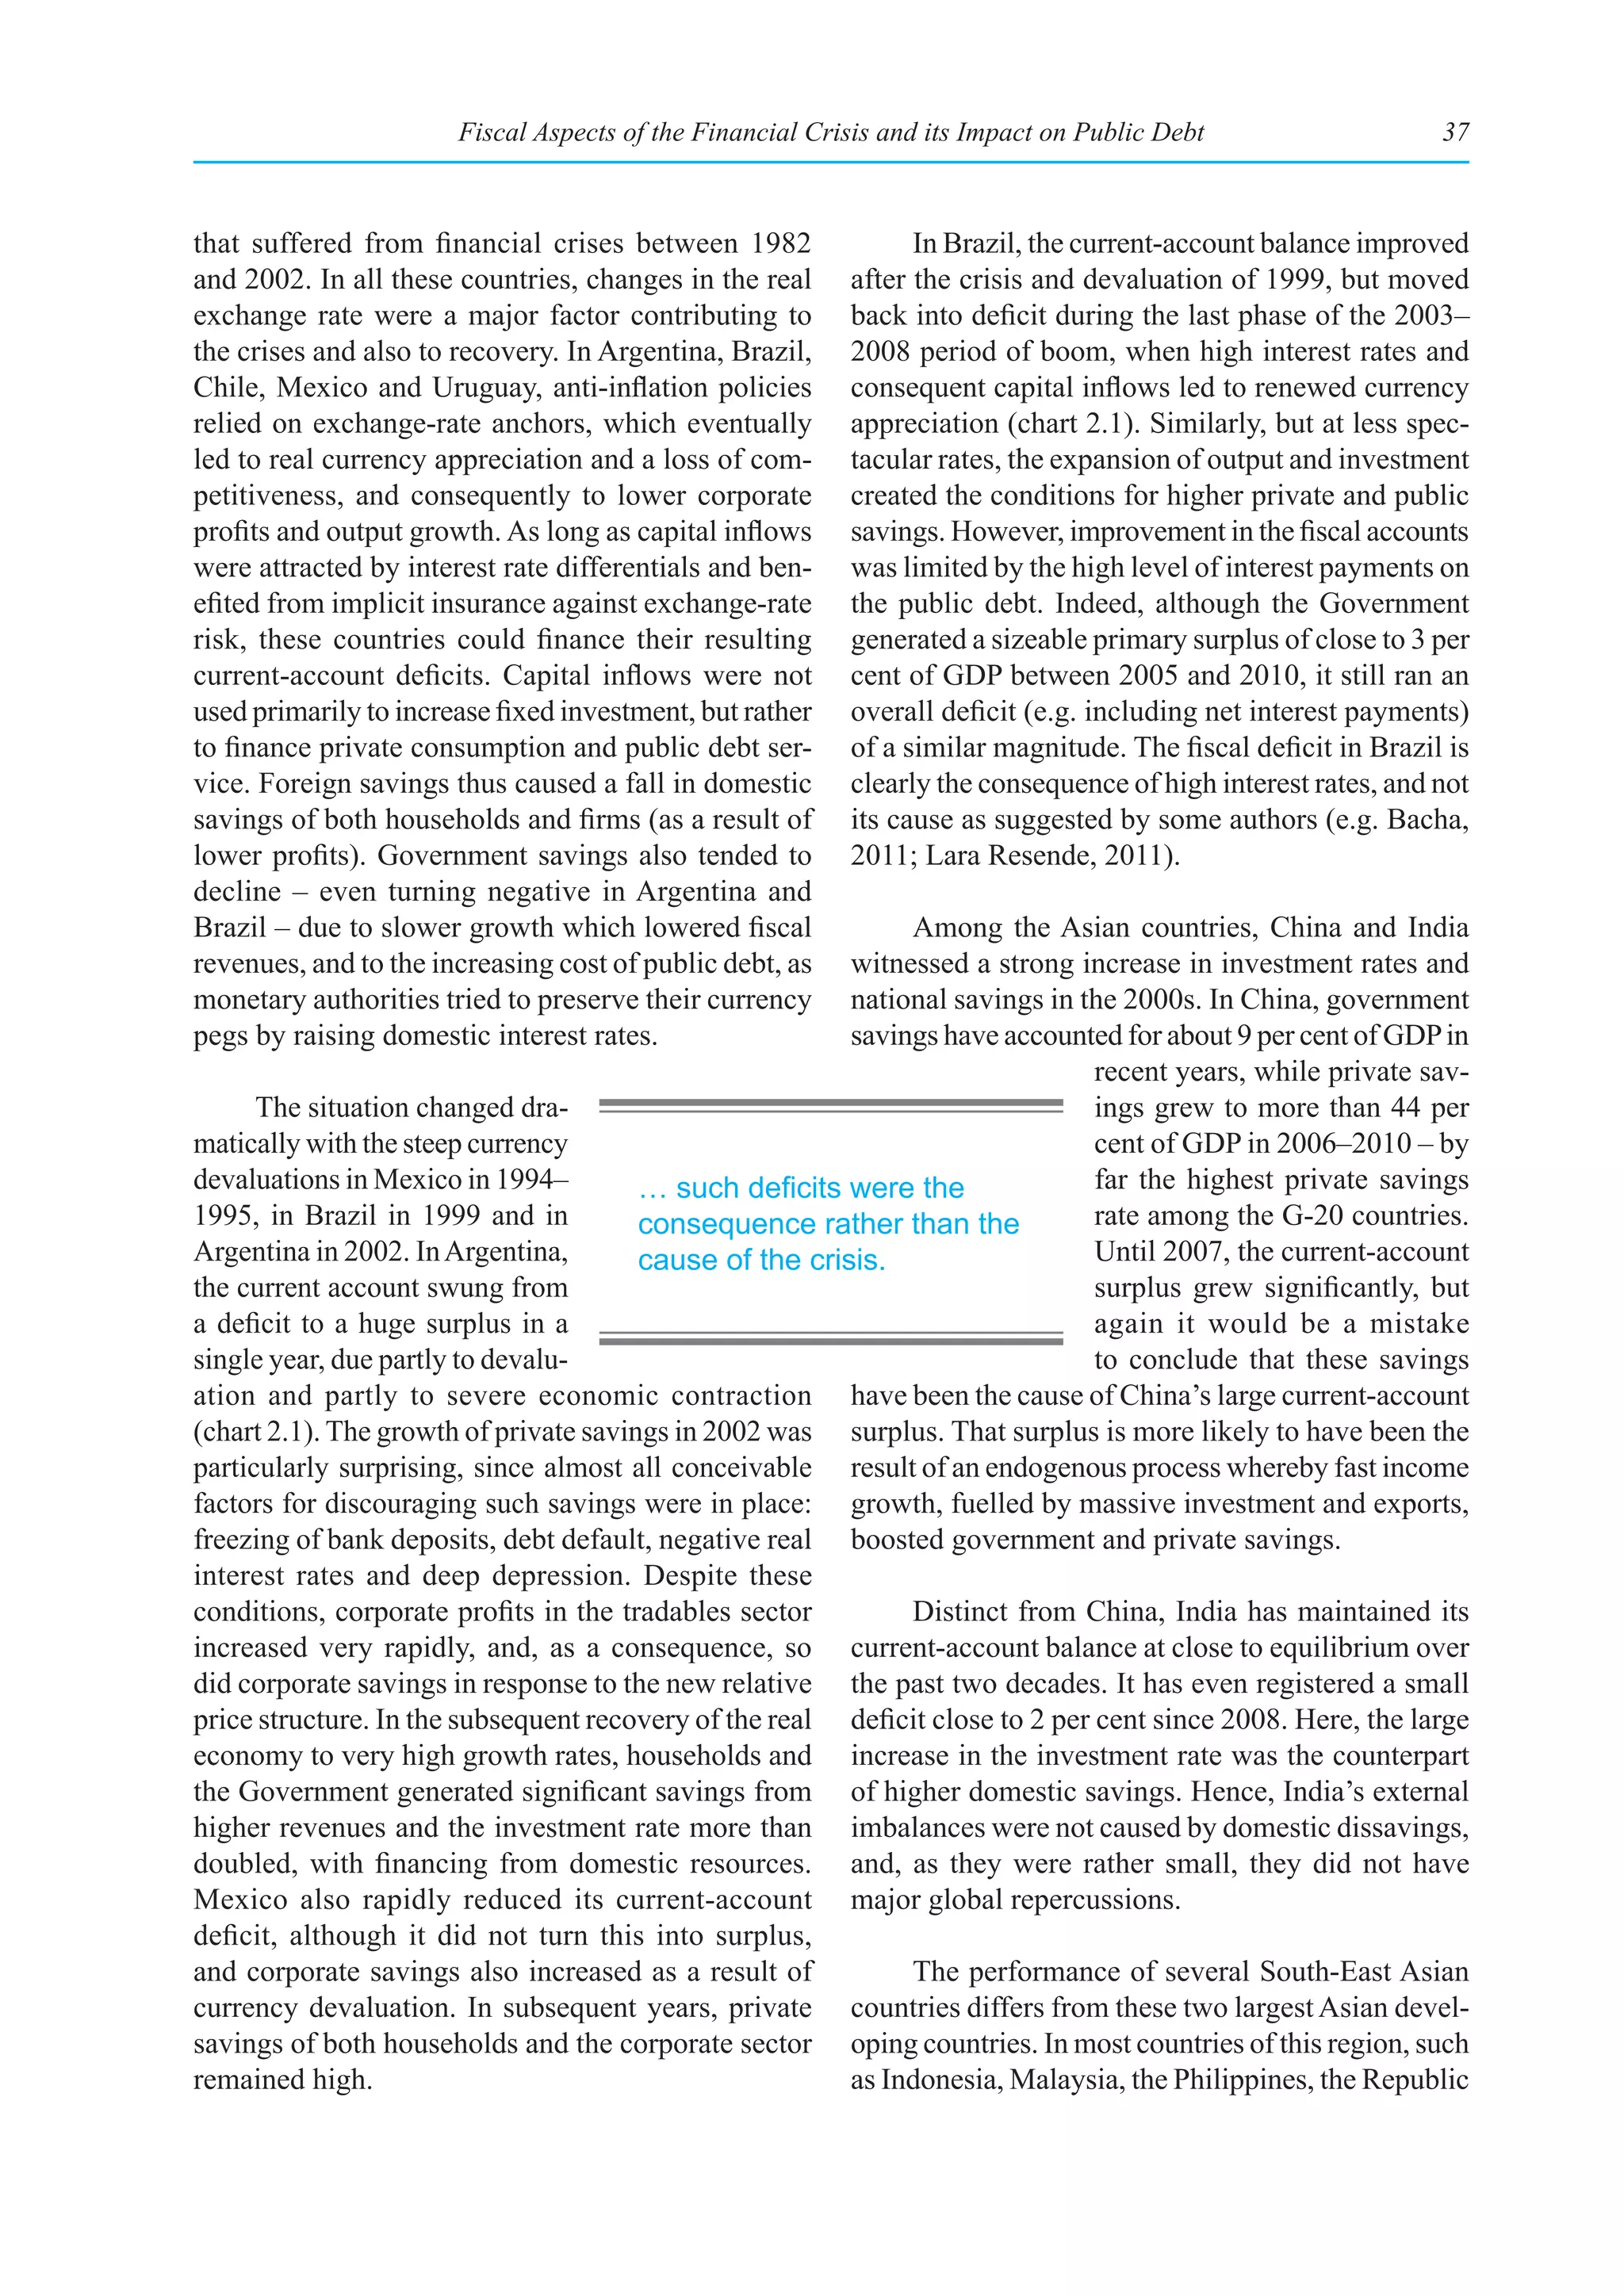
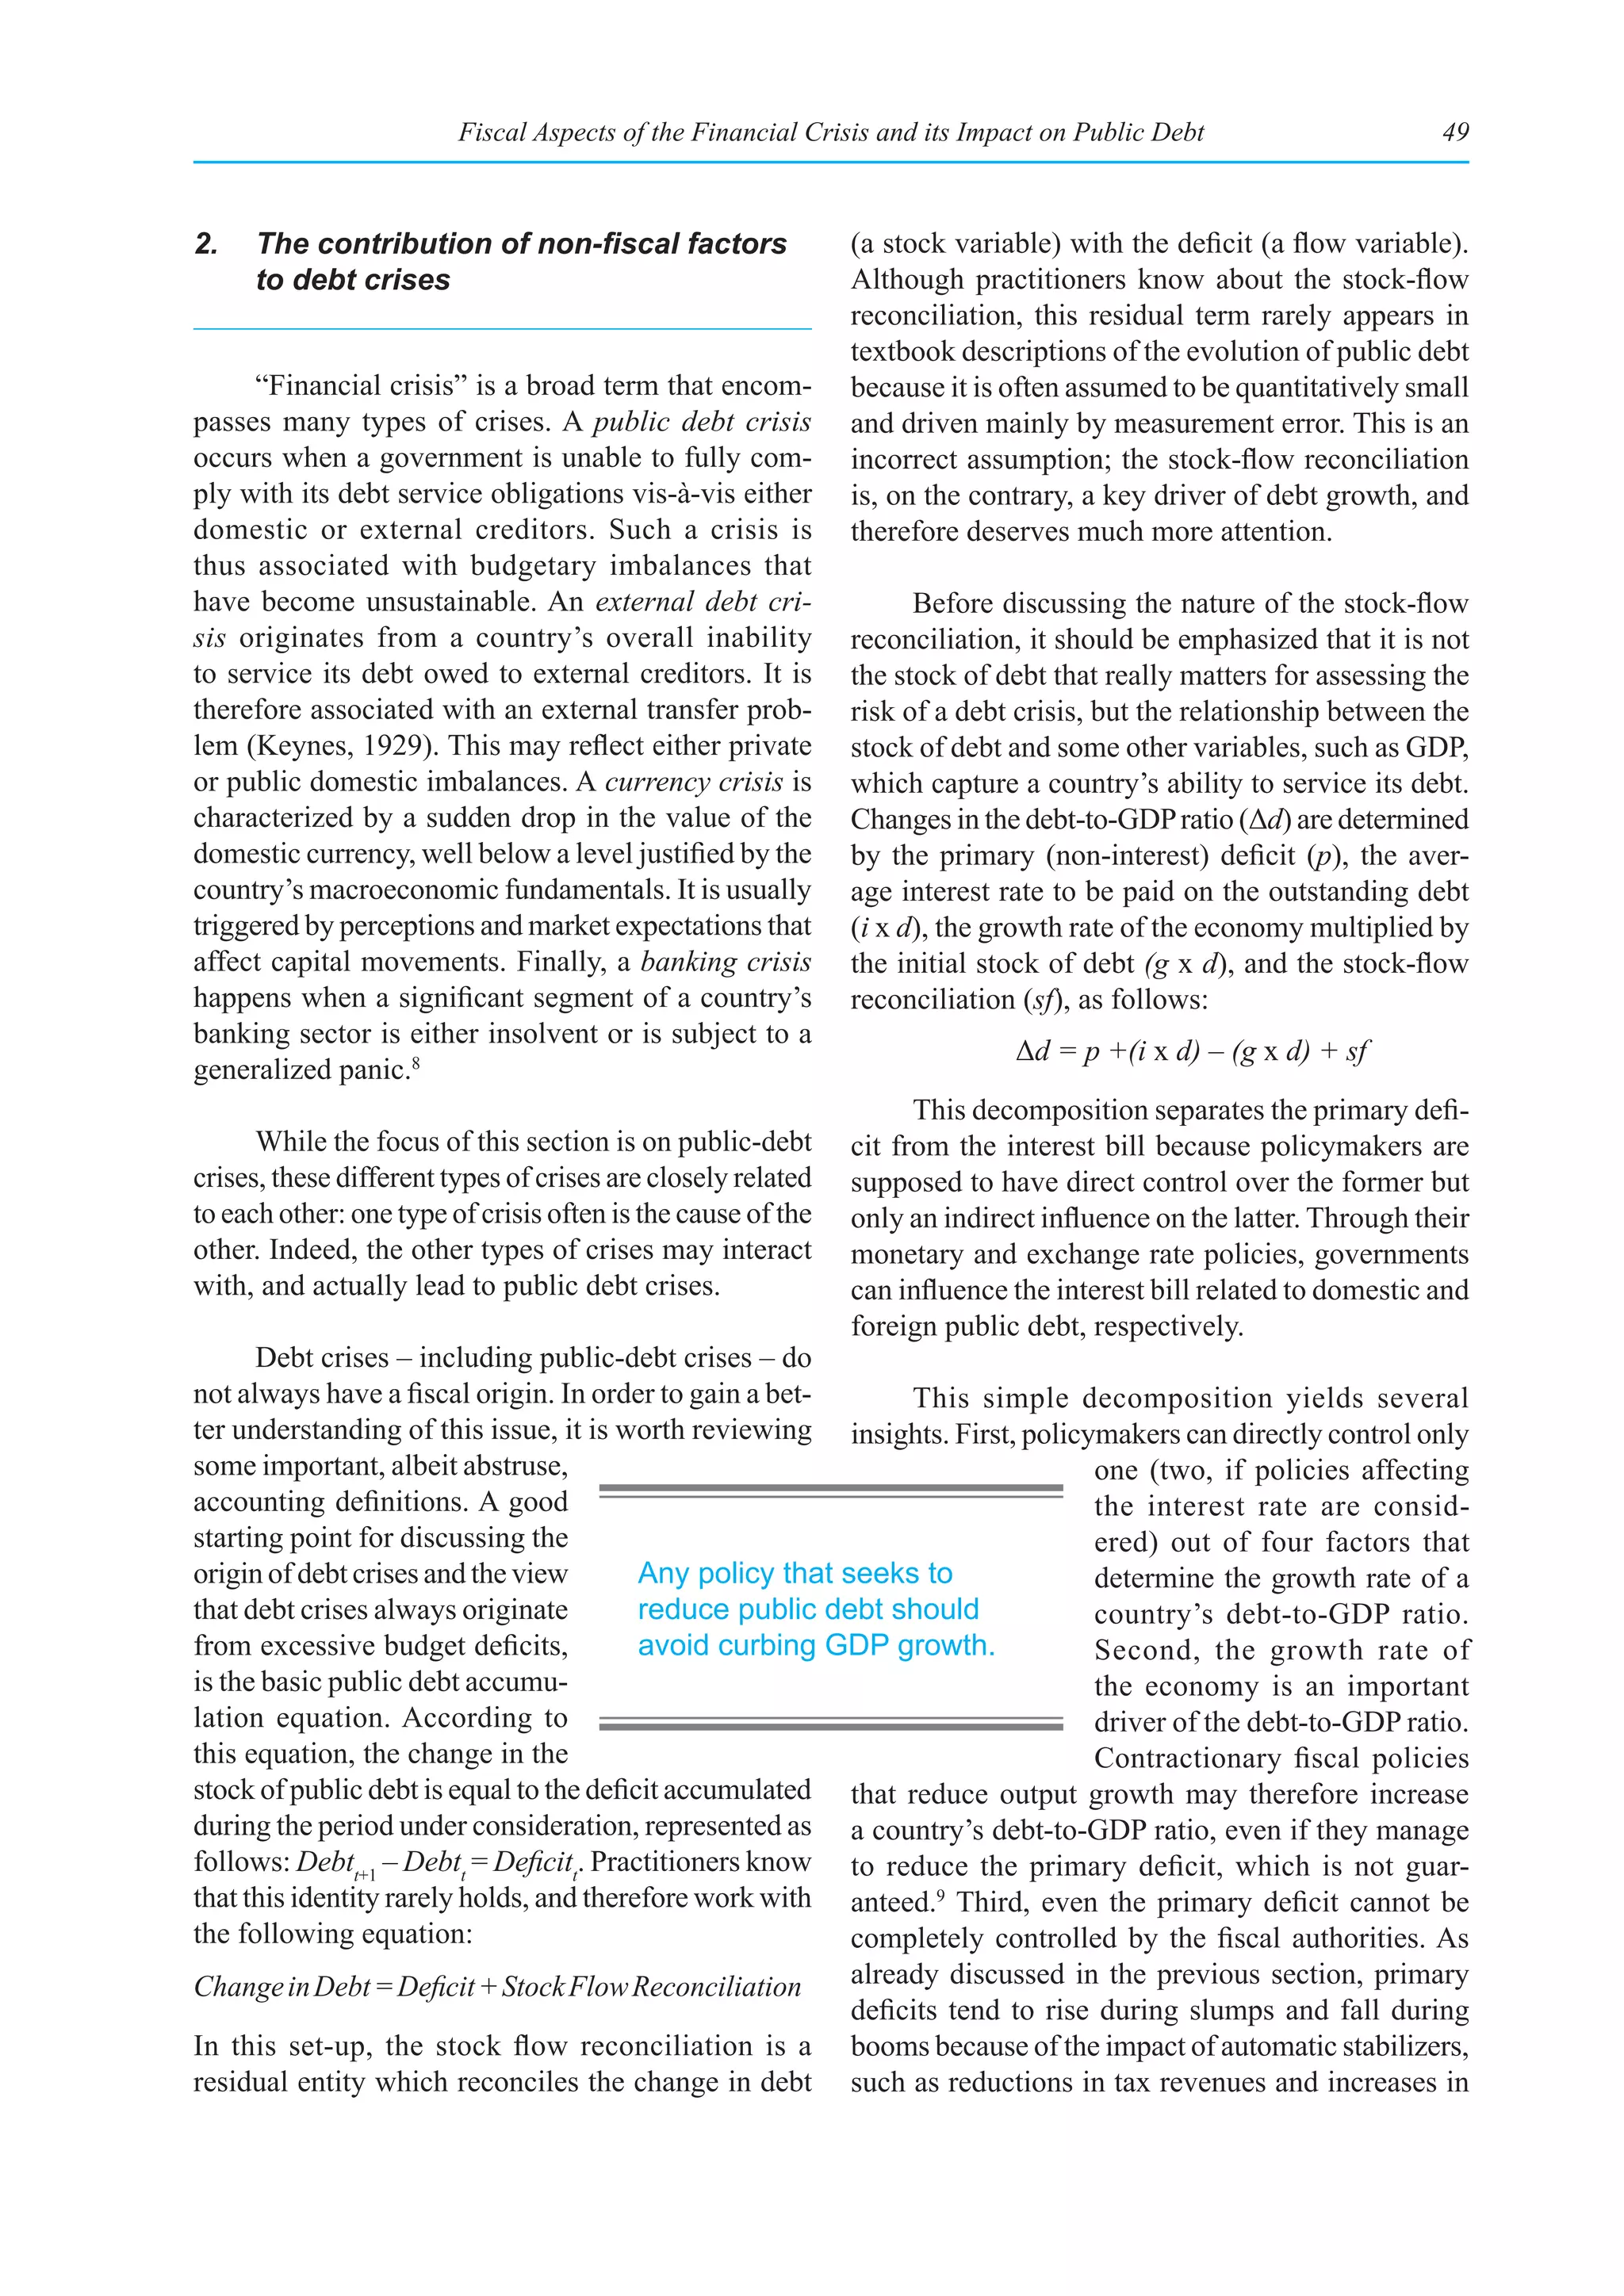
![Current Trends and Issues in the World Economy 23
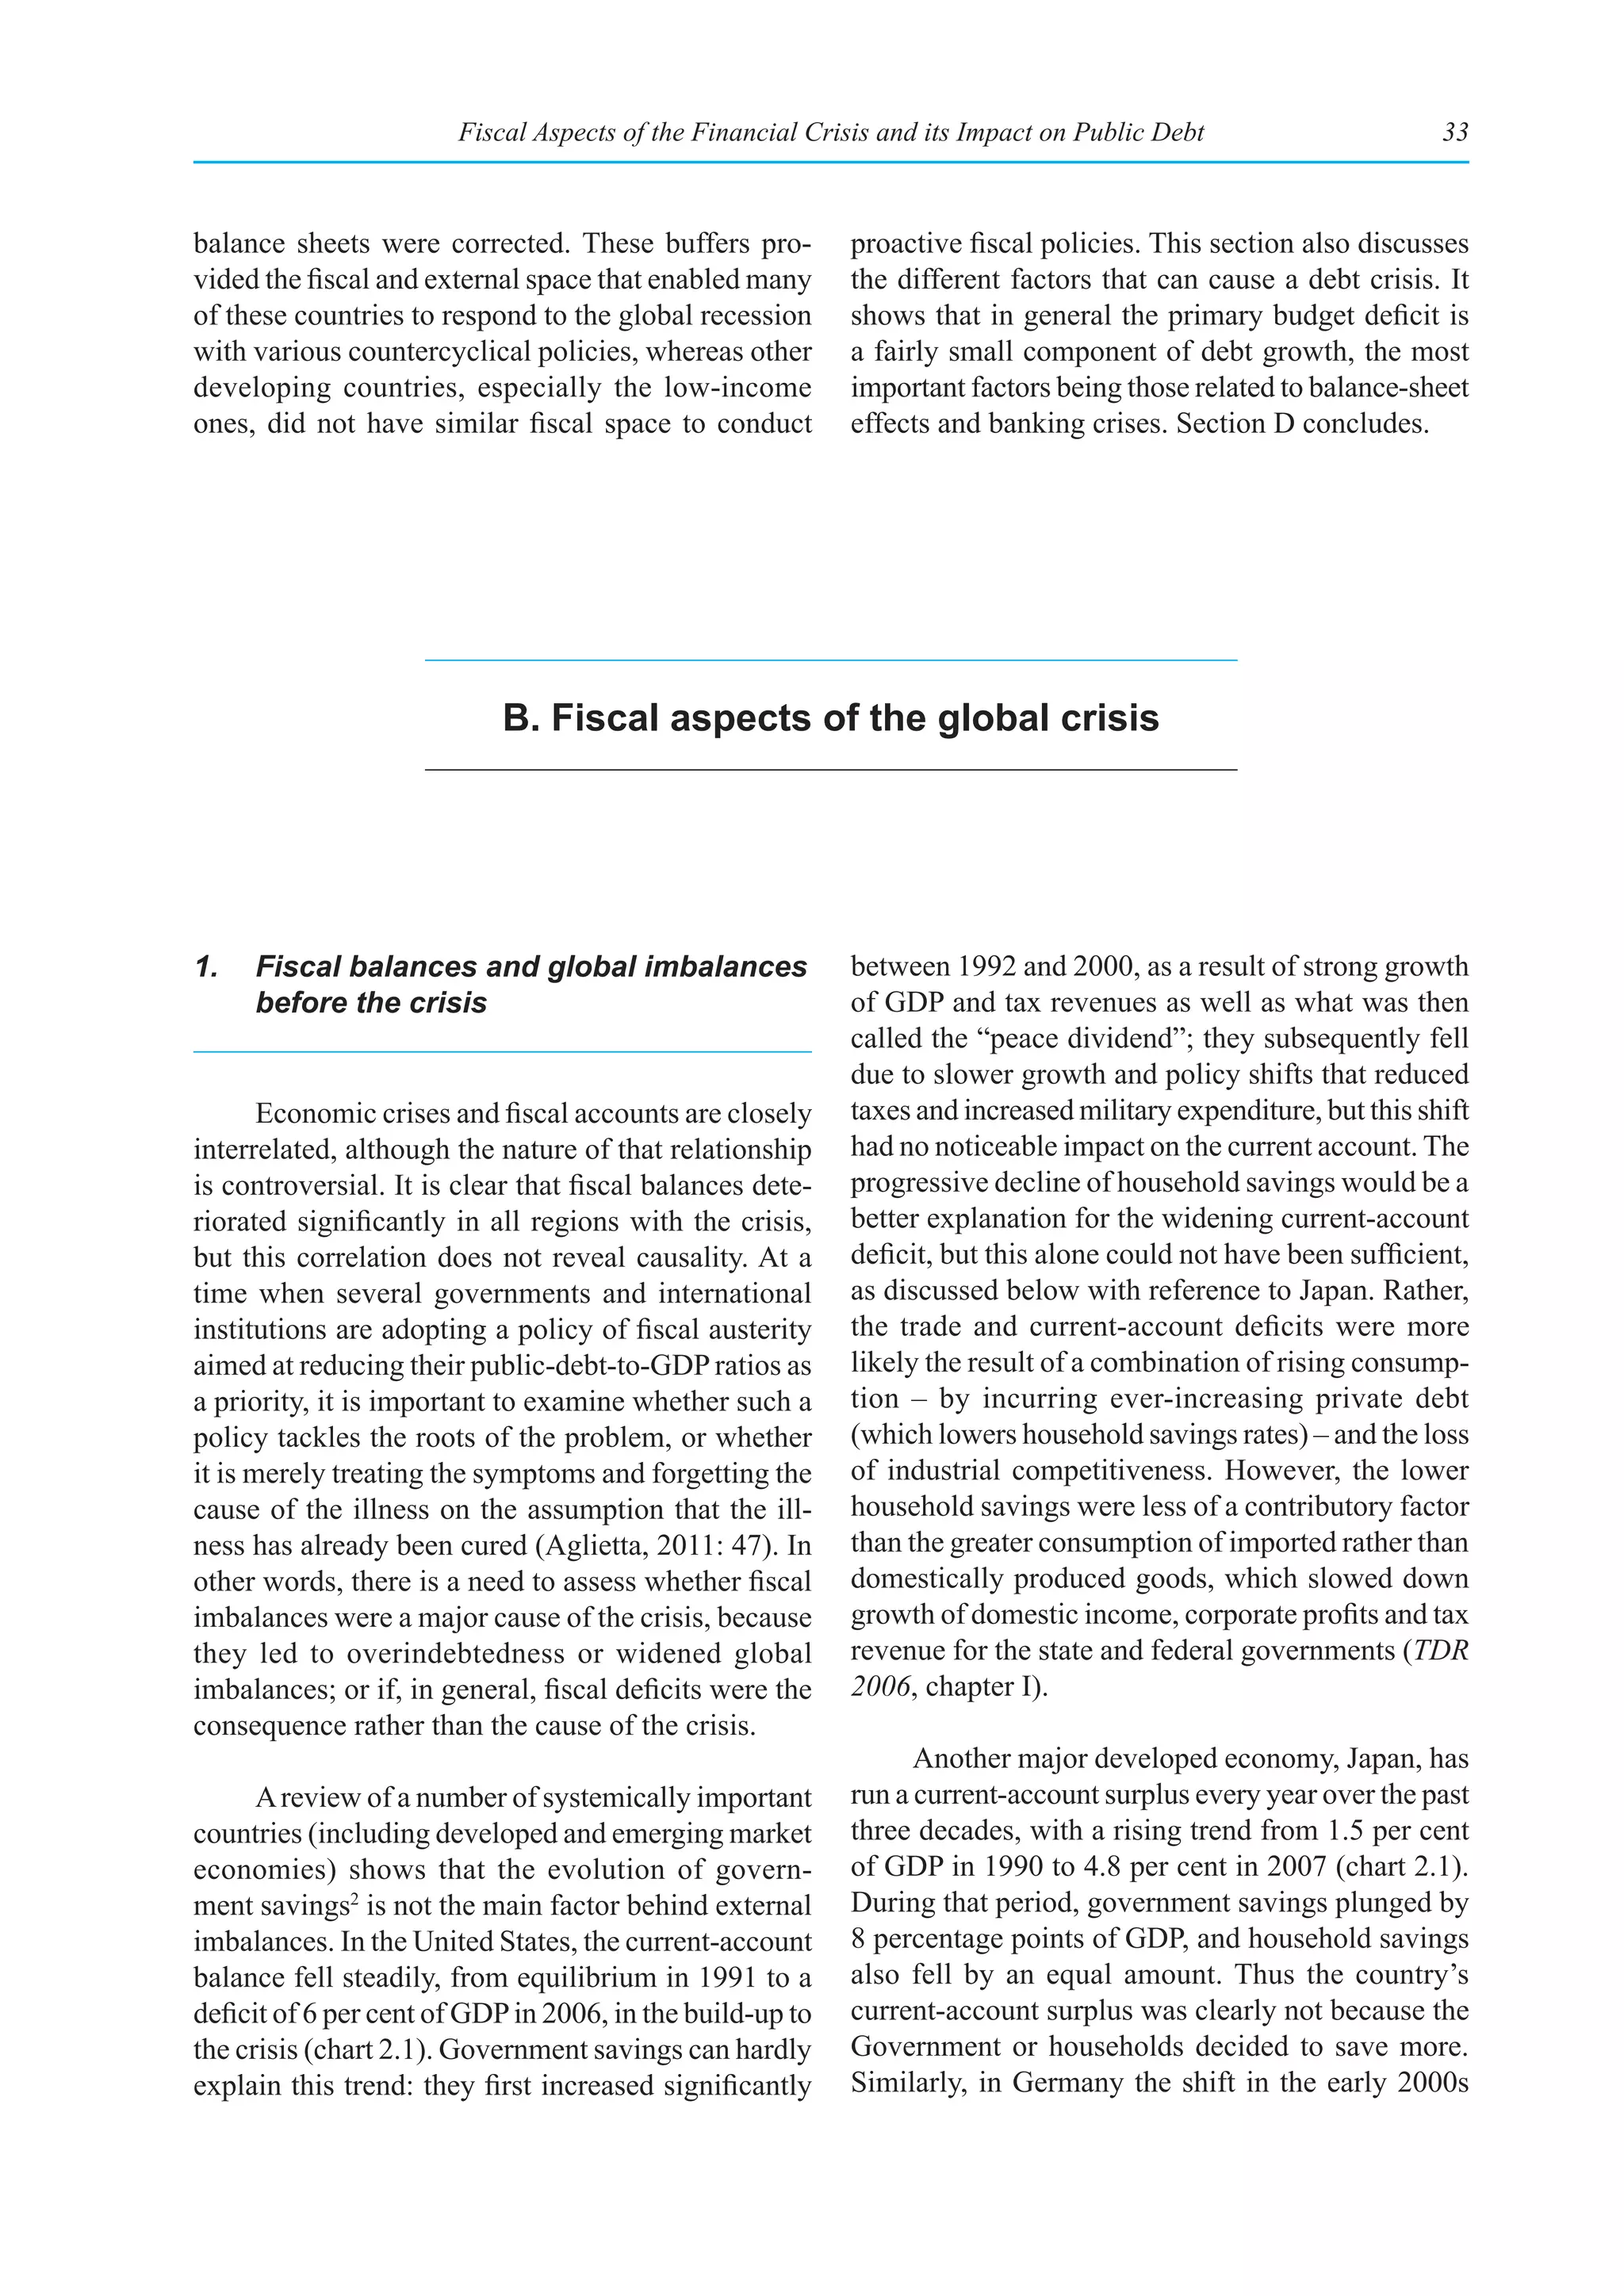
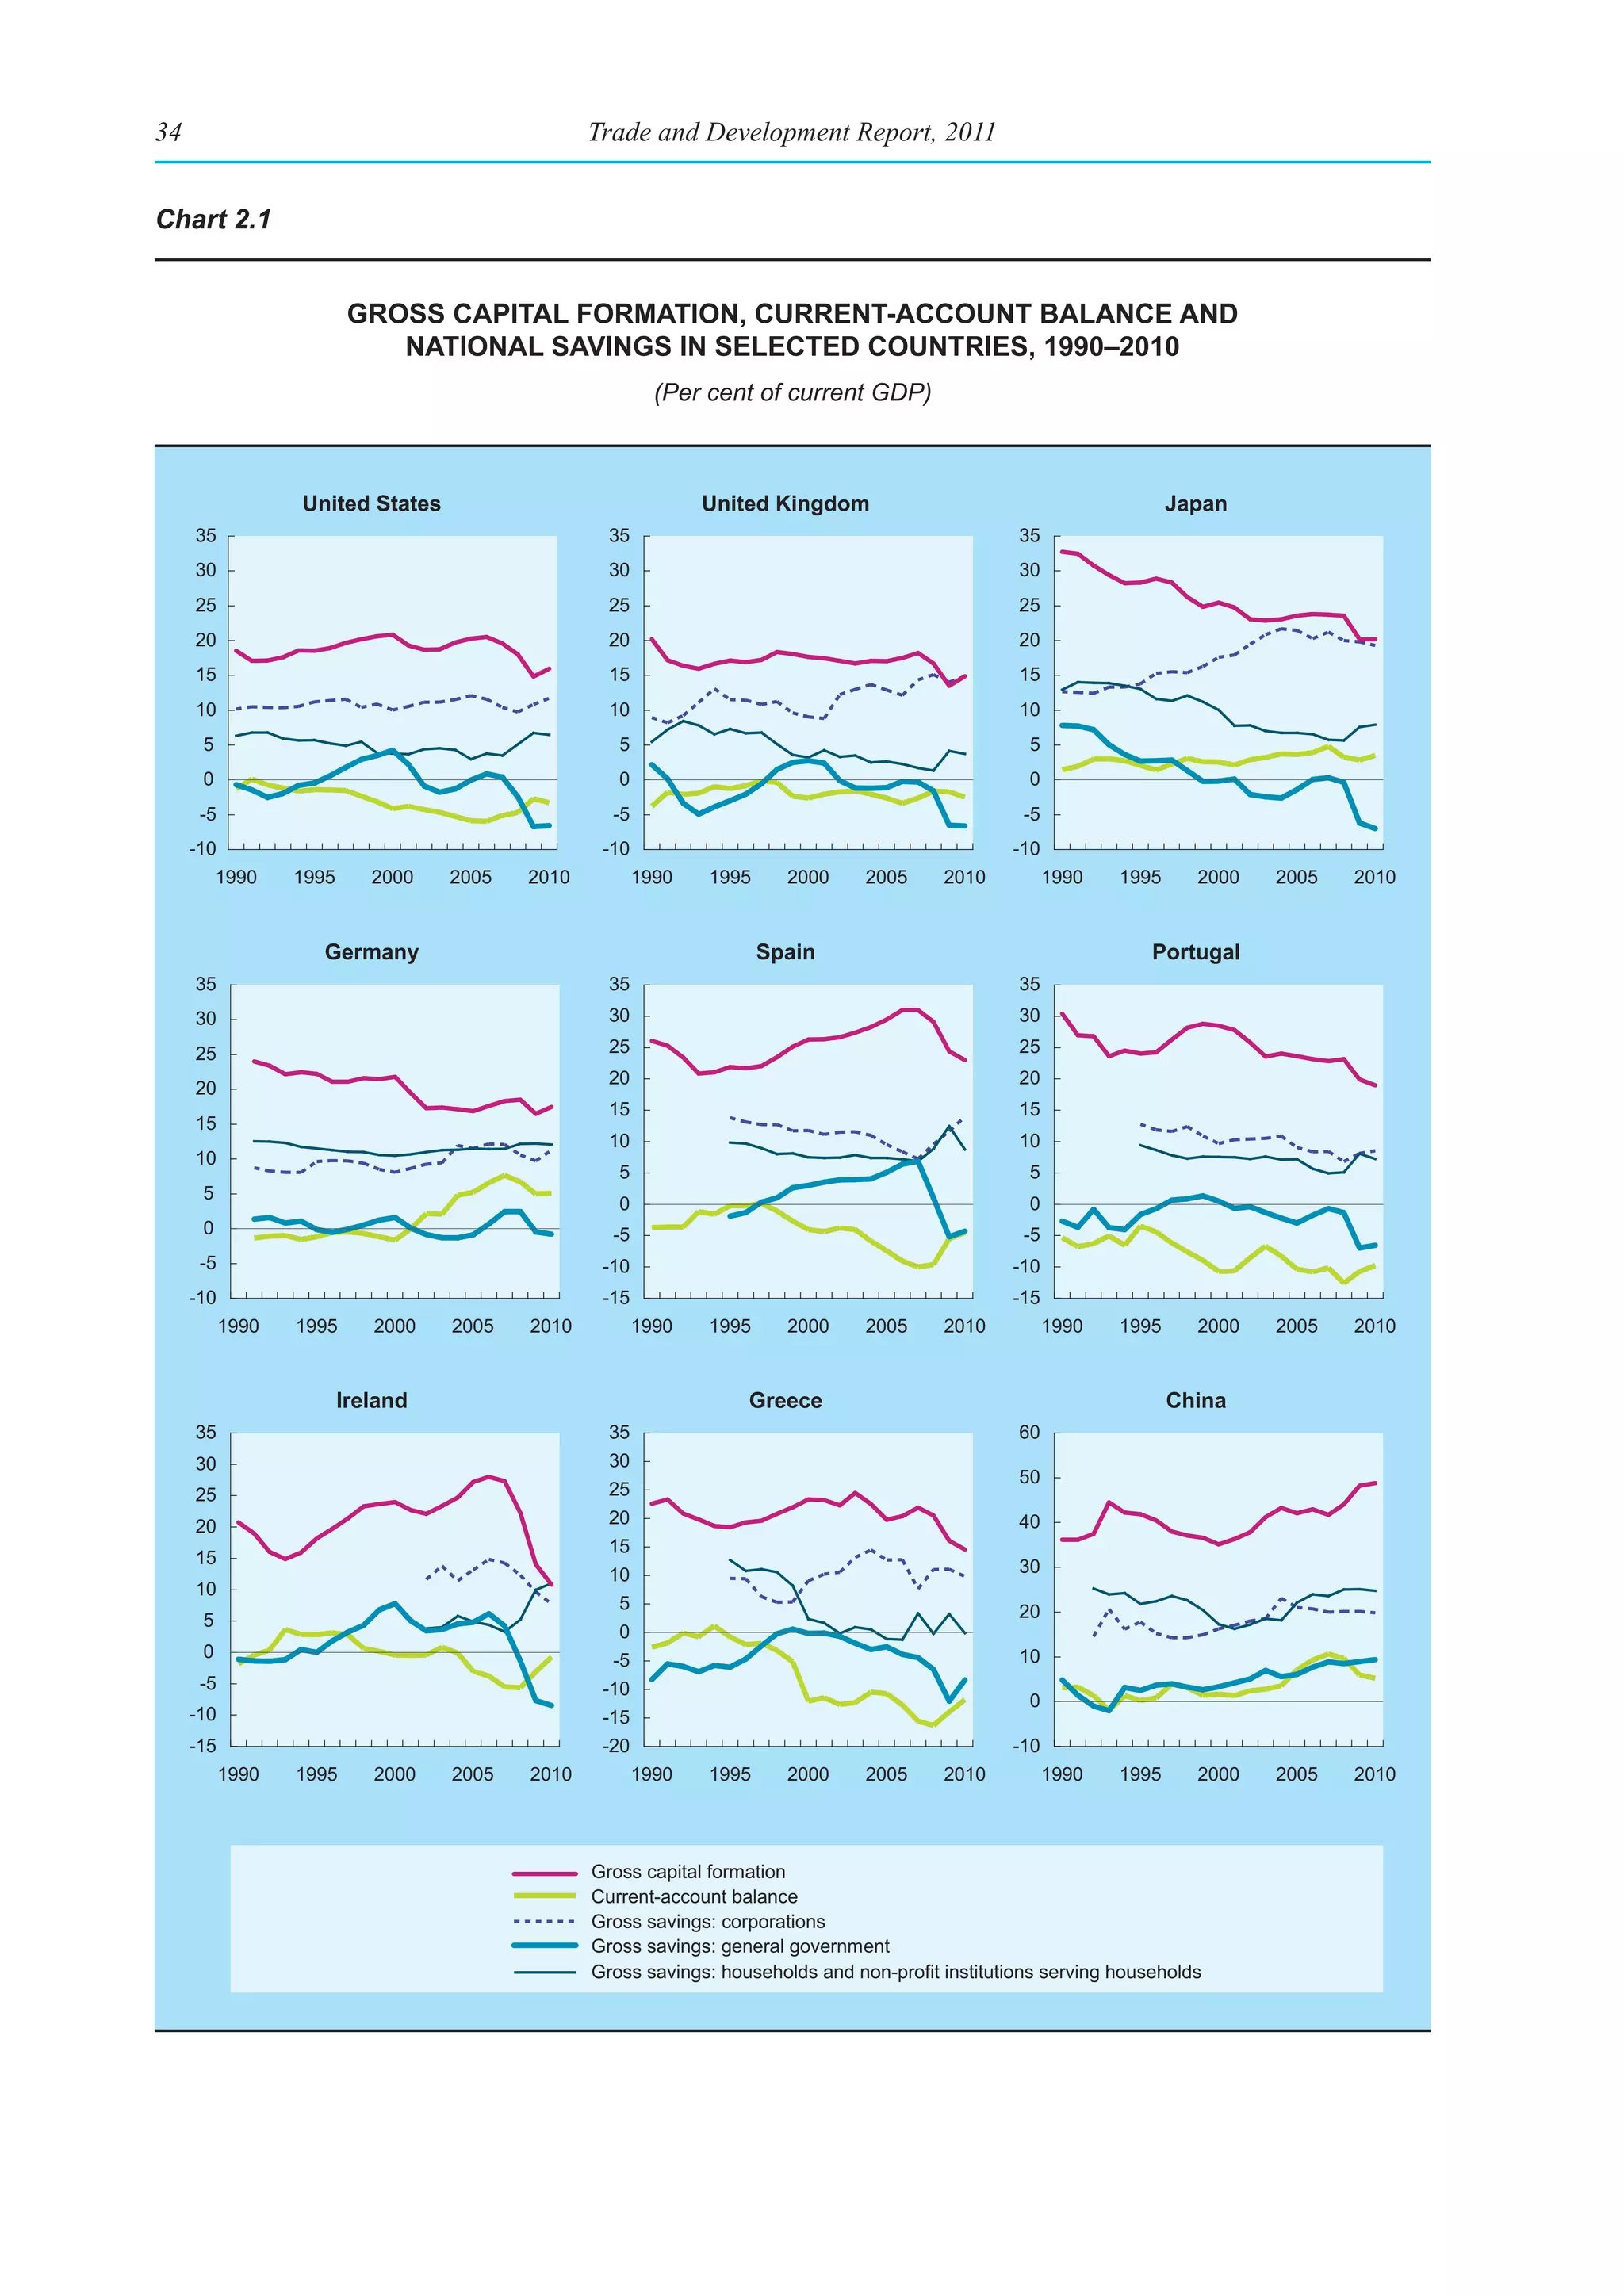
current-account surpluses in the latter at the expense responses, the crisis countries in the euro area are
of other countries in the area. By further weakening today labouring under extremely difficult conditions:
economic growth, the policies proposed by the euro- their GDP growth is flat or even negative, while their
area authorities may not succeed in improving debt market interest rates on public debt are prohibitively
sustainability either (see chapter III). high. Seen globally, however, these local conditions
are highly exceptional. While their budget deficits
Austerity measures in the deficit countries may are generally high and their public debt ratios are
reduce intra-area current-account imbalances through rising, inflation remains low. Thus the current pre-
income compression, but they may also worsen the dicament in Europe should be resolved by promoting
underlying solvency problem through debt deflation growth and reducing intraregional imbalances. The
(especially if emergency liquidity is provided at pen- European experience holds important lessons for the
alty rates). If the debtor countries receive sufficient rest of the world, in particular that austerity without
official financing at reasonable rates (as decided by regard for regional domestic demand growth may
the European Council on 21 July 2011), they may backfire badly. Well-coordinated monetary policies
avoid or postpone default, but this will not resolve and debt management aimed at keeping borrowing
the underlying problem of their lack of competitive- costs in check regionwide is therefore of the utmost
ness and growth. Owing to erroneous regional policy importance.
C. progress towards global rebalancing, growth and development:
an assessment of global cooperation
The latest global financial and economic crisis an important first round in battling the crisis. Today,
originated in the United States and Western Europe the G-20 continues to be a leading forum for inter-
as excessive private debt led their tightly integrated national economic cooperation. The Framework
financial systems to the verge of collapse. With the for Strong, Sustainable and Balanced Growth,
financial meltdown, which had the potential to cause launched at the G-20 summit meeting in Pittsburgh in
another Great Depression of global dimensions, September 2009, has also become the centrepiece of
policymakers realized that dealing with the fallout economic policy coordination among members. The
would require urgent international coordination of framework commits G-20 members to “work together
economic policies. to assess how [their national] policies fit together,
to evaluate whether they are collectively consistent
At the peak of the global crisis there was a rare with more sustainable and balanced growth, and to
display of international solidarity, with coordinated act as necessary to meet [our] common objectives”
monetary stimulus by major central banks leading the (G-20, 2009). A country-led, consultative “mutual
way. At the G-20 summit meetings in November 2008 assessment process” (MAP) was initiated to review
in Washington and in April 2009 in London, Heads members’ actions for that purpose.
of State and Government committed to providing
sizeable fiscal stimulus packages and emergency sup- The success of these exercises critically hinges
port programmes for restoring financial stability. The on a certain degree of commonality of policy views
aggregate policy impact of these measures stopped among members, which remains problematic.
the economic freefall and won global policymakers Since mid-2010, there has been a clear shift in the](https://image.slidesharecdn.com/tradeanddevelopmentreport2011-110906230532-phpapp02/75/Trade-and-development-report-2011-55-2048.jpg)
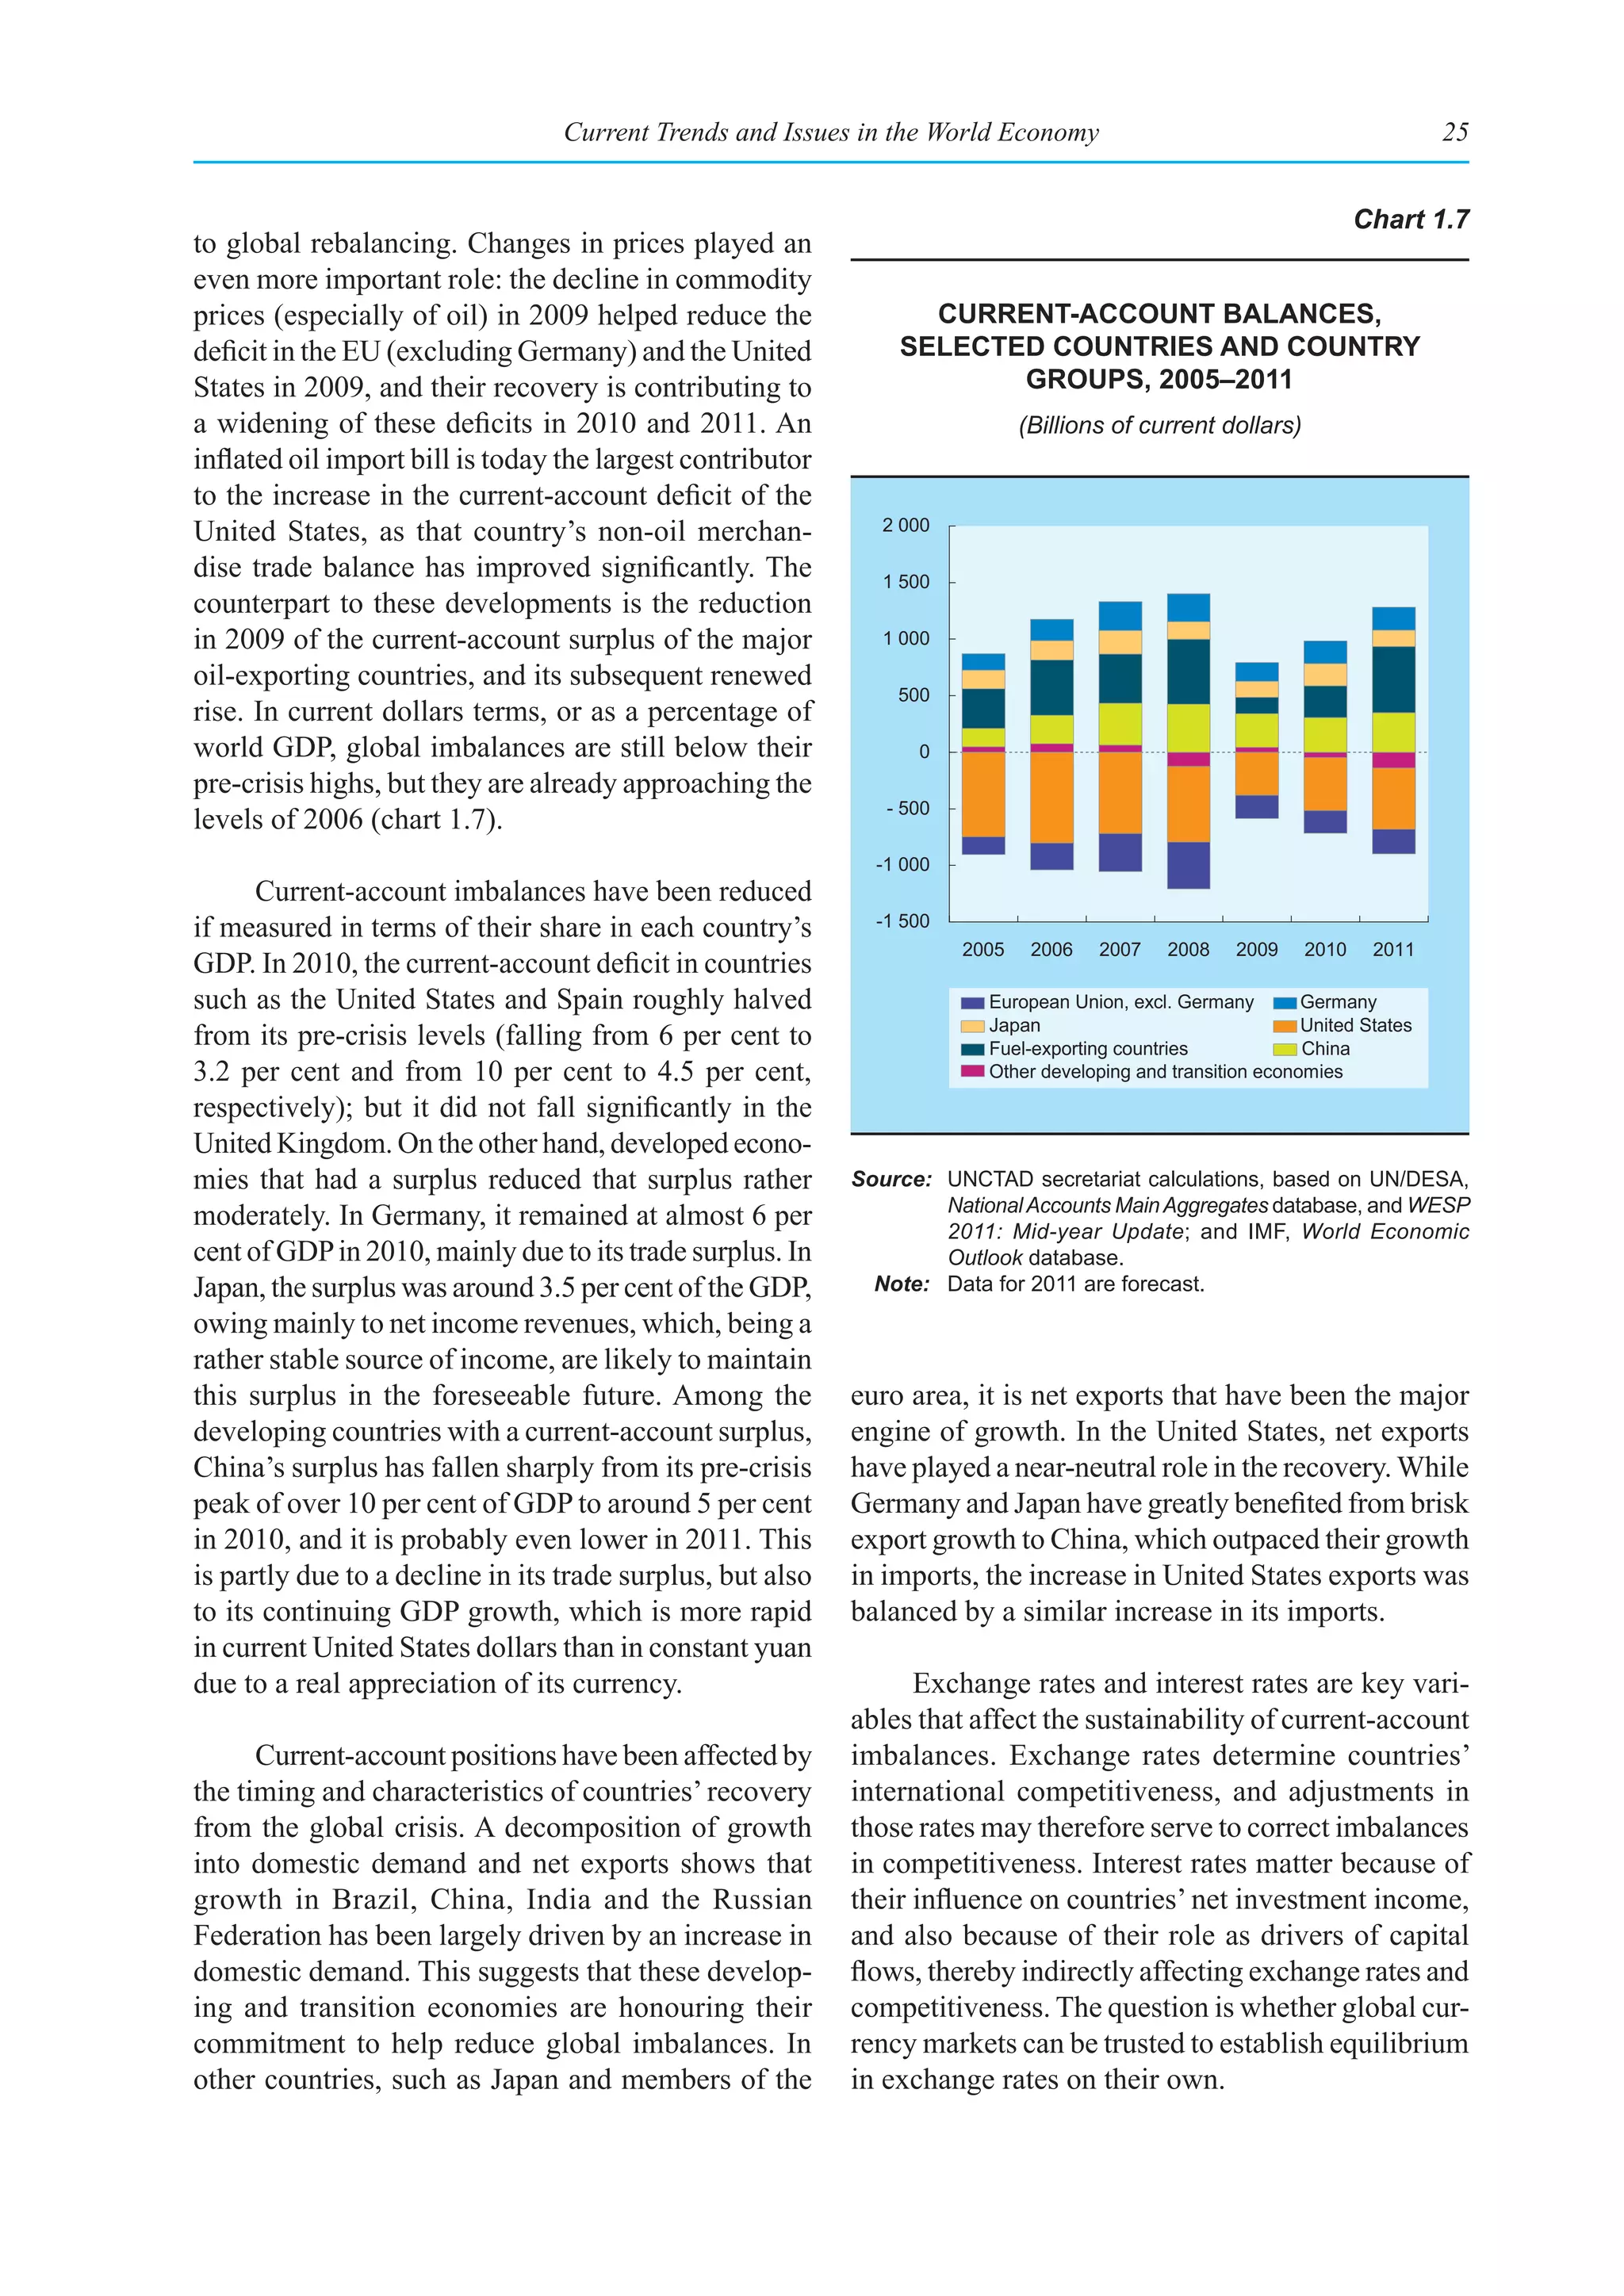


![98 Trade and Development Report, 2011
2. Systemically important financial these institutions, the trading book displaced loans
institutions as the most important asset group, thereby reducing
the importance of net interest income and increasing
the share of trading assets in total assets.
A specific issue, which is closely related to sys-
temic risk, concerns what have come to be labelled as In parallel, banks’ own lines of defence against
systemically important financial institutions (SIFIs) negative shocks – liquidity and capital – have fallen
that have been dubbed as too big to fail.2 The con- dramatically. Since the beginning of the twentieth
centration of banking activities in a small number of century, capital ratios in the United Kingdom and the
very big institutions is a relatively recent develop- United States have fallen by a factor of five. Liquidity
ment. For example, in the United States between the ratios have fallen even faster since the 1950s, to reach
1930s and 1980s, the average size of commercial almost zero, while bank profitability has shot up from
banks in relation to GDP remained largely constant, a stable 10 per cent return on equity per annum to
and over the subsequent 20 years their size increased a volatile level of between 20 and 30 per cent per
threefold (BIS, 2008). At the global level, by 2008, annum (Haldane, 2010).
12 banks had liabilities exceeding $1 trillion and
the ratio of liabilities to national GDP of 30 banks In the years preceding the global financial crisis,
was larger than 50 per cent (Demirgüç-Kunt and SIFIs’ financial leverage (i.e. the ratio of total assets
Huizinga, 2011). to total common equity) grew considerably. Between
2004 and 2007, this ratio went from about 27 to
In terms of concentration, until the early 1990s 33 times in Europe, and from 15 to almost 18 times
the three largest banks in the United States held in Canada and the United States. At the same time,
around 10 per cent of total assets of the commercial their liquidity ratios declined, as did the share of
banking system, and between 1990 and 2007, that deposits in their total resources, which increased their
share had increased to 40 per vulnerability. In Canada and the
cent. The share of the world’s United States, SIFIs’ liquidity, as
five largest banks in the assets of measured by the ratio of liquid
Banking activities are now
the world’s 1,000 largest banks assets to non-deposit liabilities,
concentrated in a small num-
increased from around 8 per cent fell from 23 per cent in 2004 to
ber of very big institutions,
in 1998 to more than 16 per cent about 20 per cent in 2007, while
which tend to take greater
in 2009. Moreover, the size of in Europe, it plummeted from
risks than smaller ones.
the banking sector in the global 35 to 22 per cent over the same
economy remained almost con- period. Similarly, their ratio of
stant since the beginning of the non-deposits to total liabilities
twentieth century until the 1970s. Thereafter, it began increased from 62 to 67 per cent in Europe and from
to increase in the 1980s. For example in the United 50 to 54 per cent in Canada and the United States
Kingdom it increased tenfold to five times the value (IMF, 2010a, figure 1).
of the country’s annual GDP (BIS, 2008).
The problem with SIFIs is that they are “super
In 2008, concentration in the banking sector spreaders” of crisis and of losses, as demonstrated
was very high in most major developed countries; during the recent global crisis when 18 of these large
in Australia, Canada, France, Germany, Switzerland, institutions accounted for half of the $1.8 trillion in
the United Kingdom and the United States, between losses reported by banks and insurance companies
2 and 6 institutions accounted for 65 per cent of those worldwide (IMF 2010a). Furthermore, the 145 banks
countries total bank assets (IMF 2010a). Moreover, with assets of over $100 billion in 2008 received
“the vast majority of cross-border finance was [and 90 per cent of the total government support provided
still is] intermediated by a handful of the largest to financial institutions during the crisis starting in
institutions with growing interconnections within 2007 (Haldane, 2010). Thus, extreme concentration
and across borders” (IMF 2010a: 5). In order to lower of the banking system implies that there are a number
costs, SIFIs switched from deposits to other funding of institutions that pose the problem of being too big
sources, such as money market mutual funds, short- to fail, because their collapse risks bringing down the
term commercial paper and repos. In the assets of entire financial system.](https://image.slidesharecdn.com/tradeanddevelopmentreport2011-110906230532-phpapp02/75/Trade-and-development-report-2011-130-2048.jpg)
![Financial Re-regulation and Restructuring 101
be prevented from taking measures for prudential GATS may also be an obstacle for other sorts
reasons”. This apparent contradiction creates scope of regulations that are being proposed by several
for different interpretations, leading to uncertainties countries. For instance, the European Commission
regarding how the WTO will eventually apply these has realized that a tax on financial transactions
rules. Therefore, it will be necessary to clarify certain that was greatly favoured by many of its member
wording that has not been tested in dispute settlement countries could be viewed as an indirect restriction
panels. For instance, the meaning of “prudential” is on transfers and payments if it increases the cost of
not clear. From one point of view, restrictions on capi- transactions, and as such would be a breach of GATS
tal inflows and outflows are clearly macroprudential Article XI, as the EU had undertaken commitments
in nature, but many governments and institutions, as relating to financial transactions even with third
well as well-versed GATS scholars, have argued that countries (Tucker, 2010). Furthermore, even the
only Basel-type measures could be considered “pru- separation of commercial and investment banking,
dential”, which would exclude which many see as essential for
capital controls (Wallach and coping with financial systemic
Tucker, 2010). Further, this con- risk, could be construed as a vio-
cession to national autonomy is Liberalization of services lation of Article XVI on Market
followed by the statement that, through GATS commitments Access, which, as noted earlier,
“where such measures do not may be an obstacle to re- places restrictions on limitations
conform with the provisions of regulating the financial that could be imposed on the
the Agreement, they shall not be system. character of institutions. The
used as a means of avoiding the GATS market access rules pro-
Member’s commitments or obli- hibit government policies that
gations under the Agreement”. limit the size or total number of
Thus, if countries have already made commitments financial service suppliers in the “covered sectors”
to allow certain kinds of financial activities of foreign (i.e. those in which liberalization commitments have
financial institutions, they cannot impose any pruden- been made). Thus, if countries have already com-
tial regulations that run counter to such commitments, mitted to certain kinds of deregulation, they cannot
even when they are necessary for the stability and easily undo them, even with regard to critical issues
viability of the system. such as bank size. Under the same rules, a country
may not ban a highly risky financial service in a sector
Different interpretations may also arise con- (i.e. banking, insurance or other financial services)
cerning the possibility of applying capital controls once it has been committed under GATS rules.5
which are explicitly allowed by the IMF’s Articles
of Agreement. GATS Article XI states: “Nothing in The situation is even more extreme for the
this Agreement shall affect the rights and obliga- 33 countries that in 1999 signed up to a further
tions of the members of the International Monetary WTO “Understanding on Commitments in Financial
Fund under the Articles of Agreement of the Fund”. Services”, which states that “any conditions, limita-
In principle, therefore, countries could resort to tions and qualifications to the commitments noted
Article VI, section 3 of the Fund’s Articles of below shall be limited to existing non-conforming
Agreement to impose capital controls. However, measures.” These countries include almost all the
the same GATS Article XI specifies that “a member OECD members, as well as a few developing coun-
shall not impose restrictions on any capital transac- tries such as Nigeria, Sri Lanka and Turkey. This
tions inconsistently with its specific commitments Understanding established further deregulation-
regarding such transactions, except under Article related commitments by specifying a “top-down”
XII [i.e. under balance-of-payments difficulties] or approach to financial liberalization, which means
at the request of the Fund”. Hence, on the one hand, that a sector is, by default, fully covered by all of the
as a member of the IMF a country is free to impose GATS obligations and constraints unless a country
capital controls; and on the other hand, under GATS specifically schedules limits to them. This effectively
it can only resort to such a measure “provided” it is blocks further financial regulation of any kind. And
not inconsistent with its commitments made under there is no possibility of any kind of ban on specific
GATS, or if it faces a balance-of-payments crisis financial products that are deemed to be too risky,
(Siegel, 2002). such as certain derivatives, because every signatory](https://image.slidesharecdn.com/tradeanddevelopmentreport2011-110906230532-phpapp02/75/Trade-and-development-report-2011-133-2048.jpg)
![Financial Re-regulation and Restructuring 105
Therefore, a possible way to restructure the period, private institutions and individuals enjoyed
banking sector would be to promote a diverse set of large profits and bonuses, during the bust, govern-
banking institutions, ensuring that they serve growth ments – or the “taxpayers” – had to bear the costs.
as well as equality. A diversity of institutions, which
would cushion the system from the vagaries of the The criticism that only State-owned banks have
international financial markets, along with regulatory the advantage of access to public resources is no long-
simplicity, would create a more stable banking sys- er valid. Governments generally have had full control
tem. Moreover, inclusive development necessitates of the operations of public banks throughout both
the involvement of a variety of boom and bust cycles, whereas
institutions and a different role private banks have retained their
for central banks. Central banks own management and control
A more balanced and diversi-
should not only focus on fight- and have continued to pay them-
fied banking system, which
ing inflation; they should also be selves handsome bonuses, even
includes public and coopera-
able to intervene in the provision when they have received large
tive banks, will be more stable
of credit, as they did in many government bailouts. The alle-
and effective in serving growth
European countries for more gation that State-owned banks
and equality.
than a century (Gerschenkron, are “loss-making machines”
1962). The present system of (Calomiris, 2011) is therefore
private banks should be restruc- more appropriately applicable to
tured to establish a clear separation between those large private banks. With regard to the differences in
that take deposits and those engaged in investment efficiency between public and private banks, the cri-
banking, bringing many of the legitimate activities sis revealed that even the largest private banks failed
now conducted by the shadow banking system within to collect and assess information on borrowers and
the scope of regulation. In this framework, govern- to estimate the risks involved in lending. The latter
ment-owned banks would have a more important function was transferred to rating agencies instead.
role, not only for development purposes but also as
an element of diversity and stability. Additionally, Three beneficial aspects of State-owned banks
a combination of postal savings facilities and com- have been highlighted recently. The first one relates to
munity-based banks, similar to some local savings their proven resilience in a context of crisis and their
banks in parts of Europe, could also play a larger role in compensating for the credit crunch originating
role in the functioning of the financial sector. All from the crisis. A second beneficial aspect of pub-
this would result in a much more diverse banking licly owned banks is that they support activities that
system, which will be more responsive to the needs bring much greater social benefits than the private
of growth and of small communities, as advocated banks and provide wider access to financial services.
by Minsky et al. (1993). Finally, they may also help promote competition in
situations of oligopolistic private banking structures
(Allen, 2011).
3. The need for a more balanced banking From a regulatory point of view, information
sector: public and cooperative banks asymmetries could be overcome if the authorities had
complete access to information, which, at present,
is often retained as confidential by private banks. In
The ongoing financial and economic crisis, addition, it has been argued that “if private banks are
which originated in private financial institutions, making significantly higher profits than public banks,
has significantly undermined many of the arguments this may provide a warning signal [to regulators]
repeatedly advanced over the past few decades that they are taking too much risk or exploiting their
against publicly-owned banks. In Europe and the monopoly power” (Allen, 2011).
United States, large private banks have been subsi-
dized based on the belief that they are too big to fail. In spite of large-scale privatizations during the
Indeed, when the crisis struck large banks were able 1990s, State-owned banks continue to play an impor-
to survive only because they received government tant role in the banking systems of many developing
funding and guarantees. Whereas during the boom countries. In 2003, these kinds of banks accounted for](https://image.slidesharecdn.com/tradeanddevelopmentreport2011-110906230532-phpapp02/75/Trade-and-development-report-2011-137-2048.jpg)

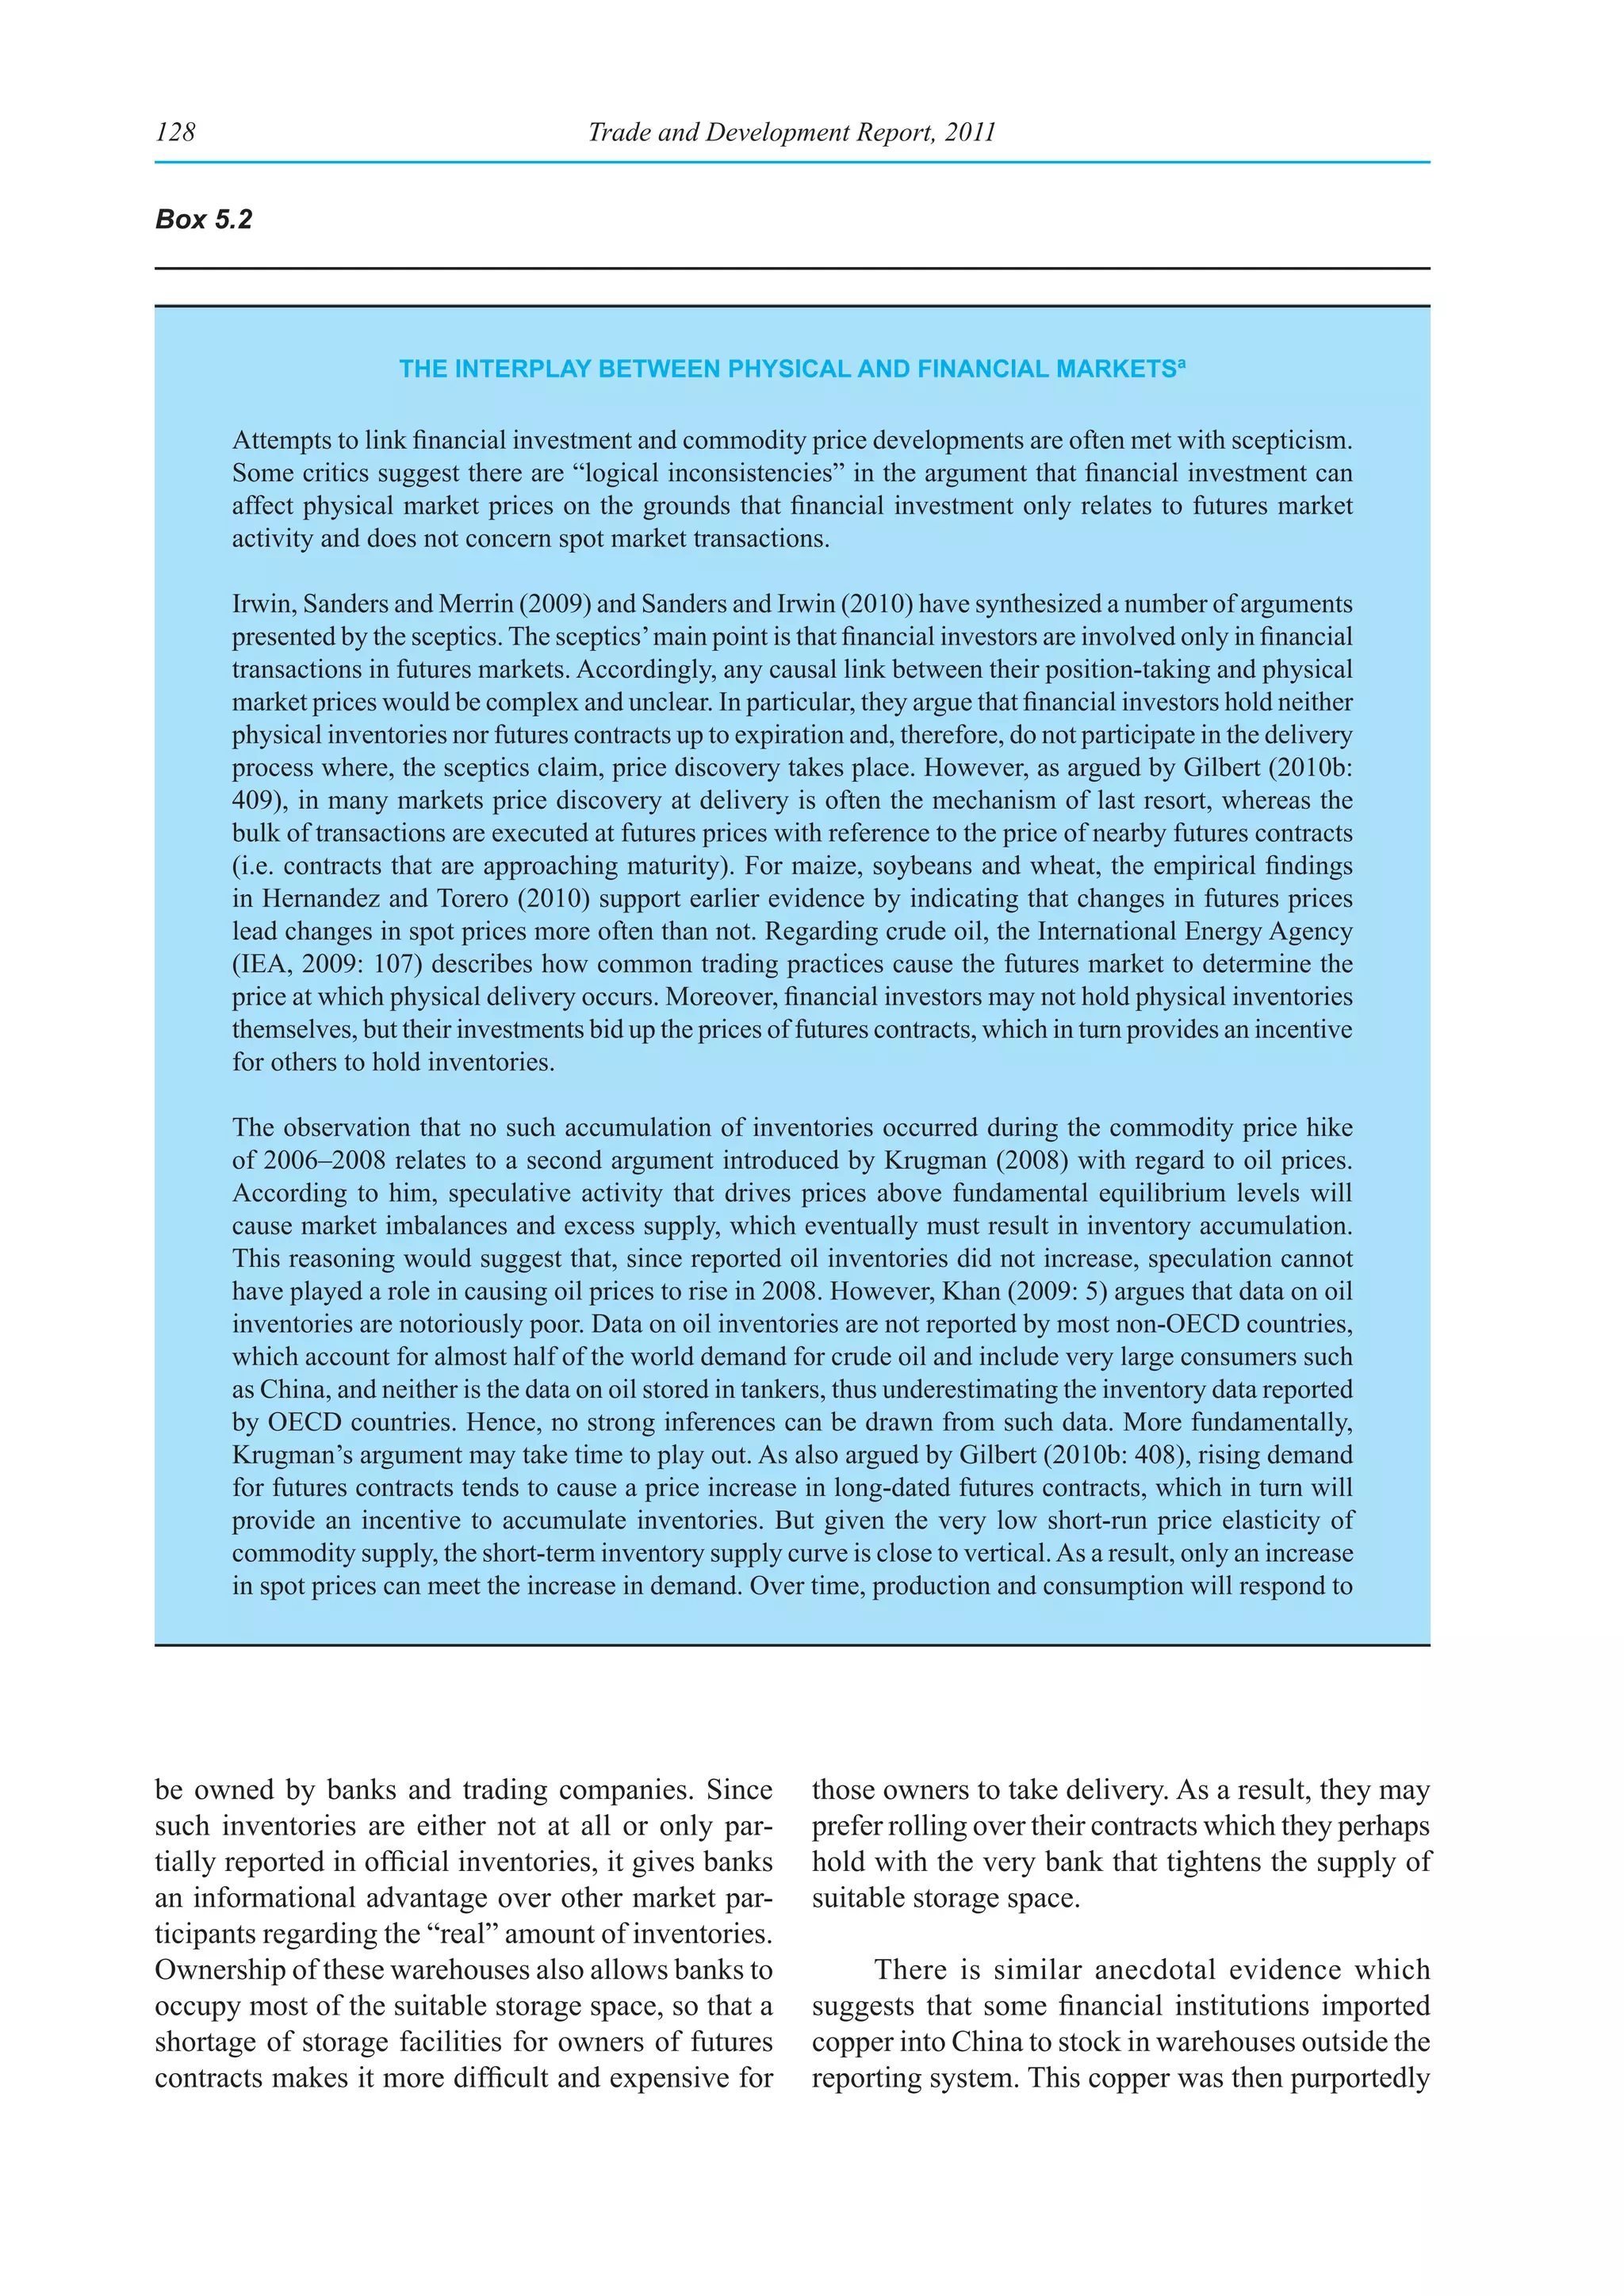
![Financialized Commodity Markets: Recent Developments and Policy Issues 129
Box 5.2 (concluded)
the higher price, inventories will gradually accumulate and prices will decline. In the interim, however,
a commodity price bubble may well occur.
Third, Irwin, Sanders and Merrin (2009) and Sanders and Irwin (2010) argue that even if financial investors
had an impact on prices and drove a wedge between market prices and fundamental values, the resulting
arbitrage opportunity would cause rational traders to trade against wrongly informed financial investors
and bring market prices back to fundamental values. However, as mentioned earlier, there is widespread
agreement that there are limits to arbitrage.
The possibility that even rational traders may feed short-term price bubbles also casts doubt on a fourth
argument made by Irwin, Sanders and Merrin (2009) and Sanders and Irwin (2010), namely that there
is no indication of excessive speculation. Estimating the appropriate level of speculation relative to
hedging demands on the basis of positions taken by different trader categories, they argue that the level
of speculation in commodity futures markets was within historical averages during the period 2006–2008.
However, judging the appropriate level of speculation merely by the number of positions, rather than
by the kind of information and expectations on the basis of which such positions are taken, ignores the
possibility that fundamental values may not always be the only consideration, even for rational speculators.
Moreover, even on the basis of such numerical comparisons, Büyüksahin and Robe (2010: 15) conclude
that “[e]xcess speculation increased substantially, from about 11% in 2000 to about 40-50% in 2008.”
Fifth, focusing on index investment, Irwin, Sanders and Merrin (2009) and Sanders and Irwin (2010)
argue that, if index investors in futures markets had caused the commodity price hike, the prices of
commodities not included in such indexes (such as iron ore, onions and rice) should not have risen.
However, Tang and Xiong (2010) suggest that different mechanisms accounted for the price increases
of these two groups of commodities, and that those commodities included in indexes were affected by
financial investors.
Finally, Irwin, Sanders and Merrin (2009) and Sanders and Irwin (2010) argue that if index investment
affects prices, its effect should be uniform across markets for the same relative position size, and they
claim that this is not the case. However, the common effect of index investment occurs simultaneously
with commodity-specific supply and demand shocks. These idiosyncratic shocks may counter or reinforce
the common effect, depending on commodity-specific circumstances, and may do so in varying degrees.
Moreover, the size of index trader positions in a specific market does not depend on the size or the liquidity
of that market, but rather on the specific composition of the index that the trader follows.
a
This text is drawn from Mayer, 2011.
used as collateral to speculate in other markets, or lending.23 Tying up physical copper inventories in
to re-export to countries that host London Metal warehouse financing arrangements signals market
Exchange licensed warehouses, or, in the case of tightness and supports prices, especially when those
some Chinese enterprises, to finance corporate inventories are not entered into official inventory sta-
development. According to these sources, securing tistics. If this anecdotal evidence is accurate, it could
bank loans by borrowing against copper as collateral also explain why China’s copper imports remained
is cheaper than conventional borrowing because the high even during the run-up to the price peak in
monetary tightening measures taken by the Bank of February 2011. Moreover, it would illustrate how
China at that time only affected non-collateralized schemes operated by financial investors can distort](https://image.slidesharecdn.com/tradeanddevelopmentreport2011-110906230532-phpapp02/75/Trade-and-development-report-2011-161-2048.jpg)
![Financialized Commodity Markets: Recent Developments and Policy Issues 131
Chart 5.5
money manager posItIons and Crude oIl prICes, January 2009–June 2011
20 120
18
100
16
Price (right scale)
Ratio of long to short positions
14
80
12
$ per barrel
10 60
8
40
6
Money manager positions
4
20
2
0 0
6 Jan. 2009 12 May 2009 15 Sep. 2009 19 Jan. 2010 25 May 2010 28 Sep. 2010 1 Feb. 2011 7 June 2011
Source: UNCTAD secretariat calculations, based on CFTC, Commitment of Traders; and Bloomberg.
data which, in principle, are expected to reflect only in significant part, to different behavior over the
market fundamentals. By doing so, such schemes business cycle.” 24
further contribute to difficulties in disentangling the
price effects of changes in market fundamentals and
in financial investments. (a) Price developments on commodity and
equity markets
Recent evidence suggests that adding com-
2. Price effects of financial investors modity futures to their portfolios no longer helps
across different asset markets investors hedge against equity market risk. The
process of deleveraging that began with the onset of
the current crisis in mid-2008 and affected all asset
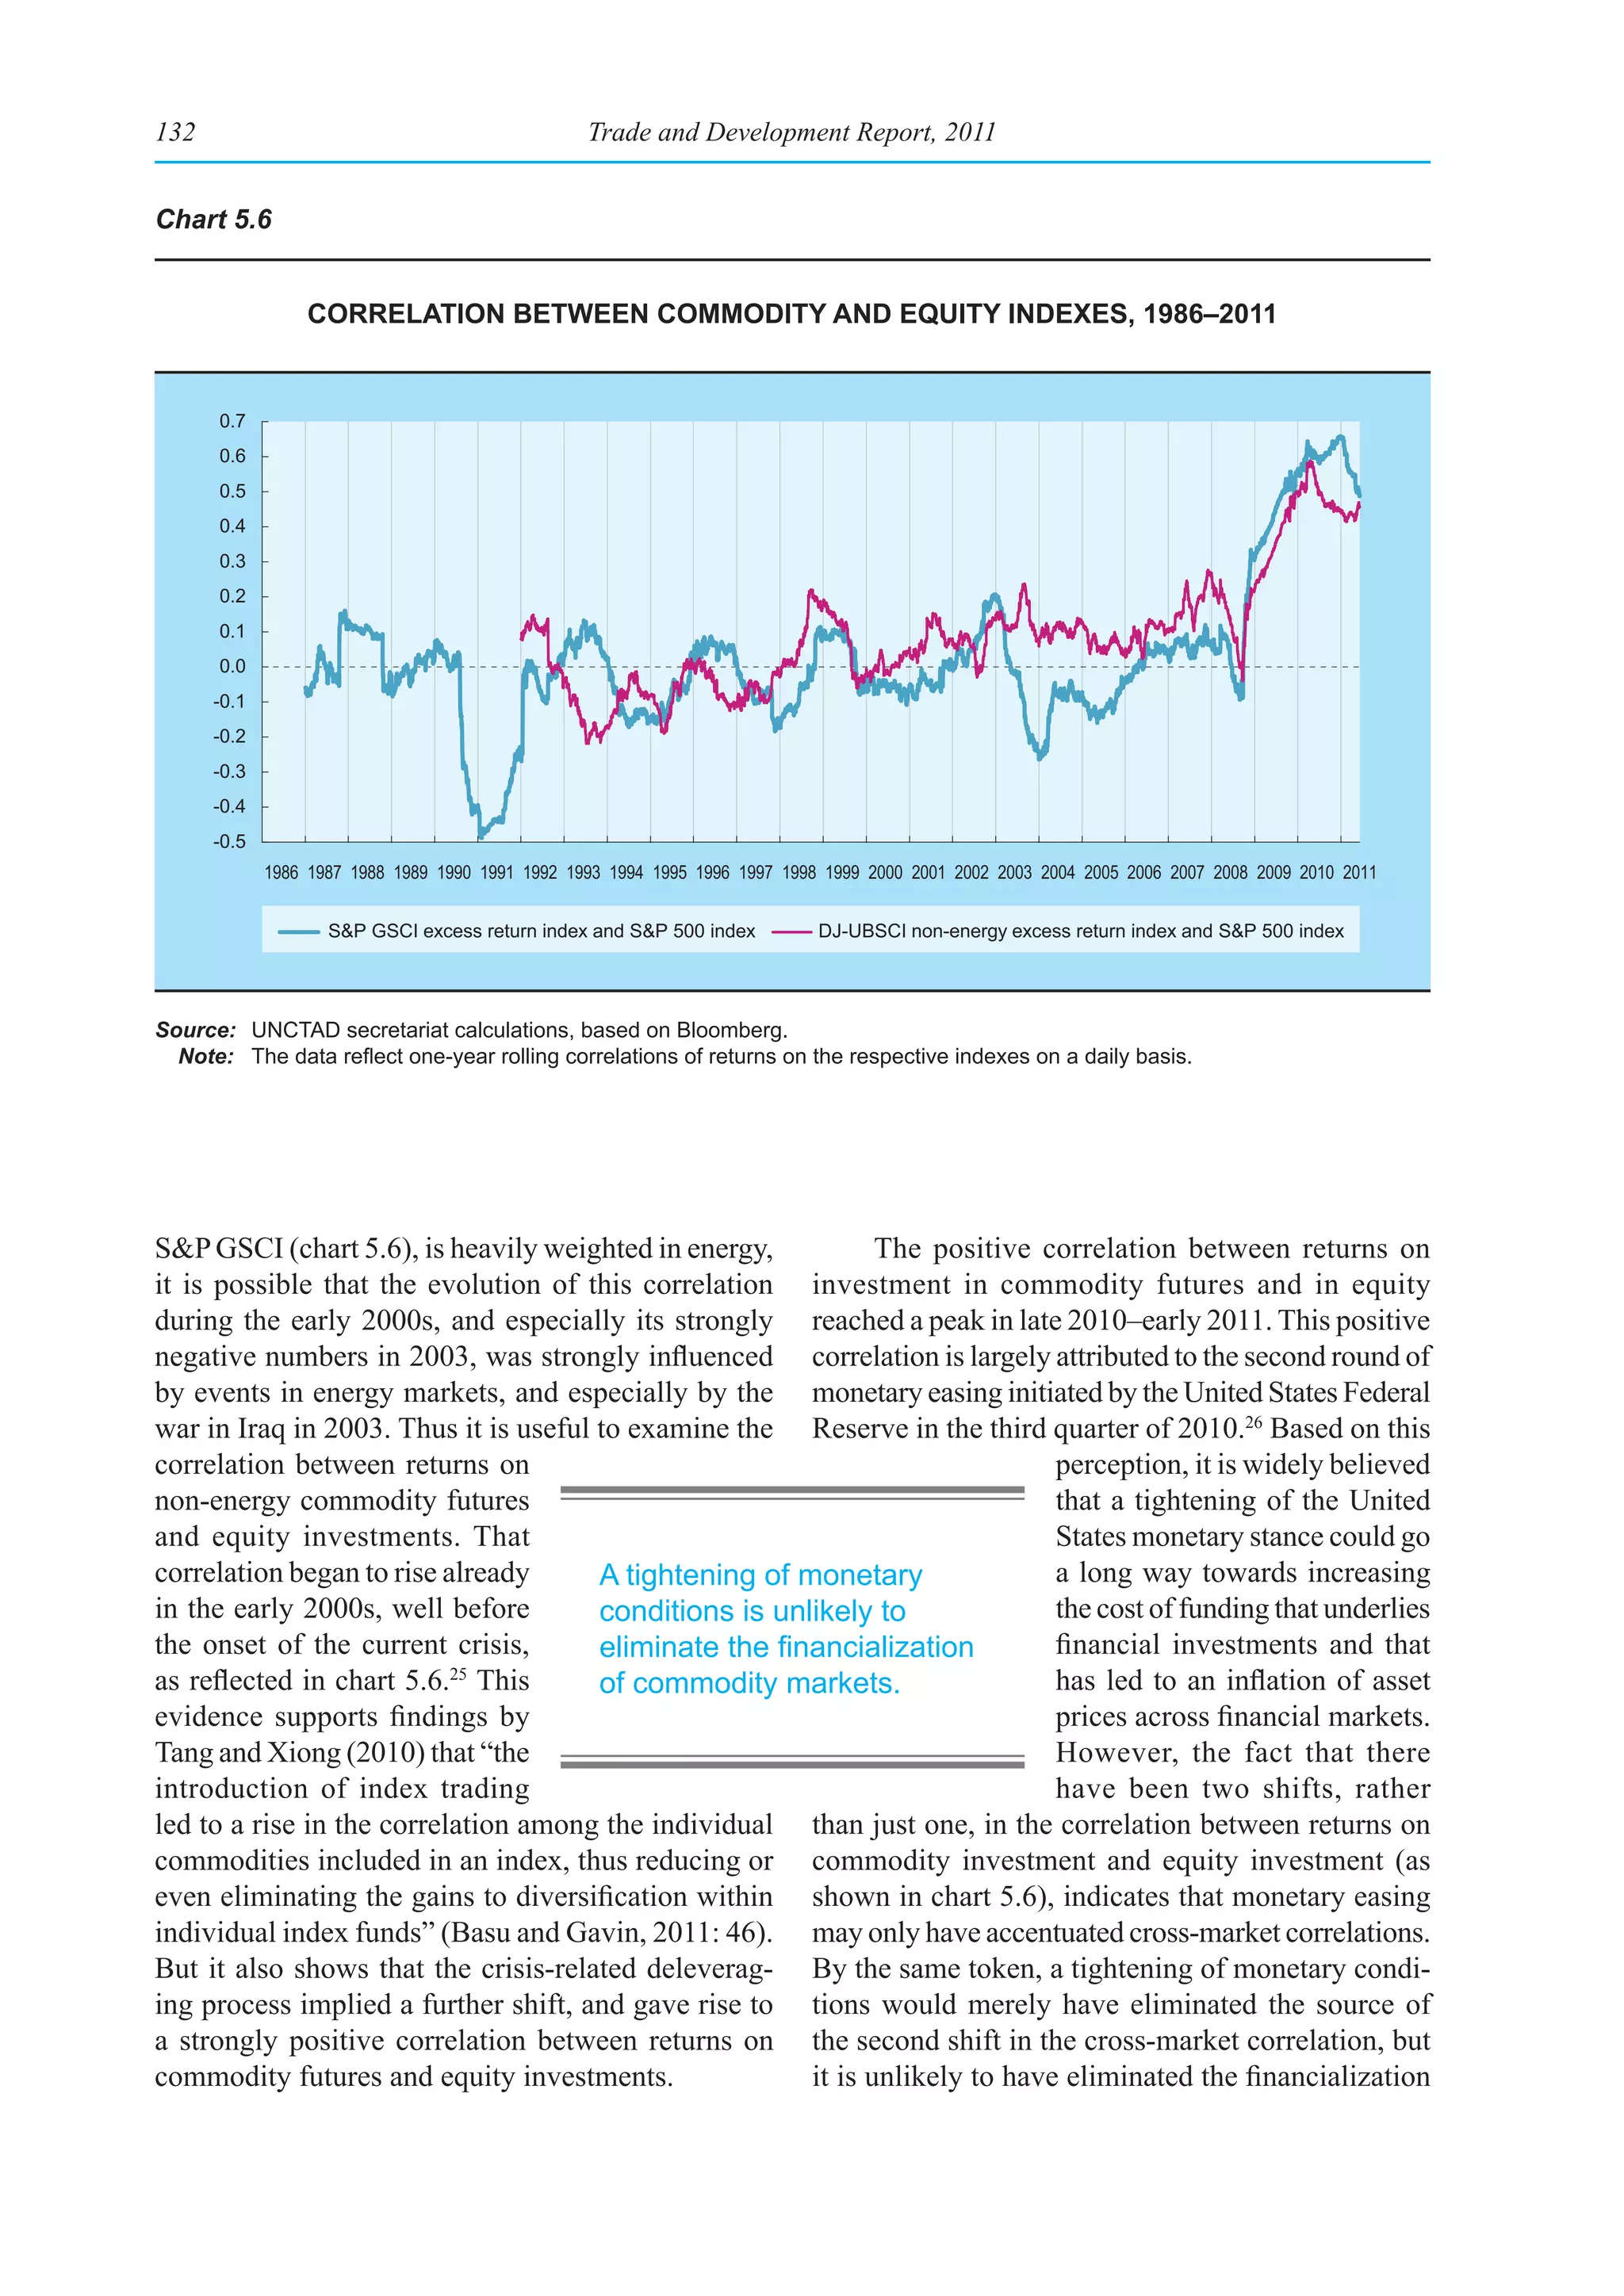
As mentioned earlier, financial investors have markets resulted in a strongly positive correlation
sought to diversify their portfolios by investing in between the returns on commodity futures and those
commodities as part of a broader strategy aimed on equity investments (chart 5.6).
at reducing their concentration on equities, bonds
and currencies. This change in strategy is based From the evidence related to broad-based
on historical evidence which suggests that the investment in commodities, reflected in chart 5.6, it
broader portfolio composition improves risk-return would seem that this positive correlation emerged
performance. Using data for the period 1959–2004, only in the run-up to the current financial crisis, and
Gorton and Rouwenhorst (2006: 1) argue that “the that it became accentuated only in its aftermath.
risk premium on commodity futures is essentially However, it is well known that the greatest benefits
the same as equities, [whereas] commodity futures from investing in commodity futures are derived from
returns are negatively correlated with equity returns diversifying across not only different commodity
and bond returns. The negative correlation between categories but also individual commodities (Erb and
commodity futures and the other asset classes is due, Harvey, 2006; Basu and Gavin, 2011). Because the](https://image.slidesharecdn.com/tradeanddevelopmentreport2011-110906230532-phpapp02/75/Trade-and-development-report-2011-163-2048.jpg)

![152 Trade and Development Report, 2011
the international agenda
The international agenda for financial reform activity alone were responsible for the volatility of
adopted a number of subjects directly focusing commodity markets” (IOSCO, 2011: 6); (ii) recom-
on financial markets in the aftermath of the Asian mended closer monitoring of commodity derivatives
financial crisis in 1997–1998. Following the outbreak markets, as price discovery in these markets was
of the current financial crisis, this agenda has been of critical importance for the world economy; and
broadened to cover other areas as well, including (iii) recognizing the complexity and often opacity
commodities. The G-8 Meeting of Finance Ministers of factors that drive price discovery on commodity
in Osaka in June 2008 expressed concern over the derivatives markets, called on governments to ensure
functioning of certain commodity derivatives markets, greater transparency of commodity trading with a
and called for an examination of the functioning and view to enabling “a more comprehensive under-
regulation of those markets.2 In response, in September standing of the interaction between financial and
2008 the International Organization of Securities non-financial participation in commodity derivatives
Commissions (IOSCO) established the Task Force on and related physical commodity markets that affect
Commodity Futures Markets, jointly chaired by the price formation” (IOSCO, 2011: 8).
CFTC and the United Kingdom’s Financial Services
Authority. The Task Force has given particular empha- Subsequent reports to the G-20 summits in
sis to oil, owing to the concern over price volatility September 2009, and June and November 2010
in energy markets during 2008 expressed by the G-20 surveyed the degree of compliance by Task Force
leaders at their meetings in Pittsburgh (United States) members with the recommendations of the March
in September 2009 and Seoul (Republic of Korea) in 2009 report, and found a high degree of compliance.
November 2010.3 The G-20 Pittsburgh Communiqué Its November 2010 report, which was considered at
also called for all standardized OTC derivatives to be the G-20 summit in Seoul, also: (i) indicated its inten-
centrally cleared and, where appropriate, to be traded tion to work towards the creation of a trade repository
on exchanges or electronic trading platforms by the for financial oil contracts;5 (ii) requested an interna-
end of 2012. The G-20 Seoul Declaration requested tional energy markets agency to examine the impact
the Task Force to report by April 2011 to the Financial of published cash market price assessments on related
Stability Board (FSB) and to provide recommen- commodity futures; (iii) encouraged the International
dations to improve the transparency and overall Swaps and Derivatives Association (ISDA) initiative
functioning of commodity derivatives markets. The to establish an OTC derivatives trade repository;
G-20 has also mandated the FSB to coordinate the and (iv) called for further disclosure of aggregated
design and implementation of the various facets of the open interest information from exchange trading, as
international financial reform agenda, and to consider well as for greater availability of data from physical
the appropriate next steps to be taken.4 markets, including through a more detailed study on
the impact of oil price reporting agencies.
In its first report, published in March 2009, the
IOSCO Task Force: (i) reviewed existing studies on In its April 2011 report, IOSCO (2011: 6)
the issue of price volatility and financial investment acknowledged “that commodity futures markets can
in commodity markets and “saw no evidence to sug- experience periods of significant volatility and that
gest that [financial investors in commodity futures improvements should be made to the functioning of
markets] or any other particular class of investors’ these markets.” It indicated an extension of its focus](https://image.slidesharecdn.com/tradeanddevelopmentreport2011-110906230532-phpapp02/75/Trade-and-development-report-2011-184-2048.jpg)