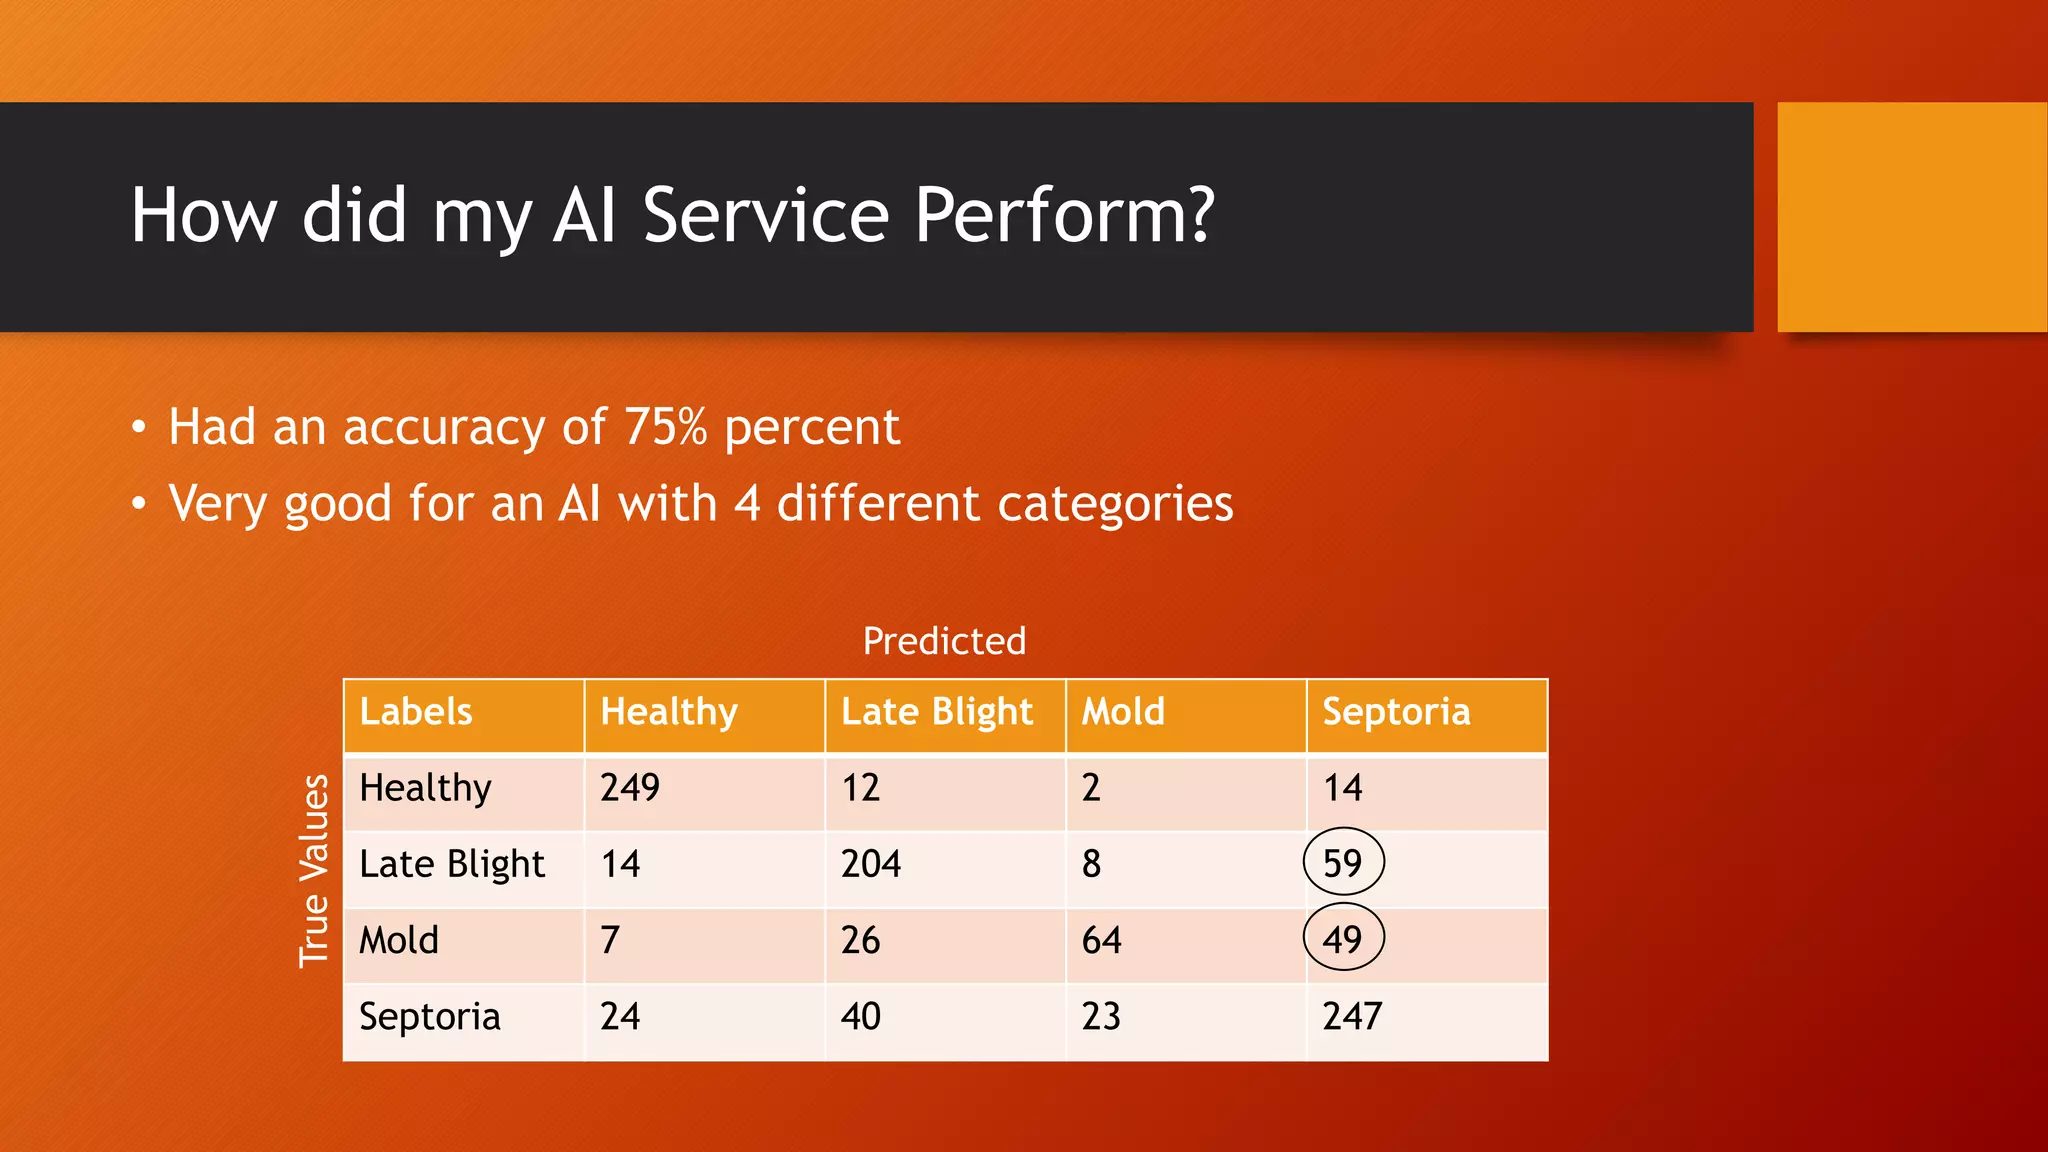
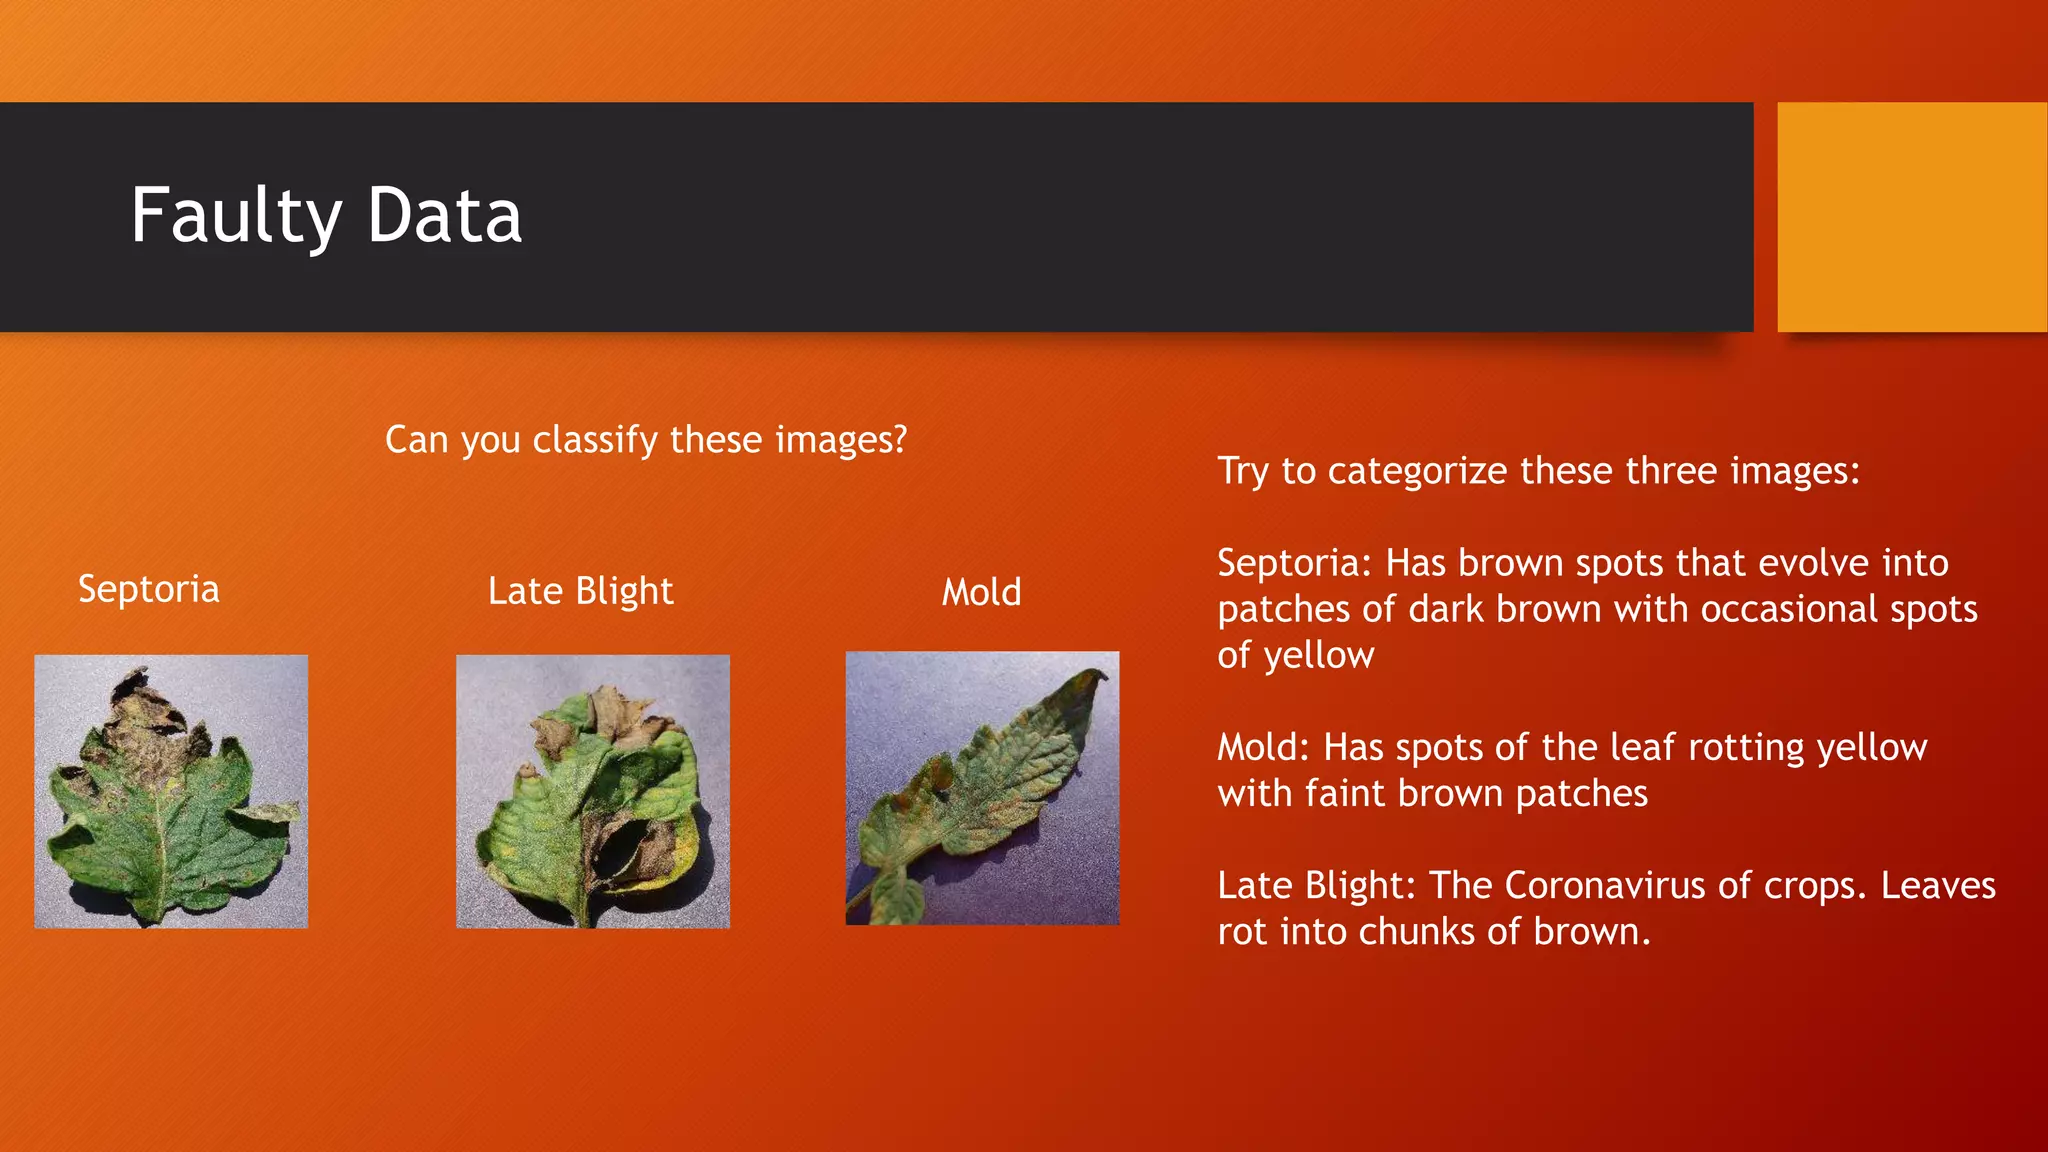
2. Motivation
This project was made as a continuation of a series of TomatoGenius
Projects. I add knowledge of key concepts related to Random Forest
to a belt with different AI algorithms.
3. Contents
• Dataset
• Input and Output
• Algorithm
• How did my AI service perform?
• Demo
• Problems Encountered
• Further Improvements
• Q and A
4. Dataset
• A CSV File containing 7000 flattened images
• Has 4 categories: Healthy, Late Blight, Mold, and Septoria Leaf
Spot
• Each flattened row contains a grayscale value of each pixel of the
28x28 image making 784 elements per row.
5. Input and Output
Input
• A row of 784 csv’s representing each pixel of my image
Output
• 4 labels describing the tomato leaf’s condition:
Healthy, Late Blight, Septoria Virus, Curl Virus
6. Algorithm
The Random Forest Classifier
Algorithm was used to generate
a training model.
Decision
Tree 1
Decision
Tree 2
Decision
Tree 3
Prediction: Late Blight
A decision tree is an entity that decides
which output to pass on based on rules
generated by the trained model.
Late Blight: 80%
Septoria: 15%
Unknown: 5%
Late Blight: Dark
Brown Patch
Healthy: Green with
no Spots
Septoria: Dark
Brown Spots
Mold: Yellow Fading
to Brown
Late Blight: Distinct
Brown Patch
8. How did my AI Service Perform?
• Had an accuracy of 75% percent
• Very good for an AI with 4 different categories
Labels Healthy Late Blight Mold Septoria
Healthy 249 12 2 14
Late Blight 14 204 8 59
Mold 7 26 64 49
Septoria 24 40 23 247
TrueValues
Predicted
9. Faulty Data
Septoria MoldLate Blight
Try to categorize these three images:
Septoria: Has brown spots that evolve into
patches of dark brown with occasional spots
of yellow
Mold: Has spots of the leaf rotting yellow
with faint brown patches
Late Blight: The Coronavirus of crops. Leaves
rot into chunks of brown.
Can you classify these images?
11. Further Improvements
• As always, I can add more pictures to provide more info
• Add more diseases
• Add certain presets like certain color combinations to get an even
more accurate prediction
• Instead of downscaling to 28x28, I can downscale by a lower factor
to 100x100
Editor's Notes
Recite
Recite
Recite
Recite
Explain what a Classifier is. Show basic Random Forest structure. Explain Decision trees and 1 tree with depth of 1. Tell Depth of 2.
Tell How 59 and 49 are very concerning.
IMPORTANT!!
Tell how downscaling from 200x200 to 28x28 loses a lot of information.
Random Forest is very fast and not that much computational as a ResNet Image Classification(my ResNet had 95%) and having
1.) 5 categories and
2.) the downscaling the image by a factor of 51
with a result of 75% is impressive
Ask them which one is which and tell that there are ocassional faulty data and I cant dumpster dive
Recite and explain how downscaling loses a lot
recite
at last line tell that increases accuracy dramatically because that much information is not lost compared to the loss of info in the 28x28
telll I am also working on it