SlideShare a Scribd company logo
1 of 7
Download to read offline
11/22/20085:42 PM Pacific


In Nothing Random on this Walk, I proposed that within the context of an Elliott
corrective flat pattern that started in 2000, we were in the midst of the 4th wave of a 5
wave C leg down from the October 2007 high. More specifically, I concluded that the 4th
wave was now a probable triangle.

In attempting to identify the pattern up from the October 10th low, I limited my analysis
to common wave 4 possibilities. This is simply building on the corrective flat thesis that
is unfolding with uncanny accuracy and therefore remains the most probable pattern
governing price action at the higher level of degree.

What are the possibilities for wave 4? There are really only 3 options to consider, a
zigzag, a flat, or a triangle. I discussed these in detail in the Buzz and Banter post
“Where are we?” Anything else disproves that the October 10th low was the end of wave
3. There are only 3 options instead of infinite possibilities. From a risk management
perspective, this is golden. But it still doesn’t make it easy, especially in this market.

Wave2
11/22/20085:42 PM Pacific


In Elliott wave analysis there is a tendency for wave 2 and 4 of a 5 wave motive set to be
different. It is not a rule, but it happens more often than not. Wave 2 was an A-B-C
zigzag which is shown on this NASDAQ e-mini chart which I published on May 14th
2008, suggesting the end of wave 2. The NASDAQ and S&P wave patterns were tracking
identically at that time and have been extremely close for most of this bear market. Since
wave 2 was a Zigzag, there is a bias for wave 4 to either be a triangle or a flat.

Viewing how price was presenting on October 24th, I published that the short-term
patterns presenting favored either a corrective flat or expanded flat retracement of the low
made on October 10th, 2008 (the probable end of wave 3). With the ensuing rally, it
appeared that a corrective flat (black labeled A-B-C) was a strong candidate.

                                     Flat 10/27/2008


On November 4th, 2008, I suggested to subscribers of Buzz & Banter and
TheMarketDetective.com that the short-term Fibonacci ratios for a wave 4 corrective flat
were no longer looking favorable. Here are the short-term charts I sent to
TheMarketDetective.com subscribers proposing that a turn down was imminent. That is
also when I published the Nothing Random on This walk article suggesting a triangle. It
was a simple process of elimination and probability. However, simple was not to be. I
have subsequently tried various 4th (and 5th wave) patterns on for size: the Running Flat,
The Barrier Triangle, and the Fifth Wave Diagonal.
11/22/20085:42 PM Pacific


Short-term forecast for down-turn on 11/04/2008


       Short-term targets on 11/05/2008
11/22/20085:42 PM Pacific


 Running Flat 11/14/2008


BarrierTriangle11/12/2008
11/22/20085:42 PM Pacific


                              5th wave Diagonal 11/13/2008


While the Running Flat seems to be the clear winner regarding price action, it is difficult
for me to identify a clean impulse wave substructure (5-3-5-3-5)-(5-3-5-3-5)-(5-3-5-3-5)
for the waves down from C on the Running Flat chart above. If this is the 5th wave, I
should be able to count an impulse wave structure.

I place importance on the substructure of waves in order to confirm the price action at the
higher levels of degree. To me this is a powerful tool for corroborating wave counts. Due
to the fractal nature of waves I should be able to dissect a wave on a weekly chart and
better understand its substructure by studying a daily chart, then dissect a daily chart by
studying an intra-day chart, etc. all the way down to a 2 or 3 minute chart to confirm the
higher-level counts.

In doing this, I still favor corrective wave substructures even on this move lower, on a
daily chart and smaller timeframes. The reason is that the impulse wave ratios are not
symmetrical to the degree that I commonly experience them to be, and there some small
rule violations required intra-day in order to make an impulse wave count work.
11/22/20085:42 PM Pacific


Therefore, I am compelled to investigate any remaining options to corroborate my
corrective substructure bias. There is one. In measuring the move down from A-B
relative to the move up from 3 to A on the chart below, I find that the ratio of B to A is
very close to 1.382, an acceptable and somewhat common ratio of B waves to A waves in
expanded flats. If this is the pattern we are in, and we just completed the B wave, we can
expect a sizeable rally, as indicated; a rally that may give investors the false sense that a
bottom is in.

                                      Expanded Flat


The Running flat could also be completed, or support one more wave down on an intra-
day chart. One more wave down (that goes lower) would only support the Running Flat
and eliminate the Expanded Flat from contention. I guess that would also mean that my
wave counting skills are going through a short-term corrective phase.

In summary, we probably turned the corner for an intermediate term rally or are very
close. The completion of the Expanded Flat thesis would mean one more wave down
after an intermediate term rally. Upon completion of the Running Flat thesis it is possible
that we are finished with 5 waves and have put in the low.
11/22/20085:42 PM Pacific


                                 Updated Running Flat


TMD/DW

The market detective provides personal market opinion based on sound technical
analysis and research. However, no warranty is given or implied as to its true reliability.
The market detective will make errors and mistakes. The market detective is not
an investment adviser and is not making recommendations to buy, sell, or place orders
relating to the futures contracts, ETFs, or stocks that he writes about. The responsibility
for decisions made from information contained in this service are solely that of the
individual subscriber. The individual must fully research and make his/her own
decisions before acting on any information provided by the market detective. The
market detective assumes no responsibility for subscriber investment or trading results.

More Related Content

More from guest20ee0

Tmd12232008 Evening Edition
Tmd12232008 Evening EditionTmd12232008 Evening Edition
Tmd12232008 Evening Editionguest20ee0
 
Tmdupdate120308
Tmdupdate120308Tmdupdate120308
Tmdupdate120308guest20ee0
 
Tmdupdate120208
Tmdupdate120208Tmdupdate120208
Tmdupdate120208guest20ee0
 
Tmd112508update
Tmd112508updateTmd112508update
Tmd112508updateguest20ee0
 
Tmd120209alert2
Tmd120209alert2Tmd120209alert2
Tmd120209alert2guest20ee0
 
Tmd010809 Evening Edition
Tmd010809 Evening EditionTmd010809 Evening Edition
Tmd010809 Evening Editionguest20ee0
 

More from guest20ee0 (7)

Tmd12232008 Evening Edition
Tmd12232008 Evening EditionTmd12232008 Evening Edition
Tmd12232008 Evening Edition
 
Tmdupdate120308
Tmdupdate120308Tmdupdate120308
Tmdupdate120308
 
Tmdupdate120208
Tmdupdate120208Tmdupdate120208
Tmdupdate120208
 
Tmd112508update
Tmd112508updateTmd112508update
Tmd112508update
 
Tmd092308
Tmd092308Tmd092308
Tmd092308
 
Tmd120209alert2
Tmd120209alert2Tmd120209alert2
Tmd120209alert2
 
Tmd010809 Evening Edition
Tmd010809 Evening EditionTmd010809 Evening Edition
Tmd010809 Evening Edition
 

Recently uploaded

Greek trade a pillar of dynamic economic growth - European Business Review
Greek trade a pillar of dynamic economic growth - European Business ReviewGreek trade a pillar of dynamic economic growth - European Business Review
Greek trade a pillar of dynamic economic growth - European Business ReviewAntonis Zairis
 
Digital Finance Summit 2024 Partners Brochure
Digital Finance Summit 2024 Partners BrochureDigital Finance Summit 2024 Partners Brochure
Digital Finance Summit 2024 Partners BrochureFinTech Belgium
 
Fintech Belgium General Assembly and Anniversary Event 2024
Fintech Belgium General Assembly and Anniversary Event 2024Fintech Belgium General Assembly and Anniversary Event 2024
Fintech Belgium General Assembly and Anniversary Event 2024FinTech Belgium
 
Severe Global Financial Crisis Triggered in 2008
Severe Global Financial Crisis Triggered in 2008Severe Global Financial Crisis Triggered in 2008
Severe Global Financial Crisis Triggered in 2008pravanbg1
 
Indirect tax .pptx Supply under GST, Charges of GST
Indirect tax .pptx  Supply under GST, Charges of GSTIndirect tax .pptx  Supply under GST, Charges of GST
Indirect tax .pptx Supply under GST, Charges of GSTmeghnagandhi5574
 
The Advantages of Choosing Falcon Invoice Discounting
The Advantages of Choosing Falcon Invoice DiscountingThe Advantages of Choosing Falcon Invoice Discounting
The Advantages of Choosing Falcon Invoice DiscountingFalcon Invoice Discounting
 
一比一原版Adelaide毕业证阿德莱德大学毕业证成绩单如何办理
一比一原版Adelaide毕业证阿德莱德大学毕业证成绩单如何办理一比一原版Adelaide毕业证阿德莱德大学毕业证成绩单如何办理
一比一原版Adelaide毕业证阿德莱德大学毕业证成绩单如何办理zsewypy
 
How do I unlock my locked Pi coins fast.
How do I unlock my locked Pi coins fast.How do I unlock my locked Pi coins fast.
How do I unlock my locked Pi coins fast.DOT TECH
 
is it possible to sell pi network coin in 2024.
is it possible to sell pi network coin in 2024.is it possible to sell pi network coin in 2024.
is it possible to sell pi network coin in 2024.DOT TECH
 
Next Cryptocurrencies to Explode in 2024.pdf
Next Cryptocurrencies to Explode in 2024.pdfNext Cryptocurrencies to Explode in 2024.pdf
Next Cryptocurrencies to Explode in 2024.pdfKezex (KZX)
 
How can I sell my pi coins in Indonesia?
How can I  sell my pi coins in Indonesia?How can I  sell my pi coins in Indonesia?
How can I sell my pi coins in Indonesia?DOT TECH
 
is pi Network coin available for sale in 2024
is pi Network coin available for sale in 2024is pi Network coin available for sale in 2024
is pi Network coin available for sale in 2024DOT TECH
 
how do i sell pi coins in Pakistan at the best rate.
how do i sell pi coins in Pakistan at the best rate.how do i sell pi coins in Pakistan at the best rate.
how do i sell pi coins in Pakistan at the best rate.DOT TECH
 
how can I sell my locked pi coins safety.
how can I sell my locked pi coins safety.how can I sell my locked pi coins safety.
how can I sell my locked pi coins safety.DOT TECH
 
Population Growth and Economic Development
Population Growth and  Economic DevelopmentPopulation Growth and  Economic Development
Population Growth and Economic Developmentyirgalemleaye
 
Jio Financial service Multibagger 2024 from India stock Market
Jio Financial service  Multibagger 2024 from India stock MarketJio Financial service  Multibagger 2024 from India stock Market
Jio Financial service Multibagger 2024 from India stock Marketfuturecapsadvisor
 
Human Capital: Education and Health in Economic Development
Human Capital:  Education and Health      in Economic DevelopmentHuman Capital:  Education and Health      in Economic Development
Human Capital: Education and Health in Economic Developmentyirgalemleaye
 
how do i convert pi coins to usdt easily.
how do i convert pi coins to usdt easily.how do i convert pi coins to usdt easily.
how do i convert pi coins to usdt easily.DOT TECH
 
how to sell pi coins in Canada, Uk and Australia
how to sell pi coins in Canada, Uk and Australiahow to sell pi coins in Canada, Uk and Australia
how to sell pi coins in Canada, Uk and AustraliaDOT TECH
 
Juspay Case study(Doubling Revenue Juspay's Success).pptx
Juspay Case study(Doubling Revenue Juspay's Success).pptxJuspay Case study(Doubling Revenue Juspay's Success).pptx
Juspay Case study(Doubling Revenue Juspay's Success).pptxaryan963438
 

Recently uploaded (20)

Greek trade a pillar of dynamic economic growth - European Business Review
Greek trade a pillar of dynamic economic growth - European Business ReviewGreek trade a pillar of dynamic economic growth - European Business Review
Greek trade a pillar of dynamic economic growth - European Business Review
 
Digital Finance Summit 2024 Partners Brochure
Digital Finance Summit 2024 Partners BrochureDigital Finance Summit 2024 Partners Brochure
Digital Finance Summit 2024 Partners Brochure
 
Fintech Belgium General Assembly and Anniversary Event 2024
Fintech Belgium General Assembly and Anniversary Event 2024Fintech Belgium General Assembly and Anniversary Event 2024
Fintech Belgium General Assembly and Anniversary Event 2024
 
Severe Global Financial Crisis Triggered in 2008
Severe Global Financial Crisis Triggered in 2008Severe Global Financial Crisis Triggered in 2008
Severe Global Financial Crisis Triggered in 2008
 
Indirect tax .pptx Supply under GST, Charges of GST
Indirect tax .pptx  Supply under GST, Charges of GSTIndirect tax .pptx  Supply under GST, Charges of GST
Indirect tax .pptx Supply under GST, Charges of GST
 
The Advantages of Choosing Falcon Invoice Discounting
The Advantages of Choosing Falcon Invoice DiscountingThe Advantages of Choosing Falcon Invoice Discounting
The Advantages of Choosing Falcon Invoice Discounting
 
一比一原版Adelaide毕业证阿德莱德大学毕业证成绩单如何办理
一比一原版Adelaide毕业证阿德莱德大学毕业证成绩单如何办理一比一原版Adelaide毕业证阿德莱德大学毕业证成绩单如何办理
一比一原版Adelaide毕业证阿德莱德大学毕业证成绩单如何办理
 
How do I unlock my locked Pi coins fast.
How do I unlock my locked Pi coins fast.How do I unlock my locked Pi coins fast.
How do I unlock my locked Pi coins fast.
 
is it possible to sell pi network coin in 2024.
is it possible to sell pi network coin in 2024.is it possible to sell pi network coin in 2024.
is it possible to sell pi network coin in 2024.
 
Next Cryptocurrencies to Explode in 2024.pdf
Next Cryptocurrencies to Explode in 2024.pdfNext Cryptocurrencies to Explode in 2024.pdf
Next Cryptocurrencies to Explode in 2024.pdf
 
How can I sell my pi coins in Indonesia?
How can I  sell my pi coins in Indonesia?How can I  sell my pi coins in Indonesia?
How can I sell my pi coins in Indonesia?
 
is pi Network coin available for sale in 2024
is pi Network coin available for sale in 2024is pi Network coin available for sale in 2024
is pi Network coin available for sale in 2024
 
how do i sell pi coins in Pakistan at the best rate.
how do i sell pi coins in Pakistan at the best rate.how do i sell pi coins in Pakistan at the best rate.
how do i sell pi coins in Pakistan at the best rate.
 
how can I sell my locked pi coins safety.
how can I sell my locked pi coins safety.how can I sell my locked pi coins safety.
how can I sell my locked pi coins safety.
 
Population Growth and Economic Development
Population Growth and  Economic DevelopmentPopulation Growth and  Economic Development
Population Growth and Economic Development
 
Jio Financial service Multibagger 2024 from India stock Market
Jio Financial service  Multibagger 2024 from India stock MarketJio Financial service  Multibagger 2024 from India stock Market
Jio Financial service Multibagger 2024 from India stock Market
 
Human Capital: Education and Health in Economic Development
Human Capital:  Education and Health      in Economic DevelopmentHuman Capital:  Education and Health      in Economic Development
Human Capital: Education and Health in Economic Development
 
how do i convert pi coins to usdt easily.
how do i convert pi coins to usdt easily.how do i convert pi coins to usdt easily.
how do i convert pi coins to usdt easily.
 
how to sell pi coins in Canada, Uk and Australia
how to sell pi coins in Canada, Uk and Australiahow to sell pi coins in Canada, Uk and Australia
how to sell pi coins in Canada, Uk and Australia
 
Juspay Case study(Doubling Revenue Juspay's Success).pptx
Juspay Case study(Doubling Revenue Juspay's Success).pptxJuspay Case study(Doubling Revenue Juspay's Success).pptx
Juspay Case study(Doubling Revenue Juspay's Success).pptx
 

Tmd11222008weekendedition

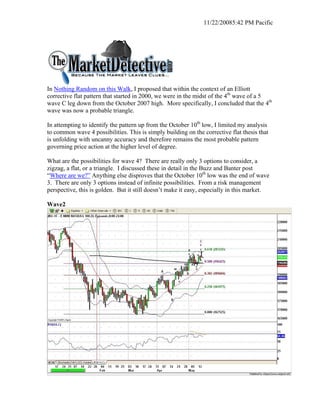
  • 1. 11/22/20085:42 PM Pacific In Nothing Random on this Walk, I proposed that within the context of an Elliott corrective flat pattern that started in 2000, we were in the midst of the 4th wave of a 5 wave C leg down from the October 2007 high. More specifically, I concluded that the 4th wave was now a probable triangle. In attempting to identify the pattern up from the October 10th low, I limited my analysis to common wave 4 possibilities. This is simply building on the corrective flat thesis that is unfolding with uncanny accuracy and therefore remains the most probable pattern governing price action at the higher level of degree. What are the possibilities for wave 4? There are really only 3 options to consider, a zigzag, a flat, or a triangle. I discussed these in detail in the Buzz and Banter post “Where are we?” Anything else disproves that the October 10th low was the end of wave 3. There are only 3 options instead of infinite possibilities. From a risk management perspective, this is golden. But it still doesn’t make it easy, especially in this market. Wave2
  • 2. 11/22/20085:42 PM Pacific In Elliott wave analysis there is a tendency for wave 2 and 4 of a 5 wave motive set to be different. It is not a rule, but it happens more often than not. Wave 2 was an A-B-C zigzag which is shown on this NASDAQ e-mini chart which I published on May 14th 2008, suggesting the end of wave 2. The NASDAQ and S&P wave patterns were tracking identically at that time and have been extremely close for most of this bear market. Since wave 2 was a Zigzag, there is a bias for wave 4 to either be a triangle or a flat. Viewing how price was presenting on October 24th, I published that the short-term patterns presenting favored either a corrective flat or expanded flat retracement of the low made on October 10th, 2008 (the probable end of wave 3). With the ensuing rally, it appeared that a corrective flat (black labeled A-B-C) was a strong candidate. Flat 10/27/2008 On November 4th, 2008, I suggested to subscribers of Buzz & Banter and TheMarketDetective.com that the short-term Fibonacci ratios for a wave 4 corrective flat were no longer looking favorable. Here are the short-term charts I sent to TheMarketDetective.com subscribers proposing that a turn down was imminent. That is also when I published the Nothing Random on This walk article suggesting a triangle. It was a simple process of elimination and probability. However, simple was not to be. I have subsequently tried various 4th (and 5th wave) patterns on for size: the Running Flat, The Barrier Triangle, and the Fifth Wave Diagonal.
  • 3. 11/22/20085:42 PM Pacific Short-term forecast for down-turn on 11/04/2008 Short-term targets on 11/05/2008
  • 4. 11/22/20085:42 PM Pacific Running Flat 11/14/2008 BarrierTriangle11/12/2008
  • 5. 11/22/20085:42 PM Pacific 5th wave Diagonal 11/13/2008 While the Running Flat seems to be the clear winner regarding price action, it is difficult for me to identify a clean impulse wave substructure (5-3-5-3-5)-(5-3-5-3-5)-(5-3-5-3-5) for the waves down from C on the Running Flat chart above. If this is the 5th wave, I should be able to count an impulse wave structure. I place importance on the substructure of waves in order to confirm the price action at the higher levels of degree. To me this is a powerful tool for corroborating wave counts. Due to the fractal nature of waves I should be able to dissect a wave on a weekly chart and better understand its substructure by studying a daily chart, then dissect a daily chart by studying an intra-day chart, etc. all the way down to a 2 or 3 minute chart to confirm the higher-level counts. In doing this, I still favor corrective wave substructures even on this move lower, on a daily chart and smaller timeframes. The reason is that the impulse wave ratios are not symmetrical to the degree that I commonly experience them to be, and there some small rule violations required intra-day in order to make an impulse wave count work.
  • 6. 11/22/20085:42 PM Pacific Therefore, I am compelled to investigate any remaining options to corroborate my corrective substructure bias. There is one. In measuring the move down from A-B relative to the move up from 3 to A on the chart below, I find that the ratio of B to A is very close to 1.382, an acceptable and somewhat common ratio of B waves to A waves in expanded flats. If this is the pattern we are in, and we just completed the B wave, we can expect a sizeable rally, as indicated; a rally that may give investors the false sense that a bottom is in. Expanded Flat The Running flat could also be completed, or support one more wave down on an intra- day chart. One more wave down (that goes lower) would only support the Running Flat and eliminate the Expanded Flat from contention. I guess that would also mean that my wave counting skills are going through a short-term corrective phase. In summary, we probably turned the corner for an intermediate term rally or are very close. The completion of the Expanded Flat thesis would mean one more wave down after an intermediate term rally. Upon completion of the Running Flat thesis it is possible that we are finished with 5 waves and have put in the low.
  • 7. 11/22/20085:42 PM Pacific Updated Running Flat TMD/DW The market detective provides personal market opinion based on sound technical analysis and research. However, no warranty is given or implied as to its true reliability. The market detective will make errors and mistakes. The market detective is not an investment adviser and is not making recommendations to buy, sell, or place orders relating to the futures contracts, ETFs, or stocks that he writes about. The responsibility for decisions made from information contained in this service are solely that of the individual subscriber. The individual must fully research and make his/her own decisions before acting on any information provided by the market detective. The market detective assumes no responsibility for subscriber investment or trading results.