
More Related Content
More from demetra512
Title of the precentation
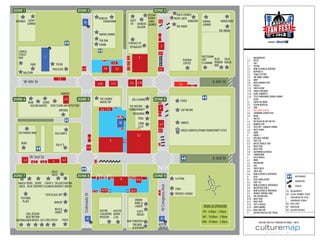
- 1. ZONE 1 ZONE 2 ZONE 3 GEISHA BUCA LOUNGE KENICHI ROOM/ MEXIC-ARTE ANTONES LUCKY 2A CHINATOWN SUITE LANAI 3.6 KINGDOM KARMA HANDLEBAR LOUNGE 101 SHINERS LOUNGE LOUNGE SALOON THE MARQ THE ONION HAVEN LOUNGE 3.3 TEN OAK FRANK TERRACE 59 SPEAKEASY 3 LAVACA STREET 3.1 BAR 1 2.3 2 WESTBANK 1 BAZAARVOICE TEXENZA DRY BLUE TACO PEPSI 2.16 1.2 PECHE 2.5 2.2 COFFEE CLEANING RIBBON SHACK 2 FIAT FADO BBQ 2.1 PATIKA TRULUCKS 2.13 2.8 2.6 2.1 3.2 2.2 NON-ALCOHOLIC BEVERGE 2.3 ROPPOLO’S HALCYON 2.4 TEXAS LOTTERY 2.5 THE WINE LOUNGE 1.2 2.6 EBAY W 4th St 2.15 2.11 2.4 2.12 E 4th St 2.8 BEER GARDEN TENT 3.4 3.5 2.11 PIRELLI 2.12 TURF N SURF 2.13 CHASE FREEDOM HANGER 2.15 ALMS CONQUEST 2.16 TITO‘S HOMEMADE VODKA LOUNGE ZONE 4 4.5 ZONE 5 SIX LOUNGE JOS A BANKS ZONE 6 FEDEX 3 ACVB RAIN SCORE MIX3R TAP 6.6 3.1 ESPN THE HORN OILCAN HARRYS DICK CLARK ARCHITECTURE 3.2 SETON HOSPITAL 5.9 THE NATURE 6 3.3 CNN IMPERIA 5.6 5.7 CONSERVANCY CAP METRO 3.4 WELCOME CENTER PATAGONIA 6.4 3.5 COMMAND CENTER OPS 5.10 5.11 3.6 KXAN YOGA 4 MATTEL 4.2 DR SEUSS BY ART ON 5TH 5B CORK 6.3 ANNIES 4.3 BUNGEE GYM & CO 4.5 COTA VIP - HANGAR LOUNGE 5.12 4.6 RACE STARS 6.1 DRESS SHOP/ELEPHANT ROOM/SWIFT ATTIC THE GINGER MAN SULLIVAN’S 4.7 ARMY 5.1 5 MOBIL 1 5.3 5.1 RED BULL RACING 5 5.2 CHEF TAI BOBS 6.2 5.3 ARTIST MERCH TENT SULLY’S 5.6 BEER TENT 5.8 BEER TENT 5.7 5.8 AUTOMOBILIA MERCH 5.9 JUMBOTRON W 3rd St E 3rd St 6 COTA MERCH 4.3 4 4.2 6.1 BMW 4.7 4.6 5.2 6.2 MOTOREUM 6.3 ISIS 6.4 TOPO CHICO DAILY 6.5 FIRST AID JUICE 8.12 6.6 NON-ALCOHOLIC BEVERAGE ZONE 7 ZONE 8 8.13 ZONE 9 8 AT&T - RESTROOMS 8.7 8.3 8.1 8.5 8.6 LA PENA 8 8.8 8.1 AT&T SIMULATORS 8.2 CHEF TAI - SHOWCARS WHICH ROYAL SERVE CATHY’S DELISH CANTINA NON-ALCOHOLIC BEVERAGES 8.3 N Congress Ave WICH BLUE GOURMET CLEANERS BAKERY LAREDO 8.5 BACKSTAGE GRILL - STAGES 8.10 COPA 8.14 8.11 8.6 NON-ALCOHOLIC BEVERAGE 1A - BAZAARVOICE 9 MÉDUSE LOUNGE 8.7 DOUBLE TROUBLE BBQ 2A - CLEAR CHANNEL STAGE 1020 GLASS ART Colorado St 8.8 THE RACING BUG PEYTONS PRESENTED BY TITOS URBAN 8.10 BEER TENT PLACE 8.11 BEER TENT HANDMADE VODKA BARCHI WINE & 5B - BUD LIGHT 8.12 TIFF’S TREATS LIQUOR HOURS OF OPERATION 8.13 SONY GAMING 8C - UNIVISION MILK & AUSTIN 8.14 BUD LIGHT VIP 9D - AUSTIN CREATES HONEY AUSTIN CAFFE FRI - 6:00pm - 2:00am 9 AUSTIN CREATES ART TRUCK GIRL DESIGN CHILDRENS BERRY MEDICI NEXT WITHIN MUSEUM 2 GO SAT - 10:00am - 2:00am 8C 9D TAVERNA DOOR REACH JO’S CRU ESTILO PRIZE BAR CONGRESS SUN - 10:00am - 2:00am EXPLORE FAN FEST POWERED BY MOBIL 1 WITH 2ND BAR AUSTIN & KITCHEN CREATES