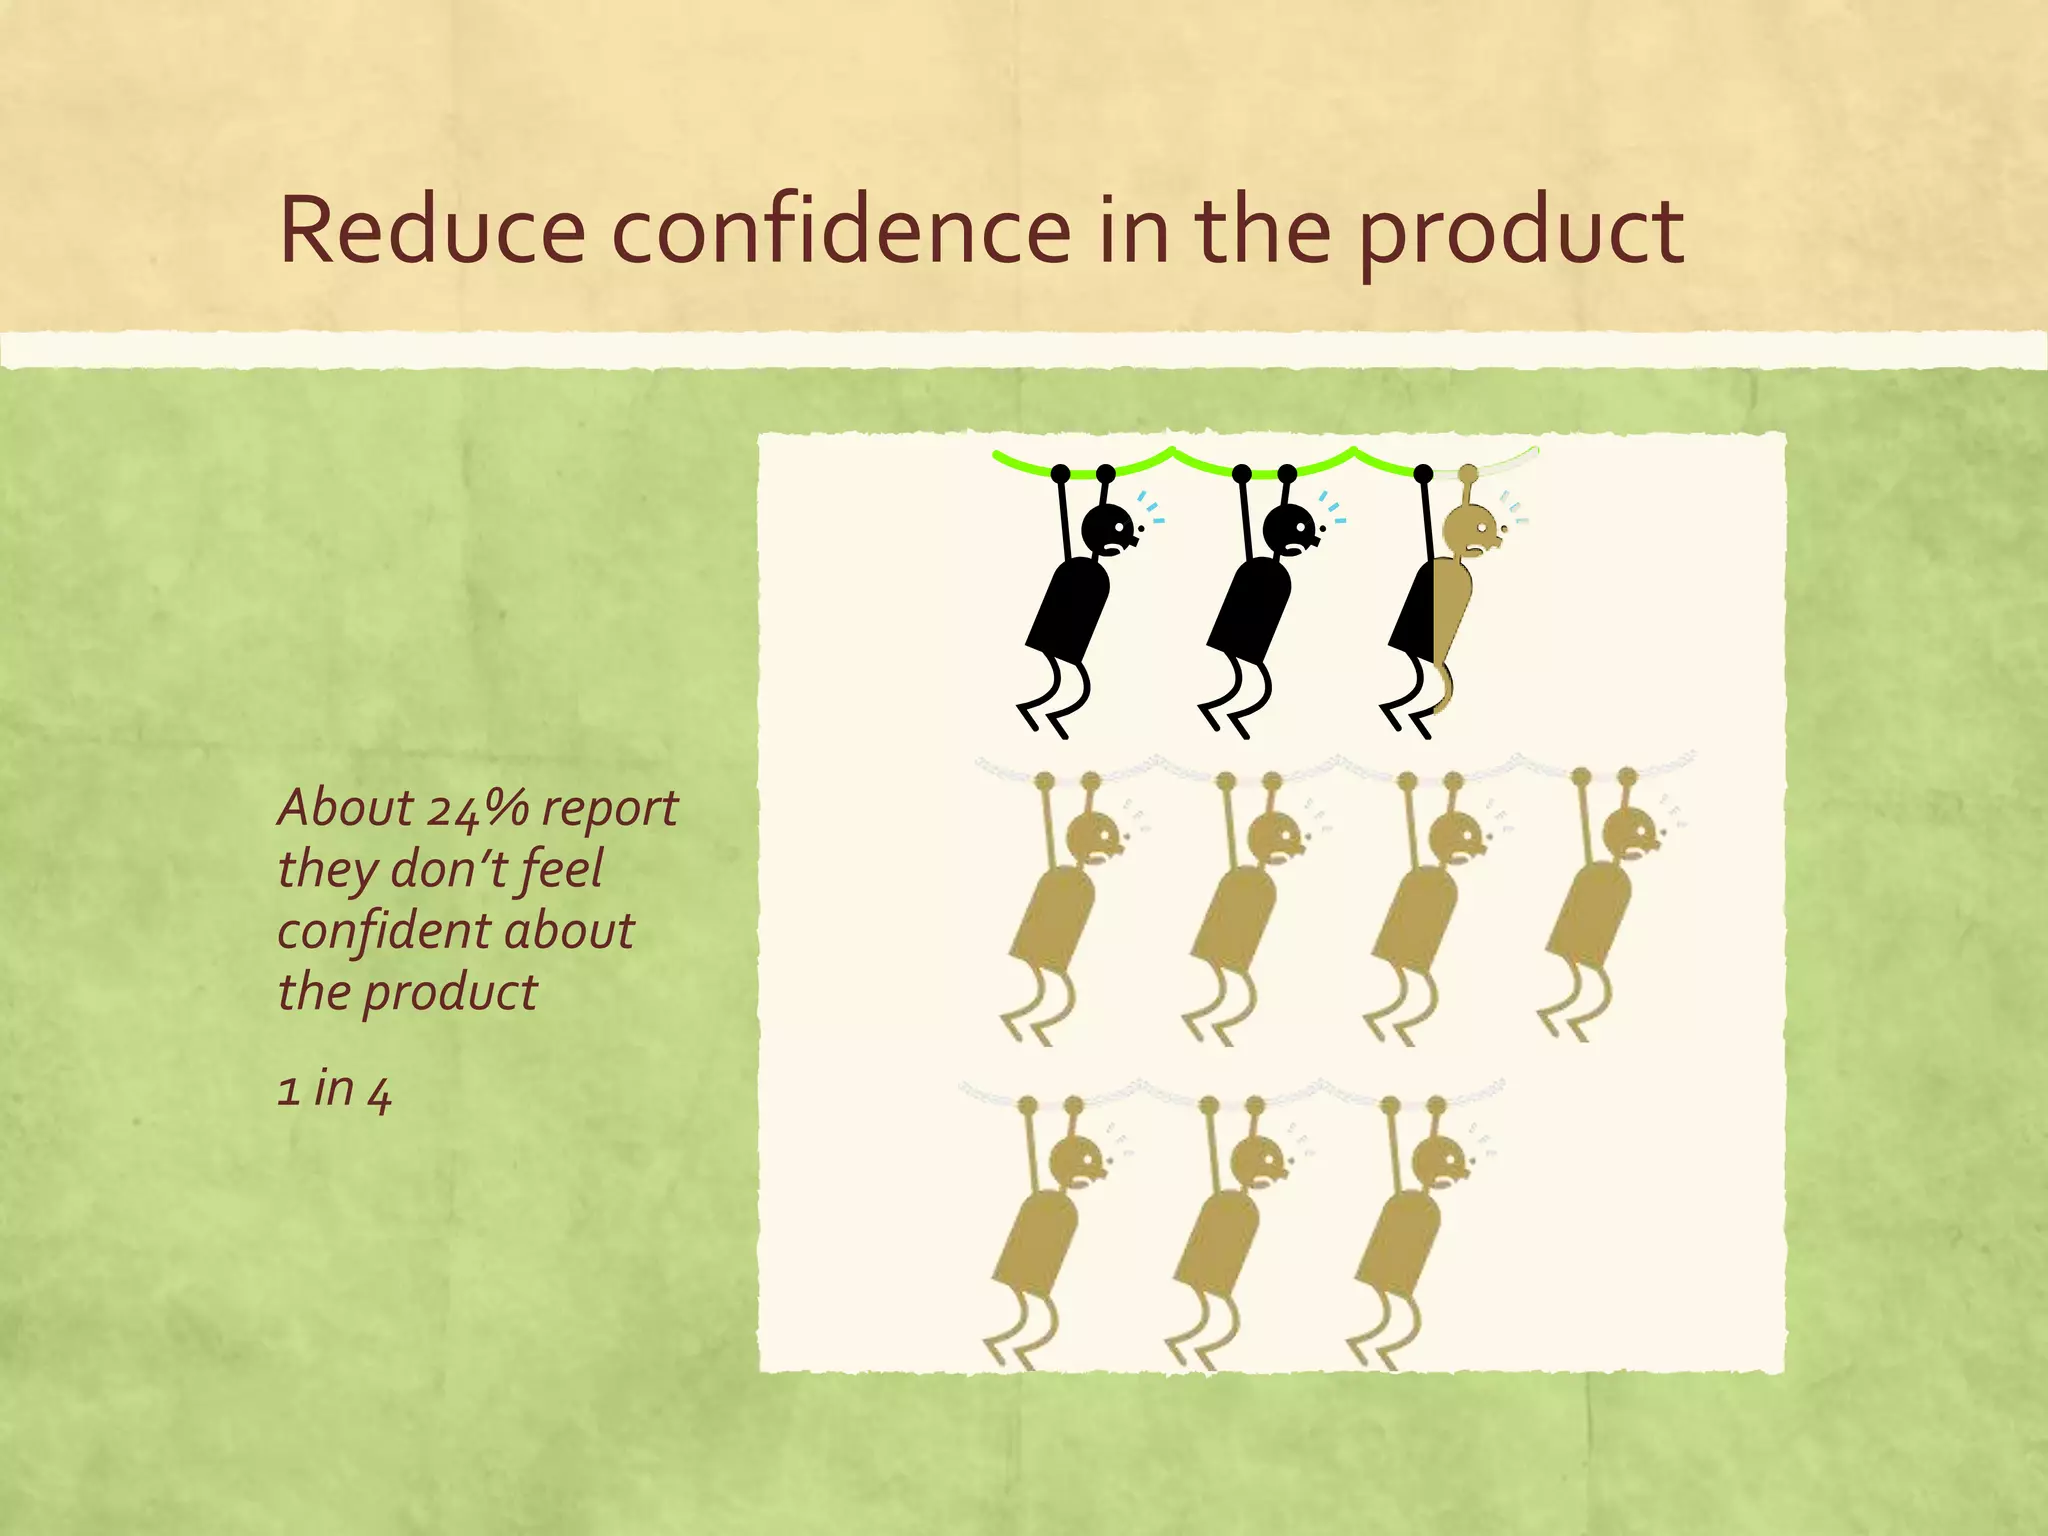
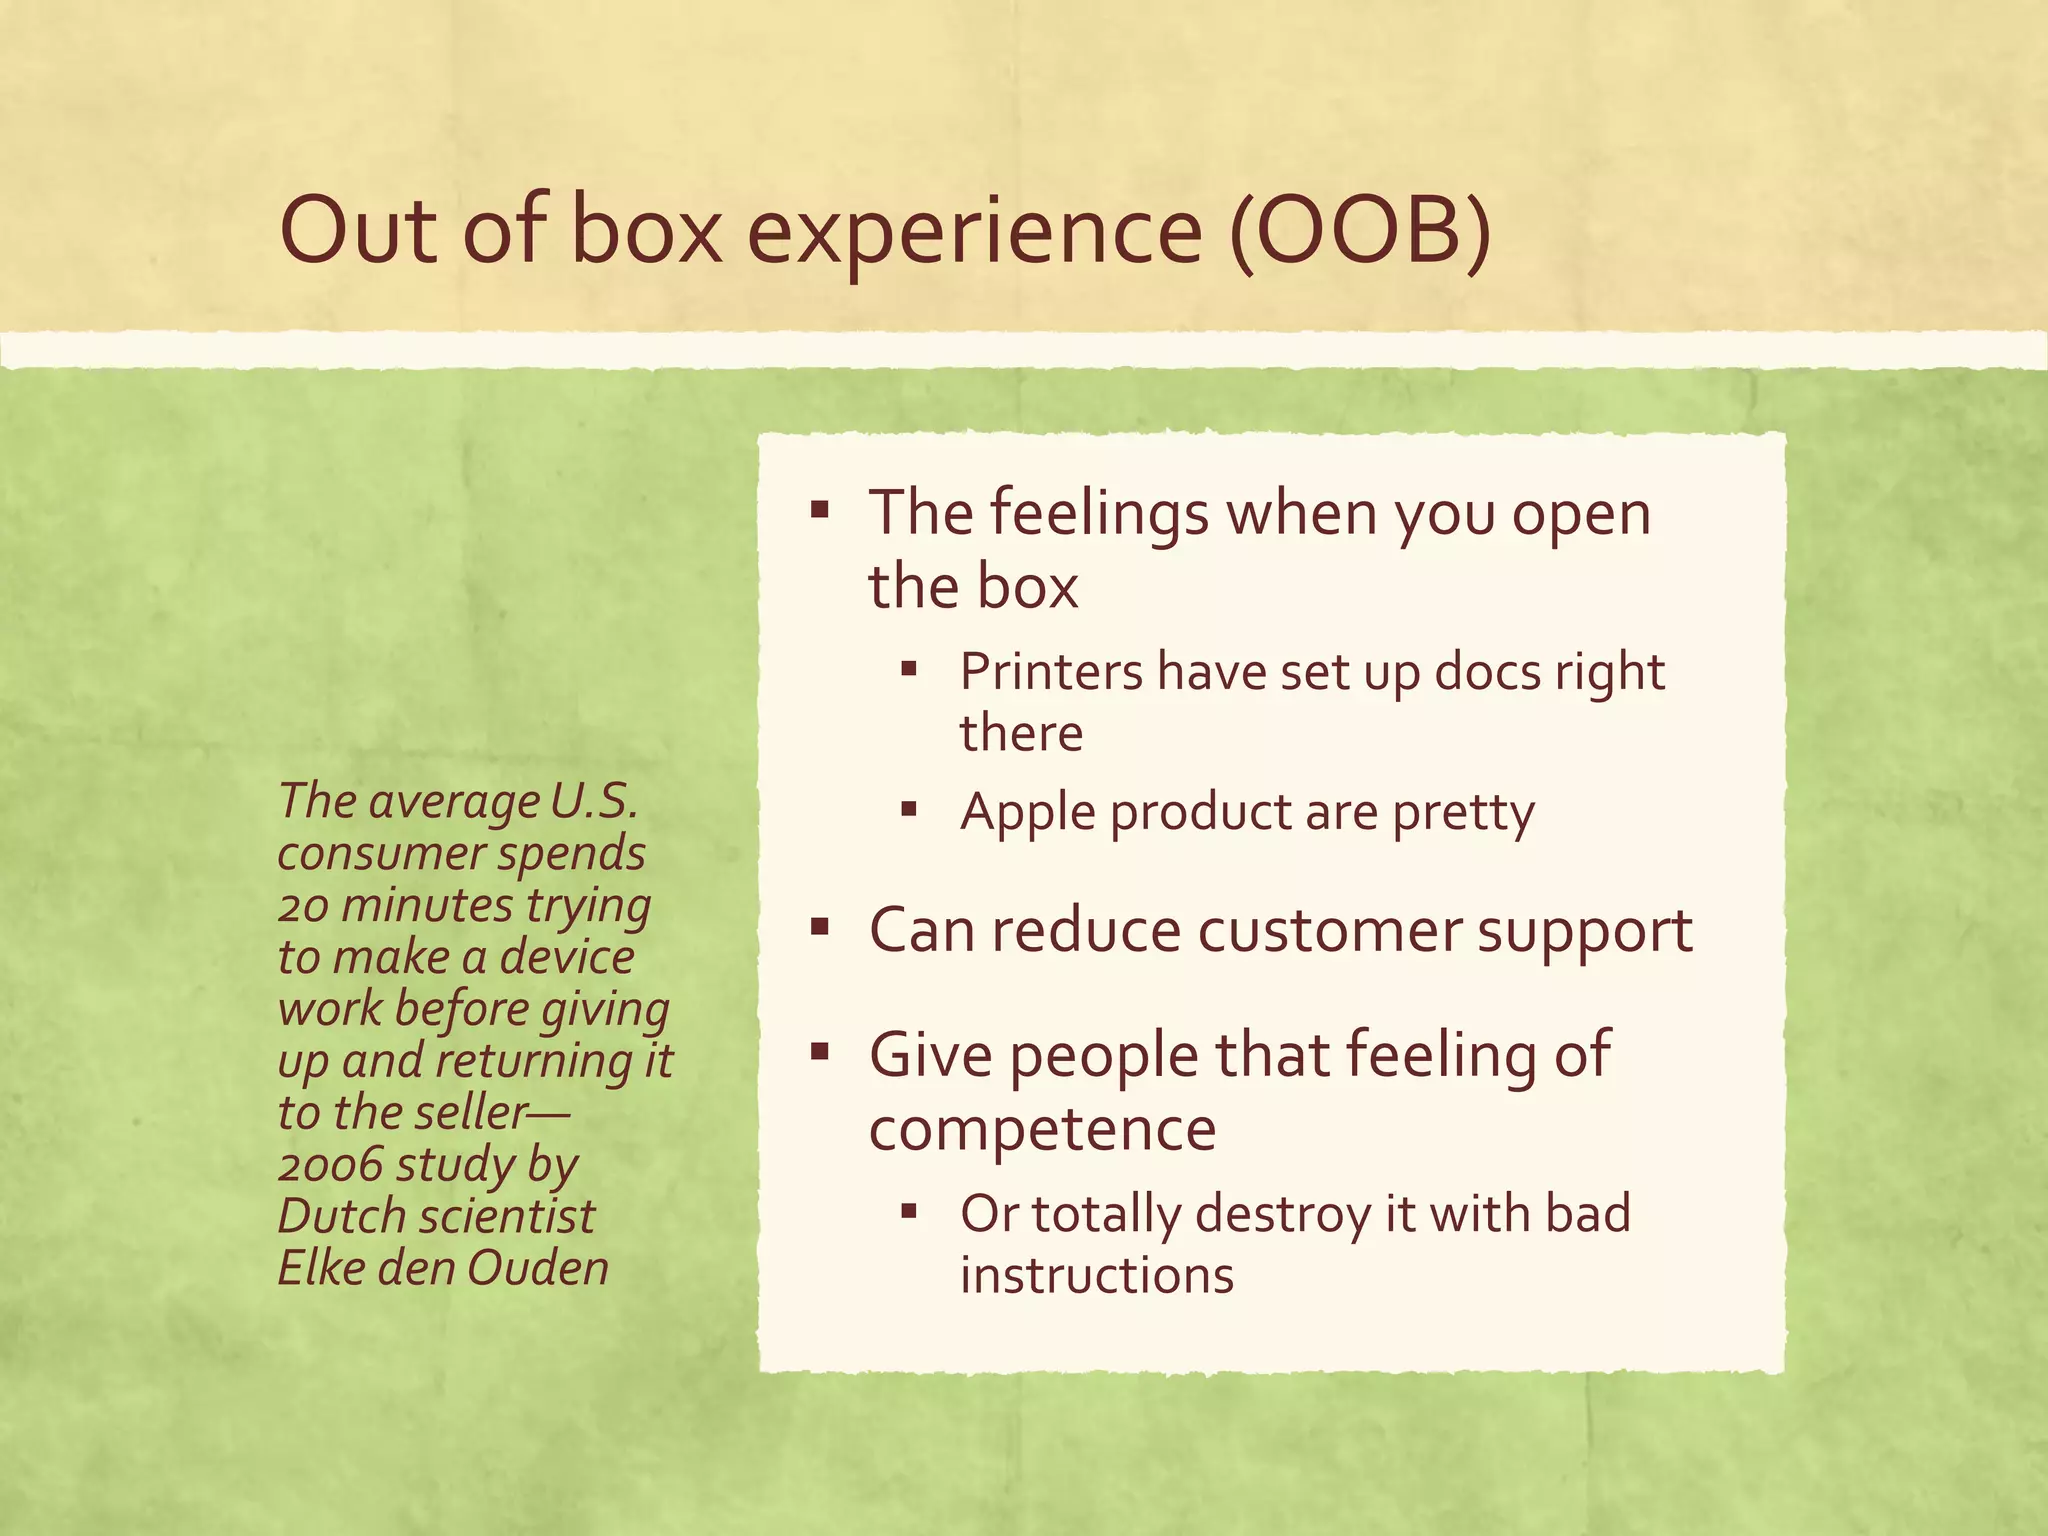
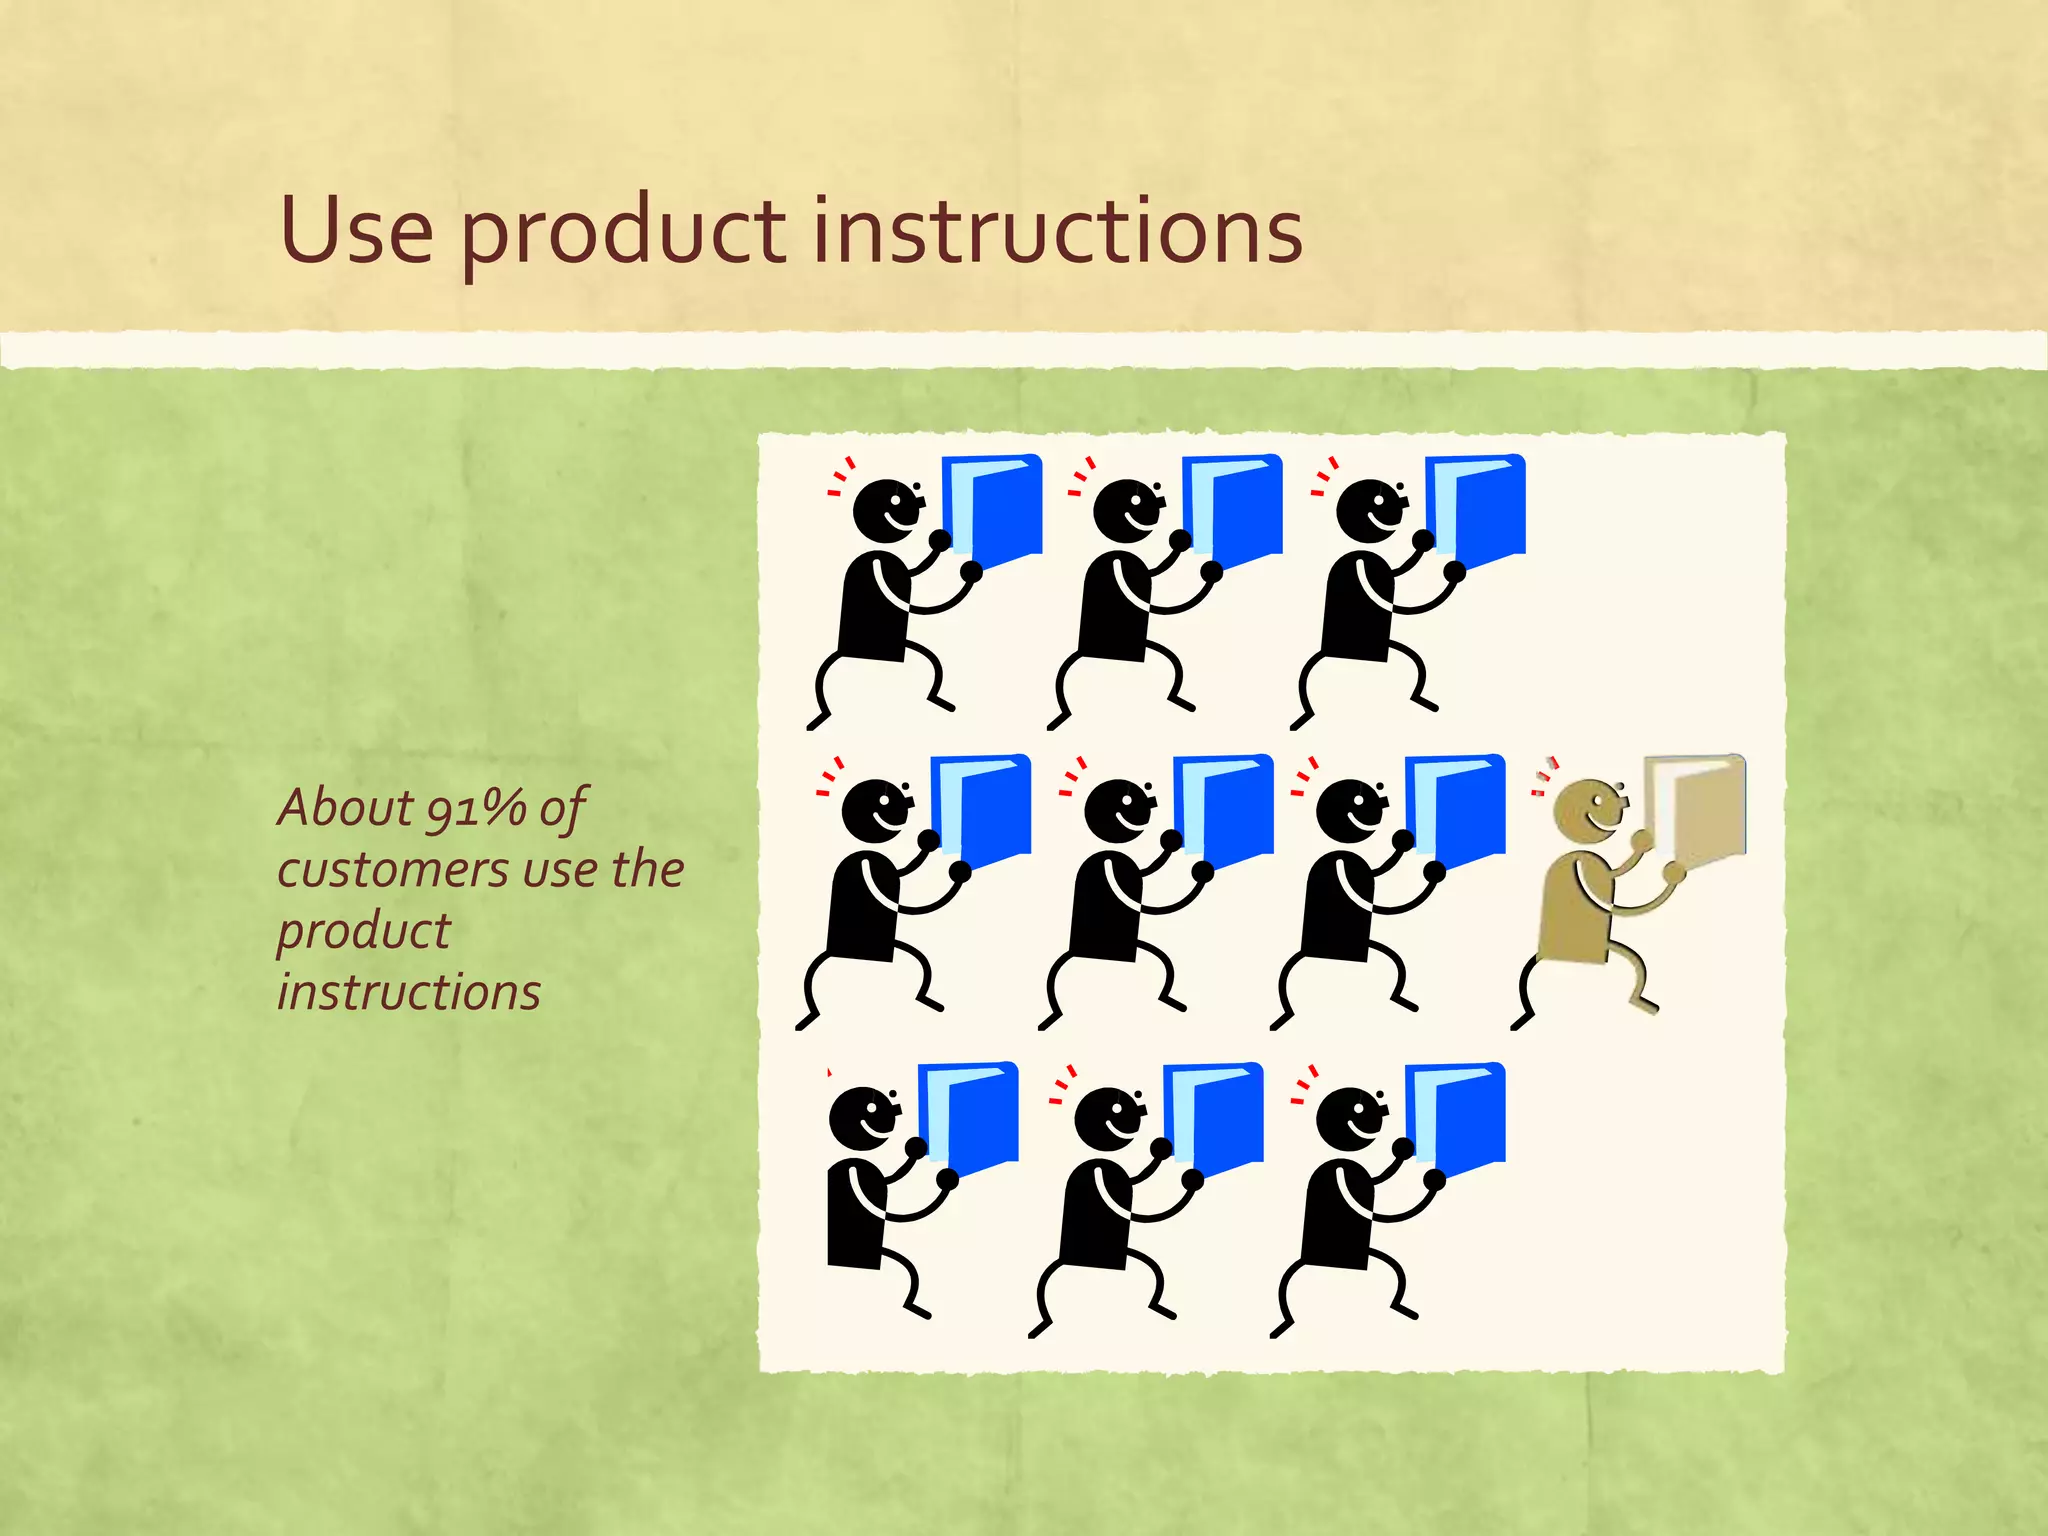
Download to read offline


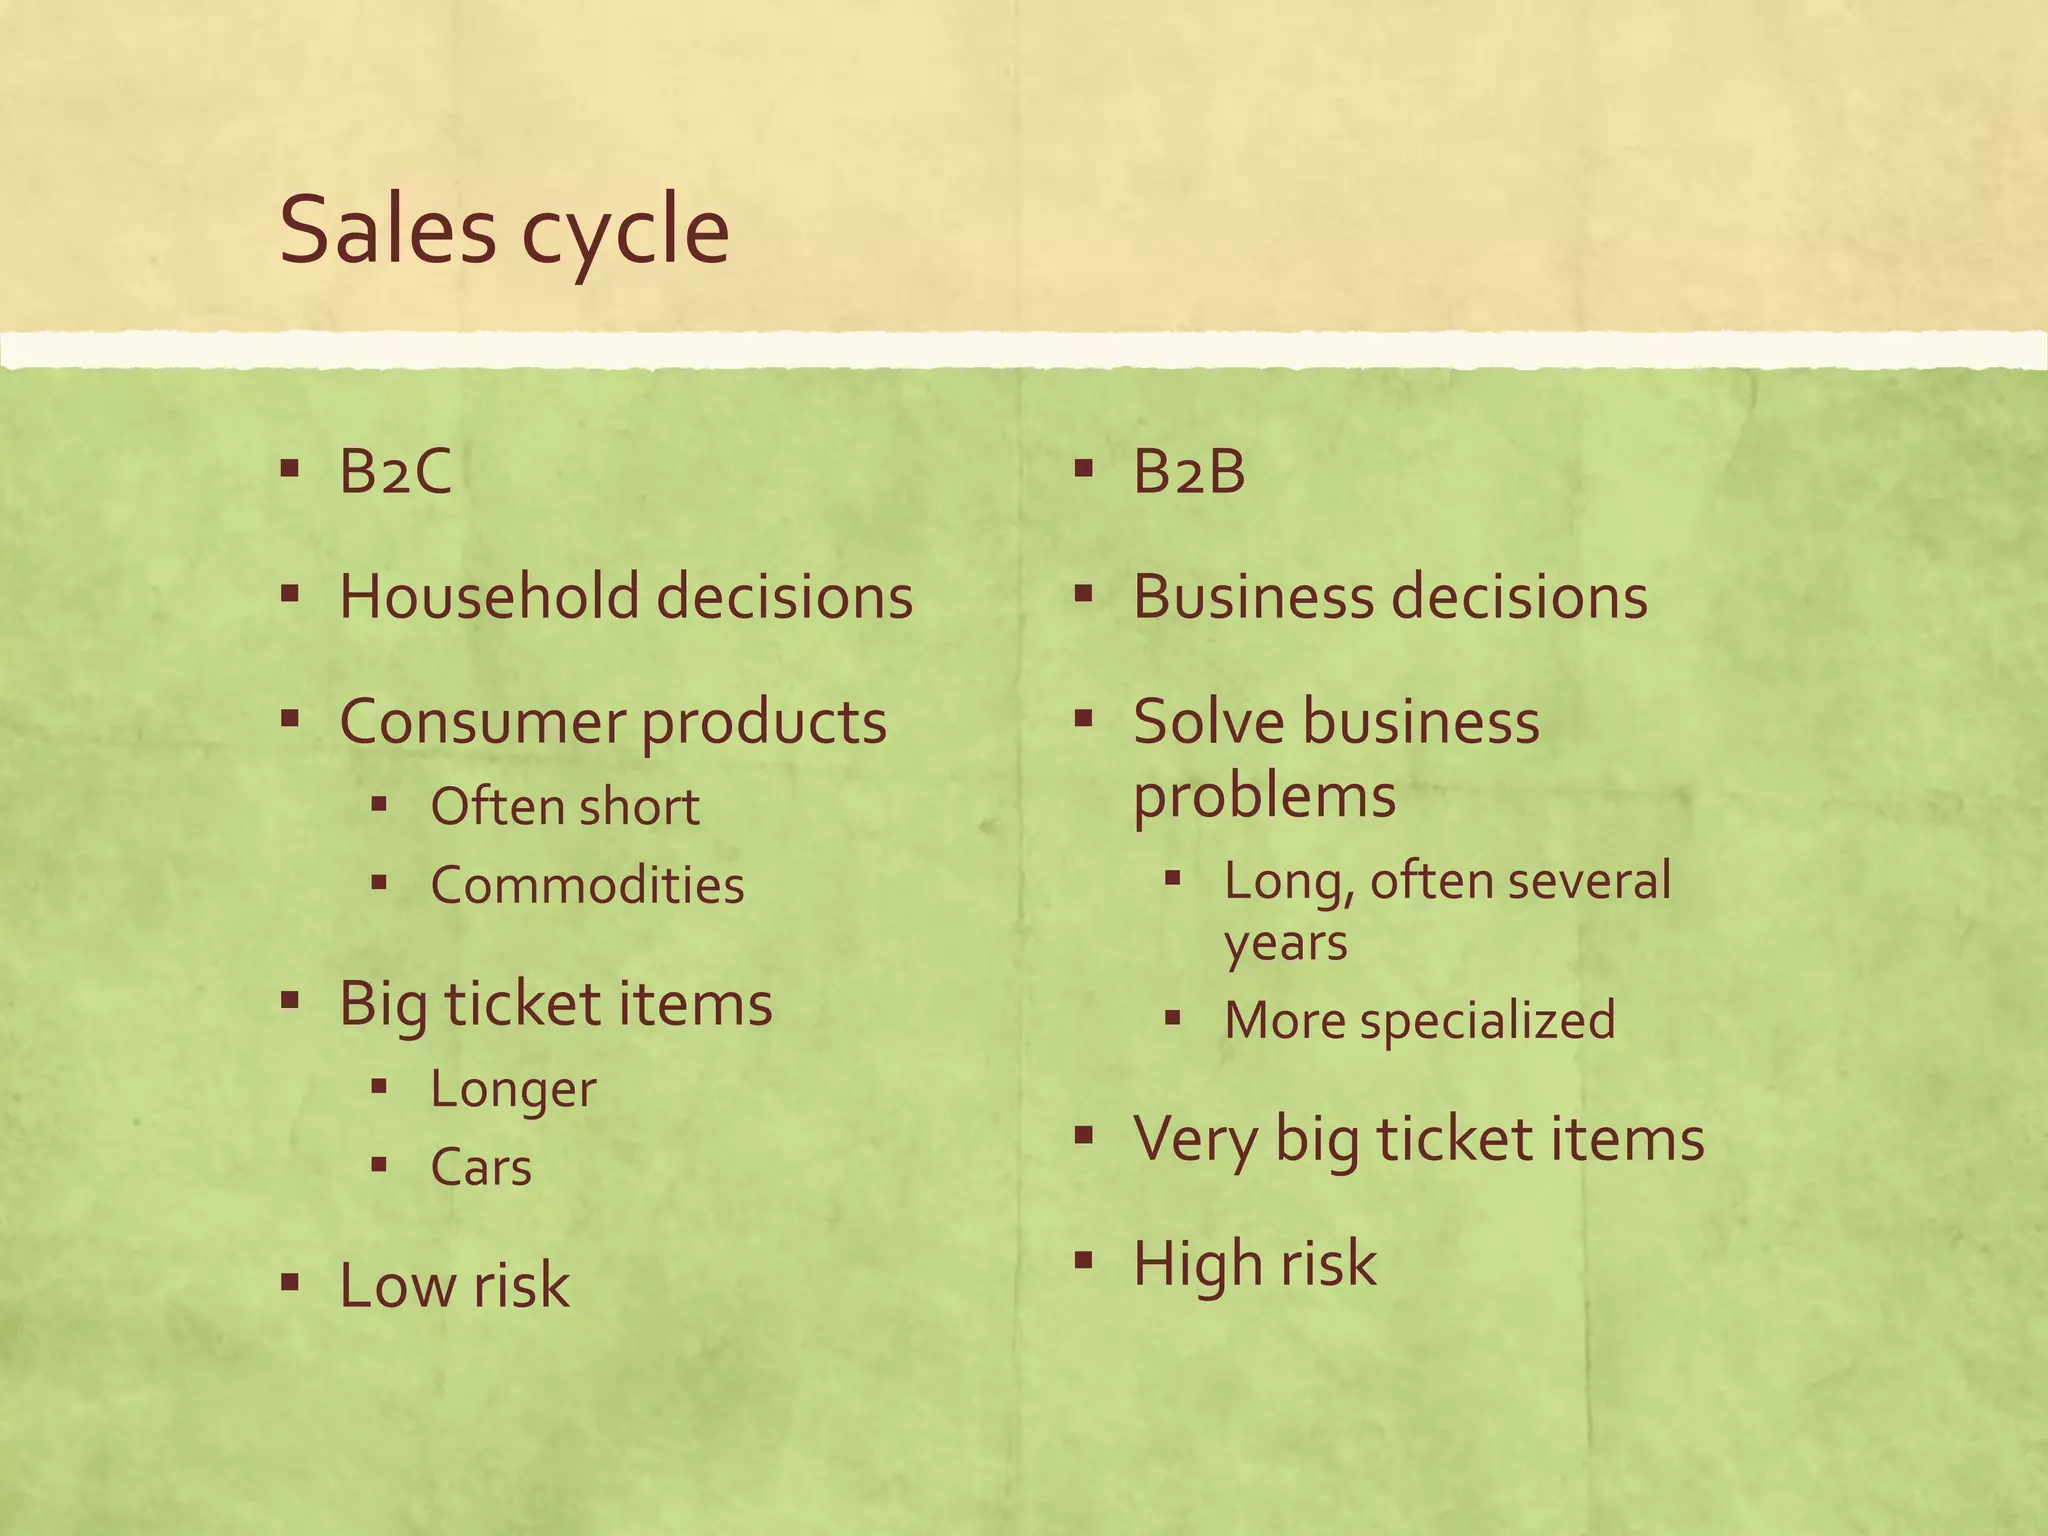
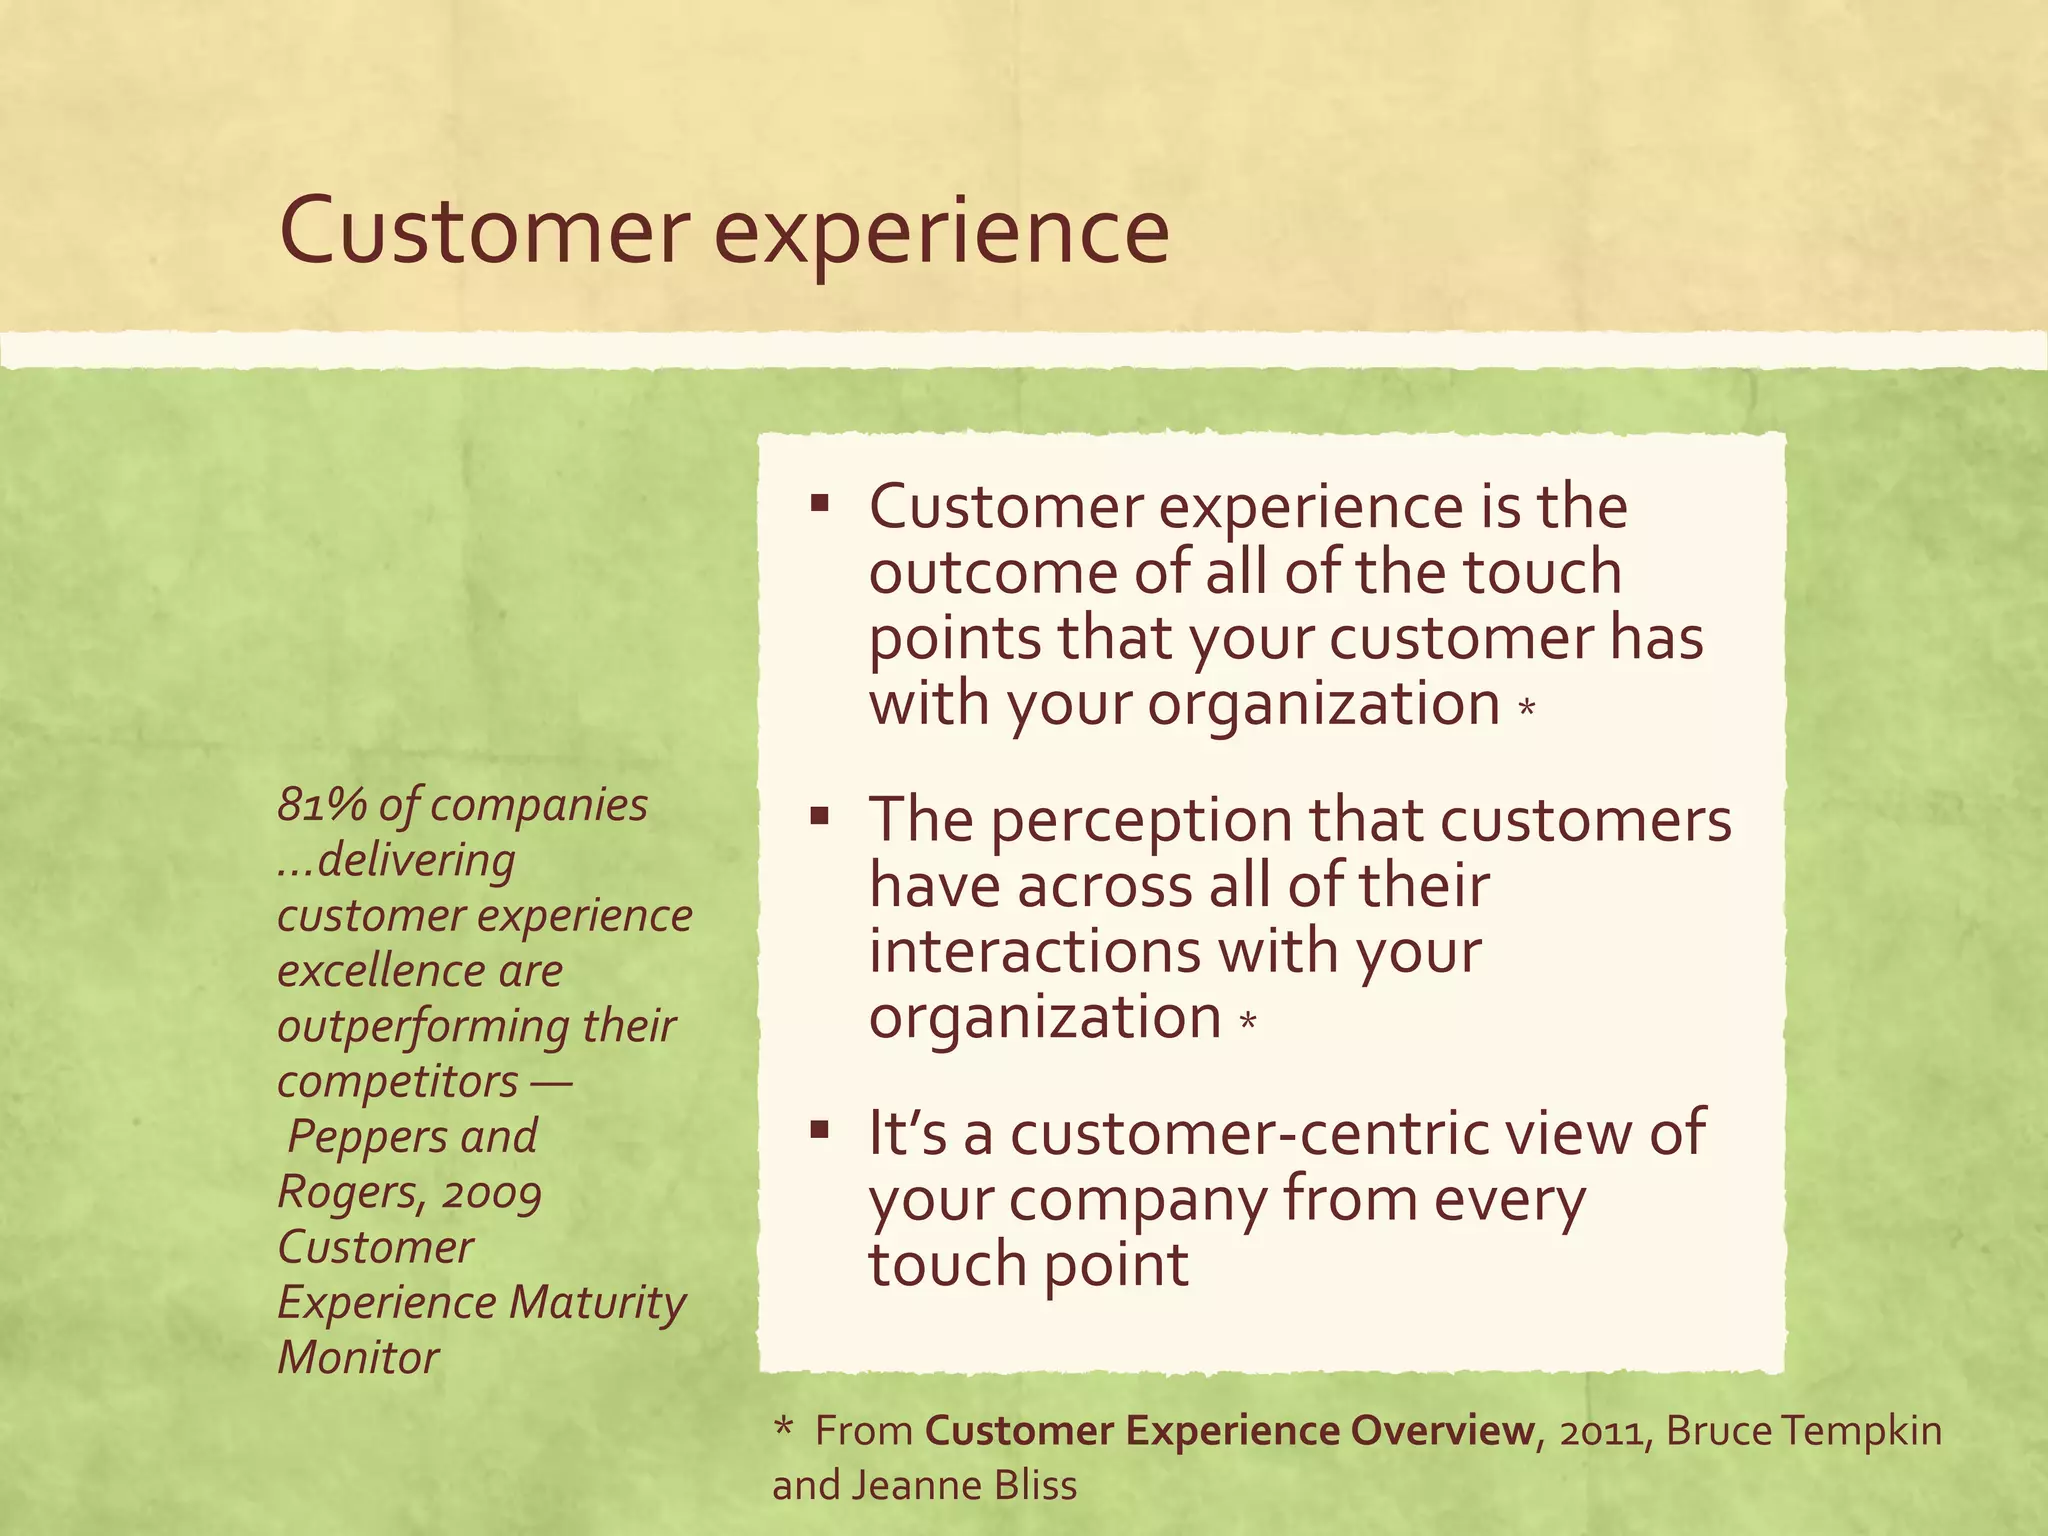
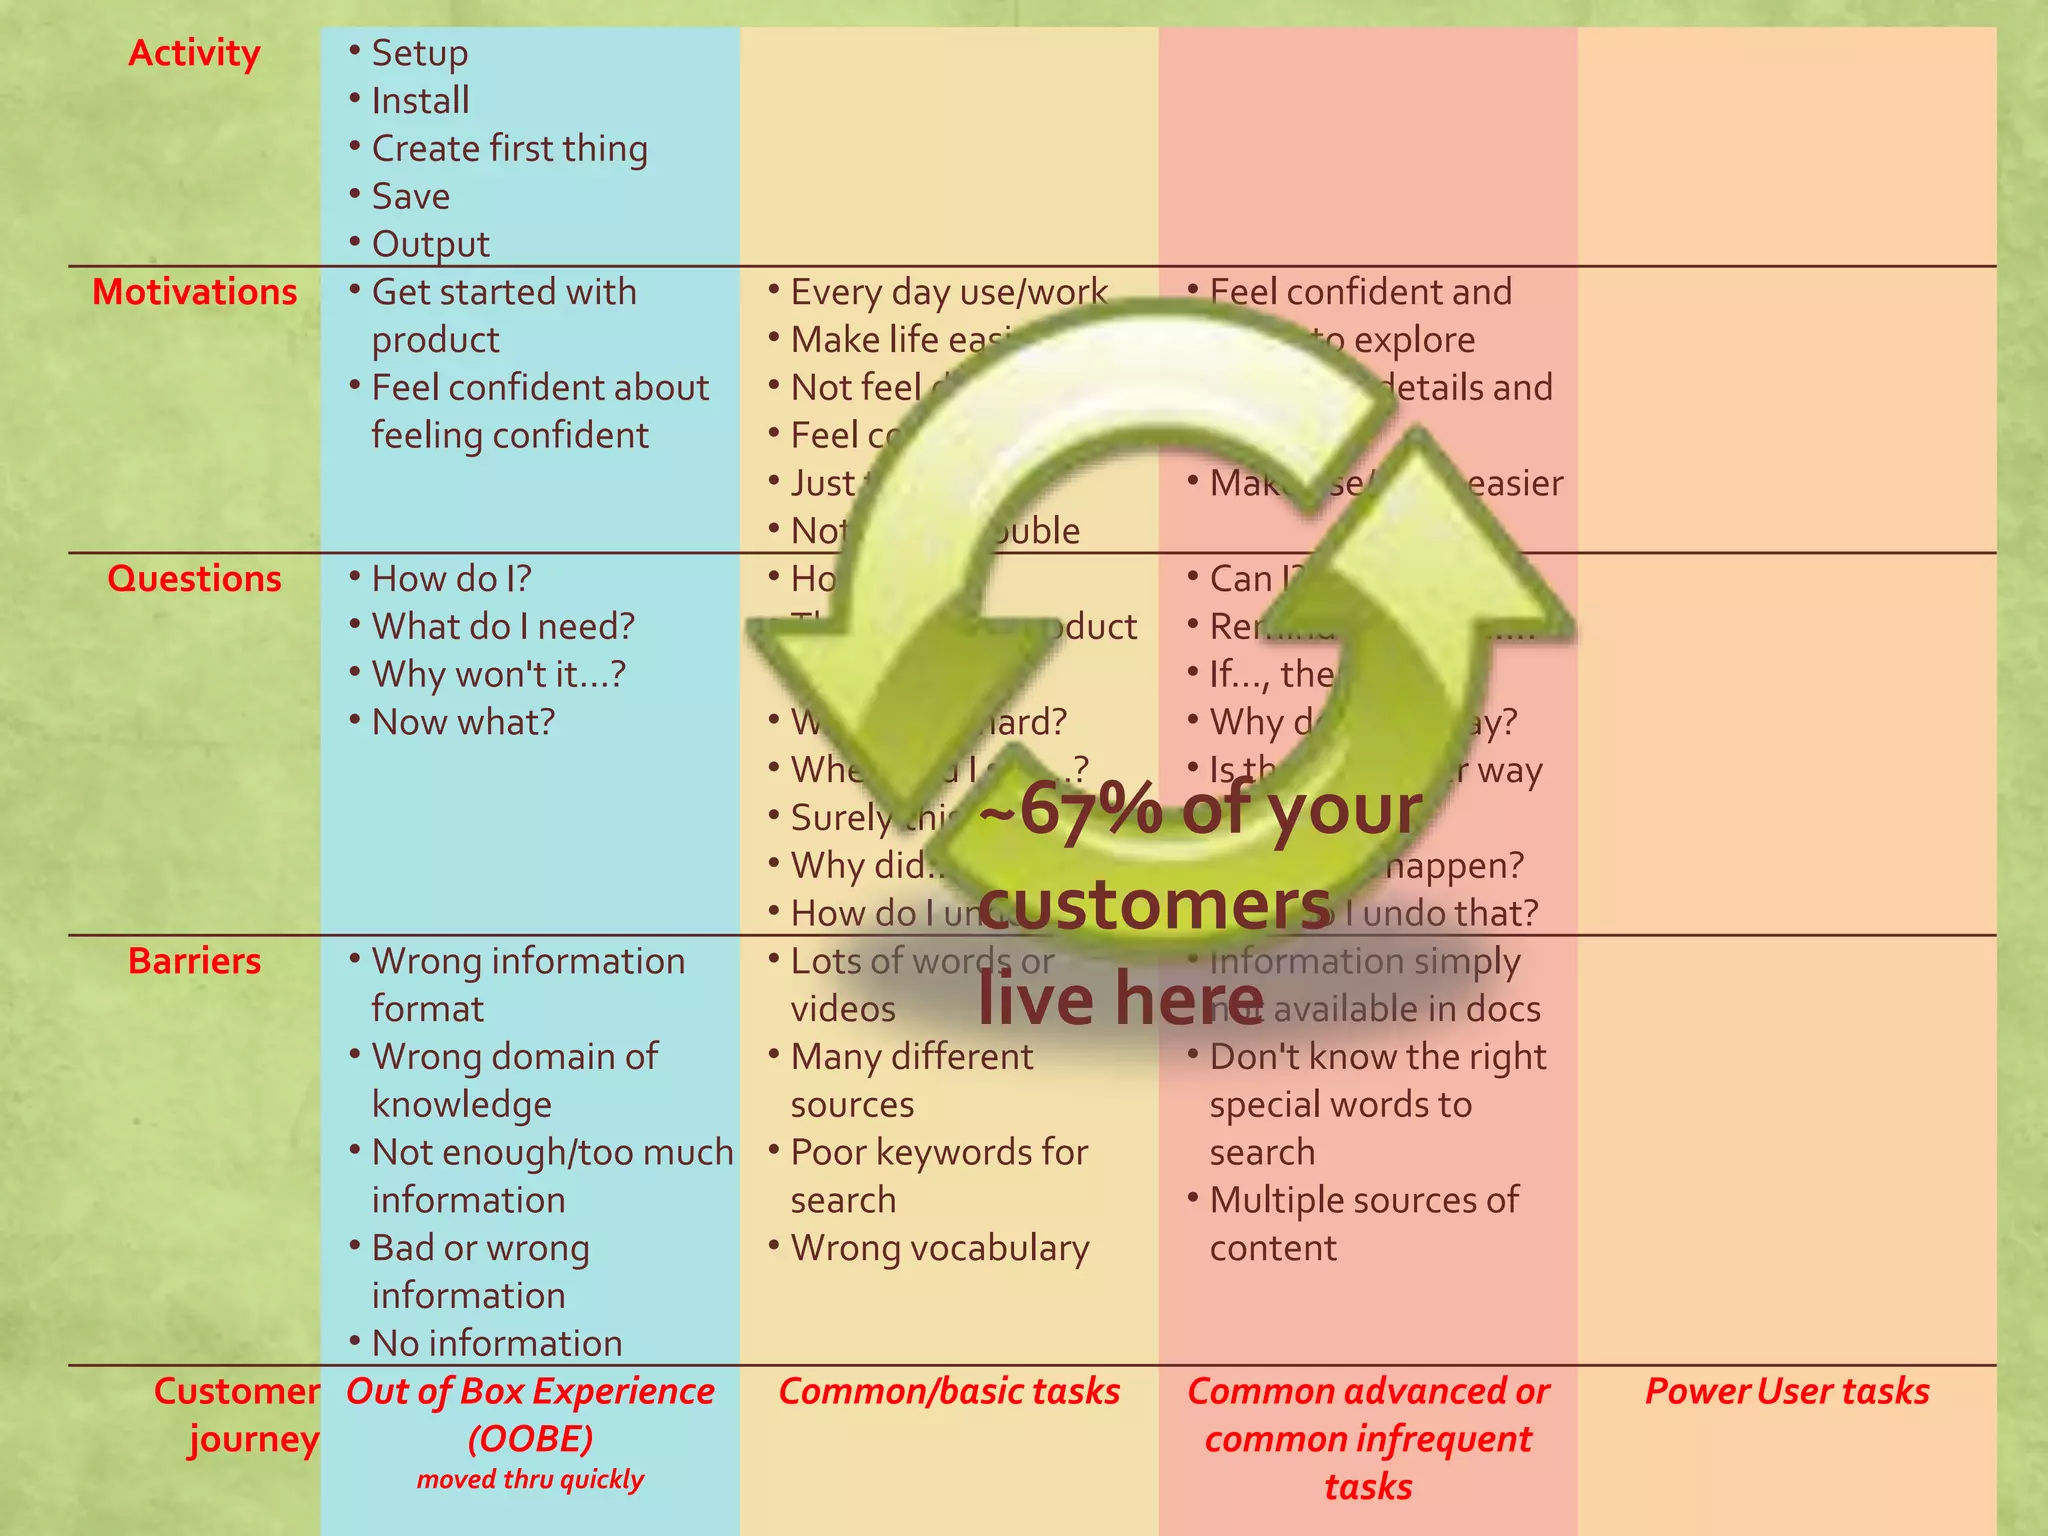
![Net Promoter Score (NPS)
“How likely is it
that you would
recommend
[company
name/product/
service] to a friend
or colleague?”
▪ Intended behavior metric
▪ Scale 0 to 10
▪ Associates loyalty to future
behavior
Group Score Feelings
Promoters 9 or 10 Loyal
Passives 7 or 8 Generally
satisfied
Detractors 0 to 6 Unhappy](https://image.slidesharecdn.com/thepoweroftechcomm-150304102205-conversion-gate01/75/The-Power-of-Technical-Communication-How-and-Where-We-Impact-the-Bottom-Line-41-2048.jpg)
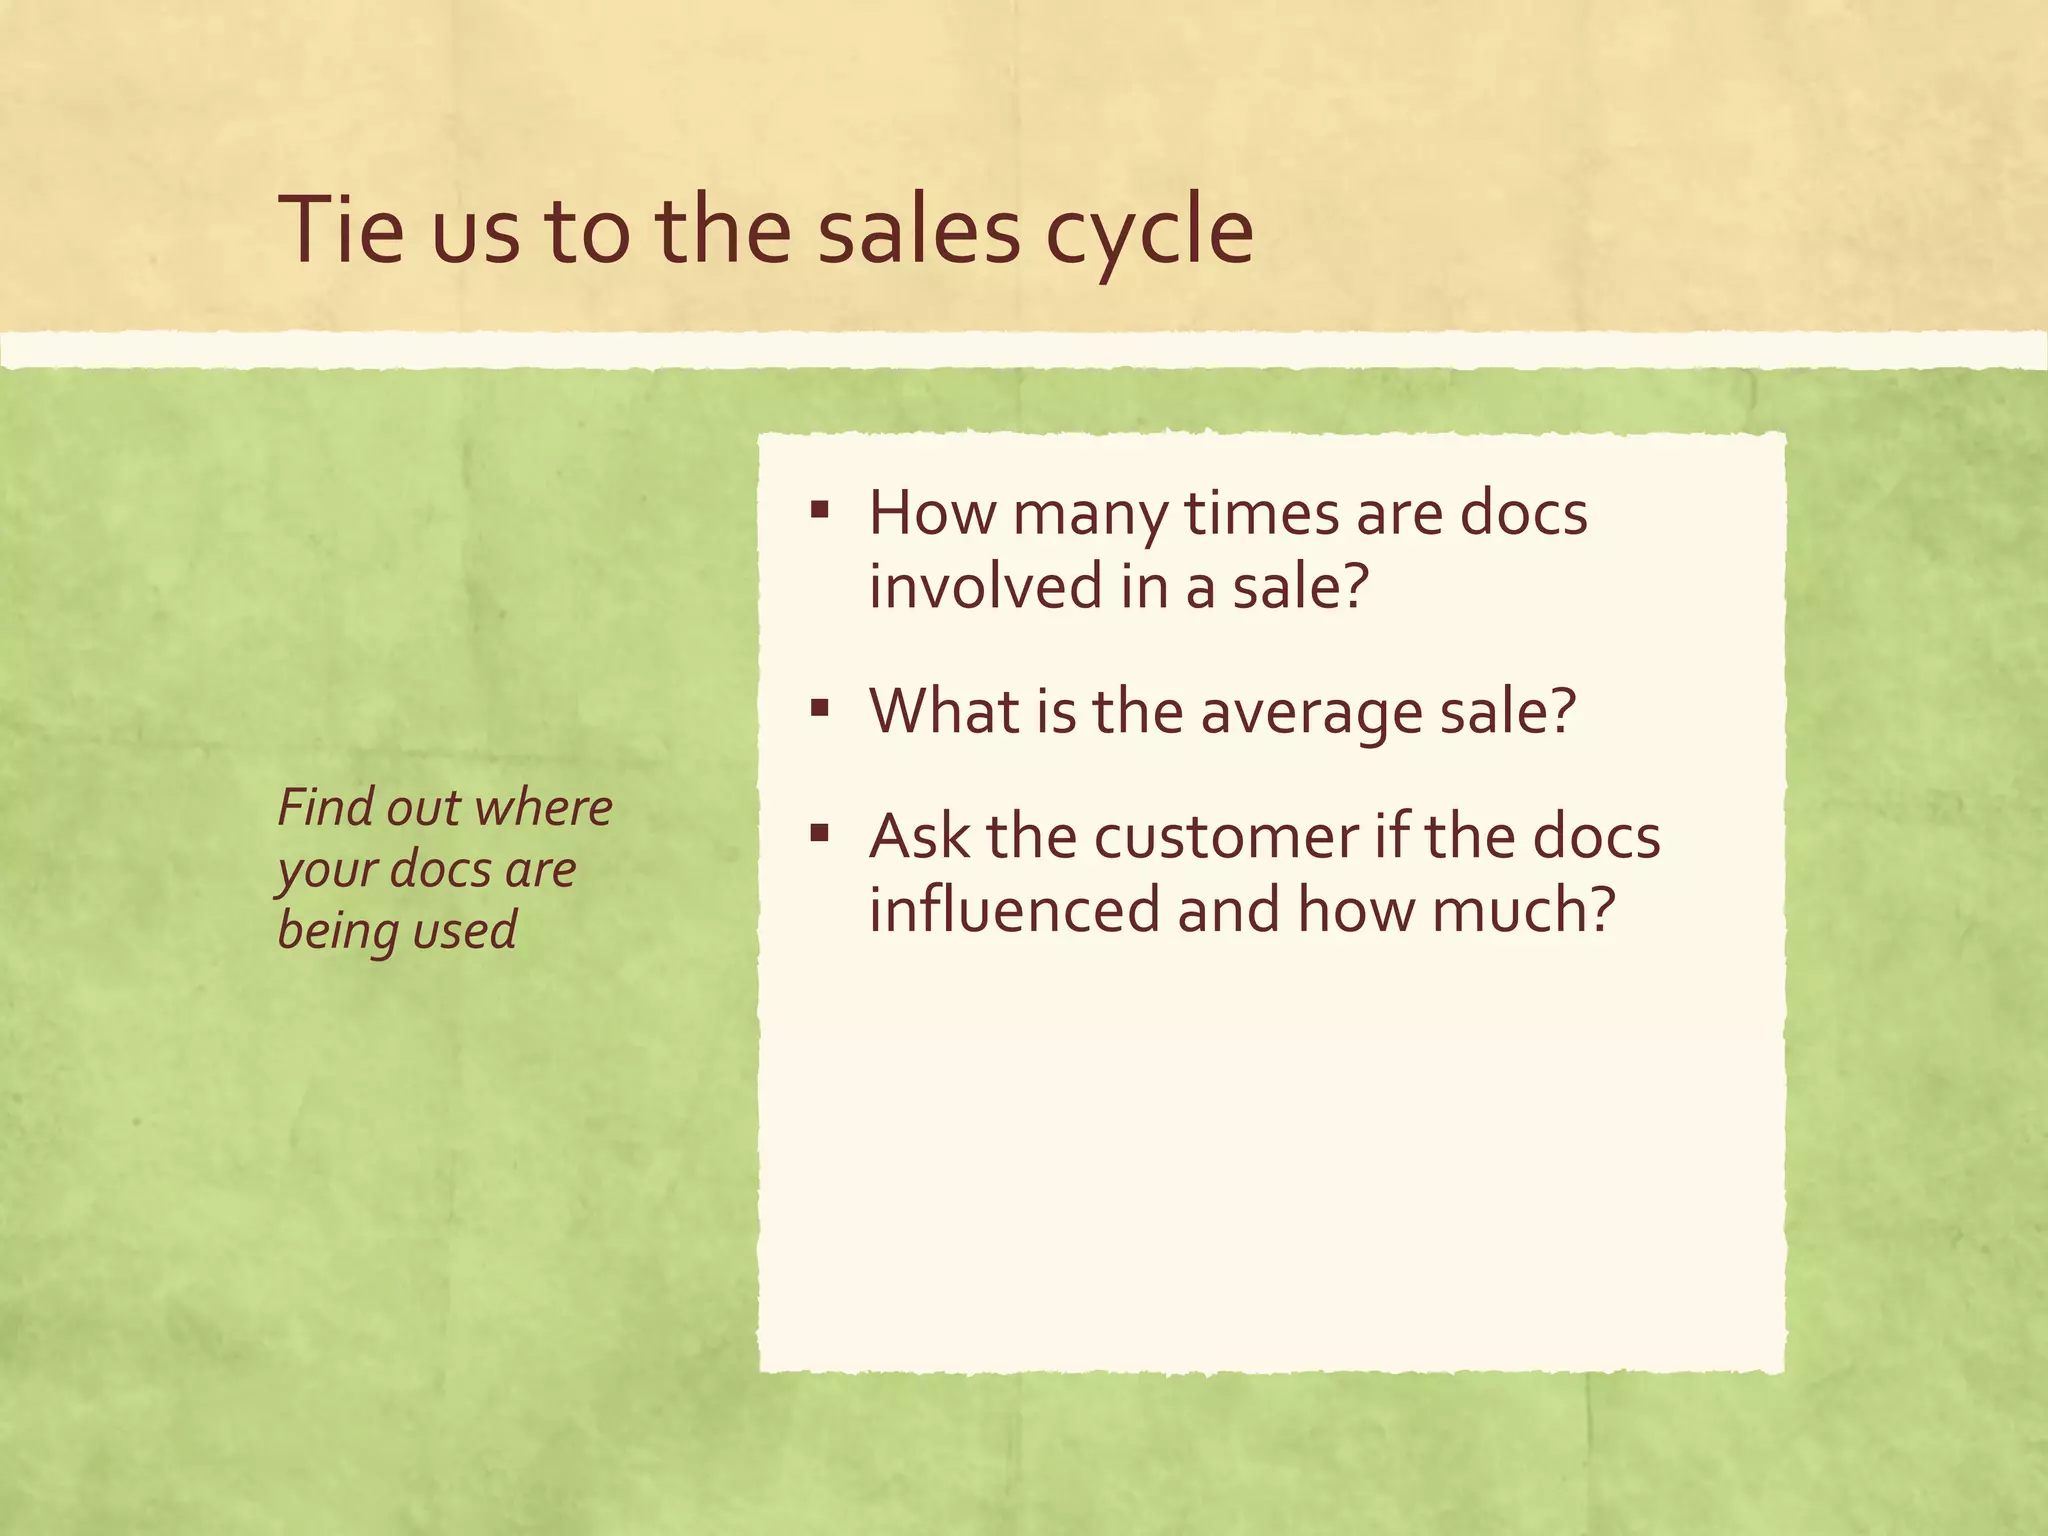
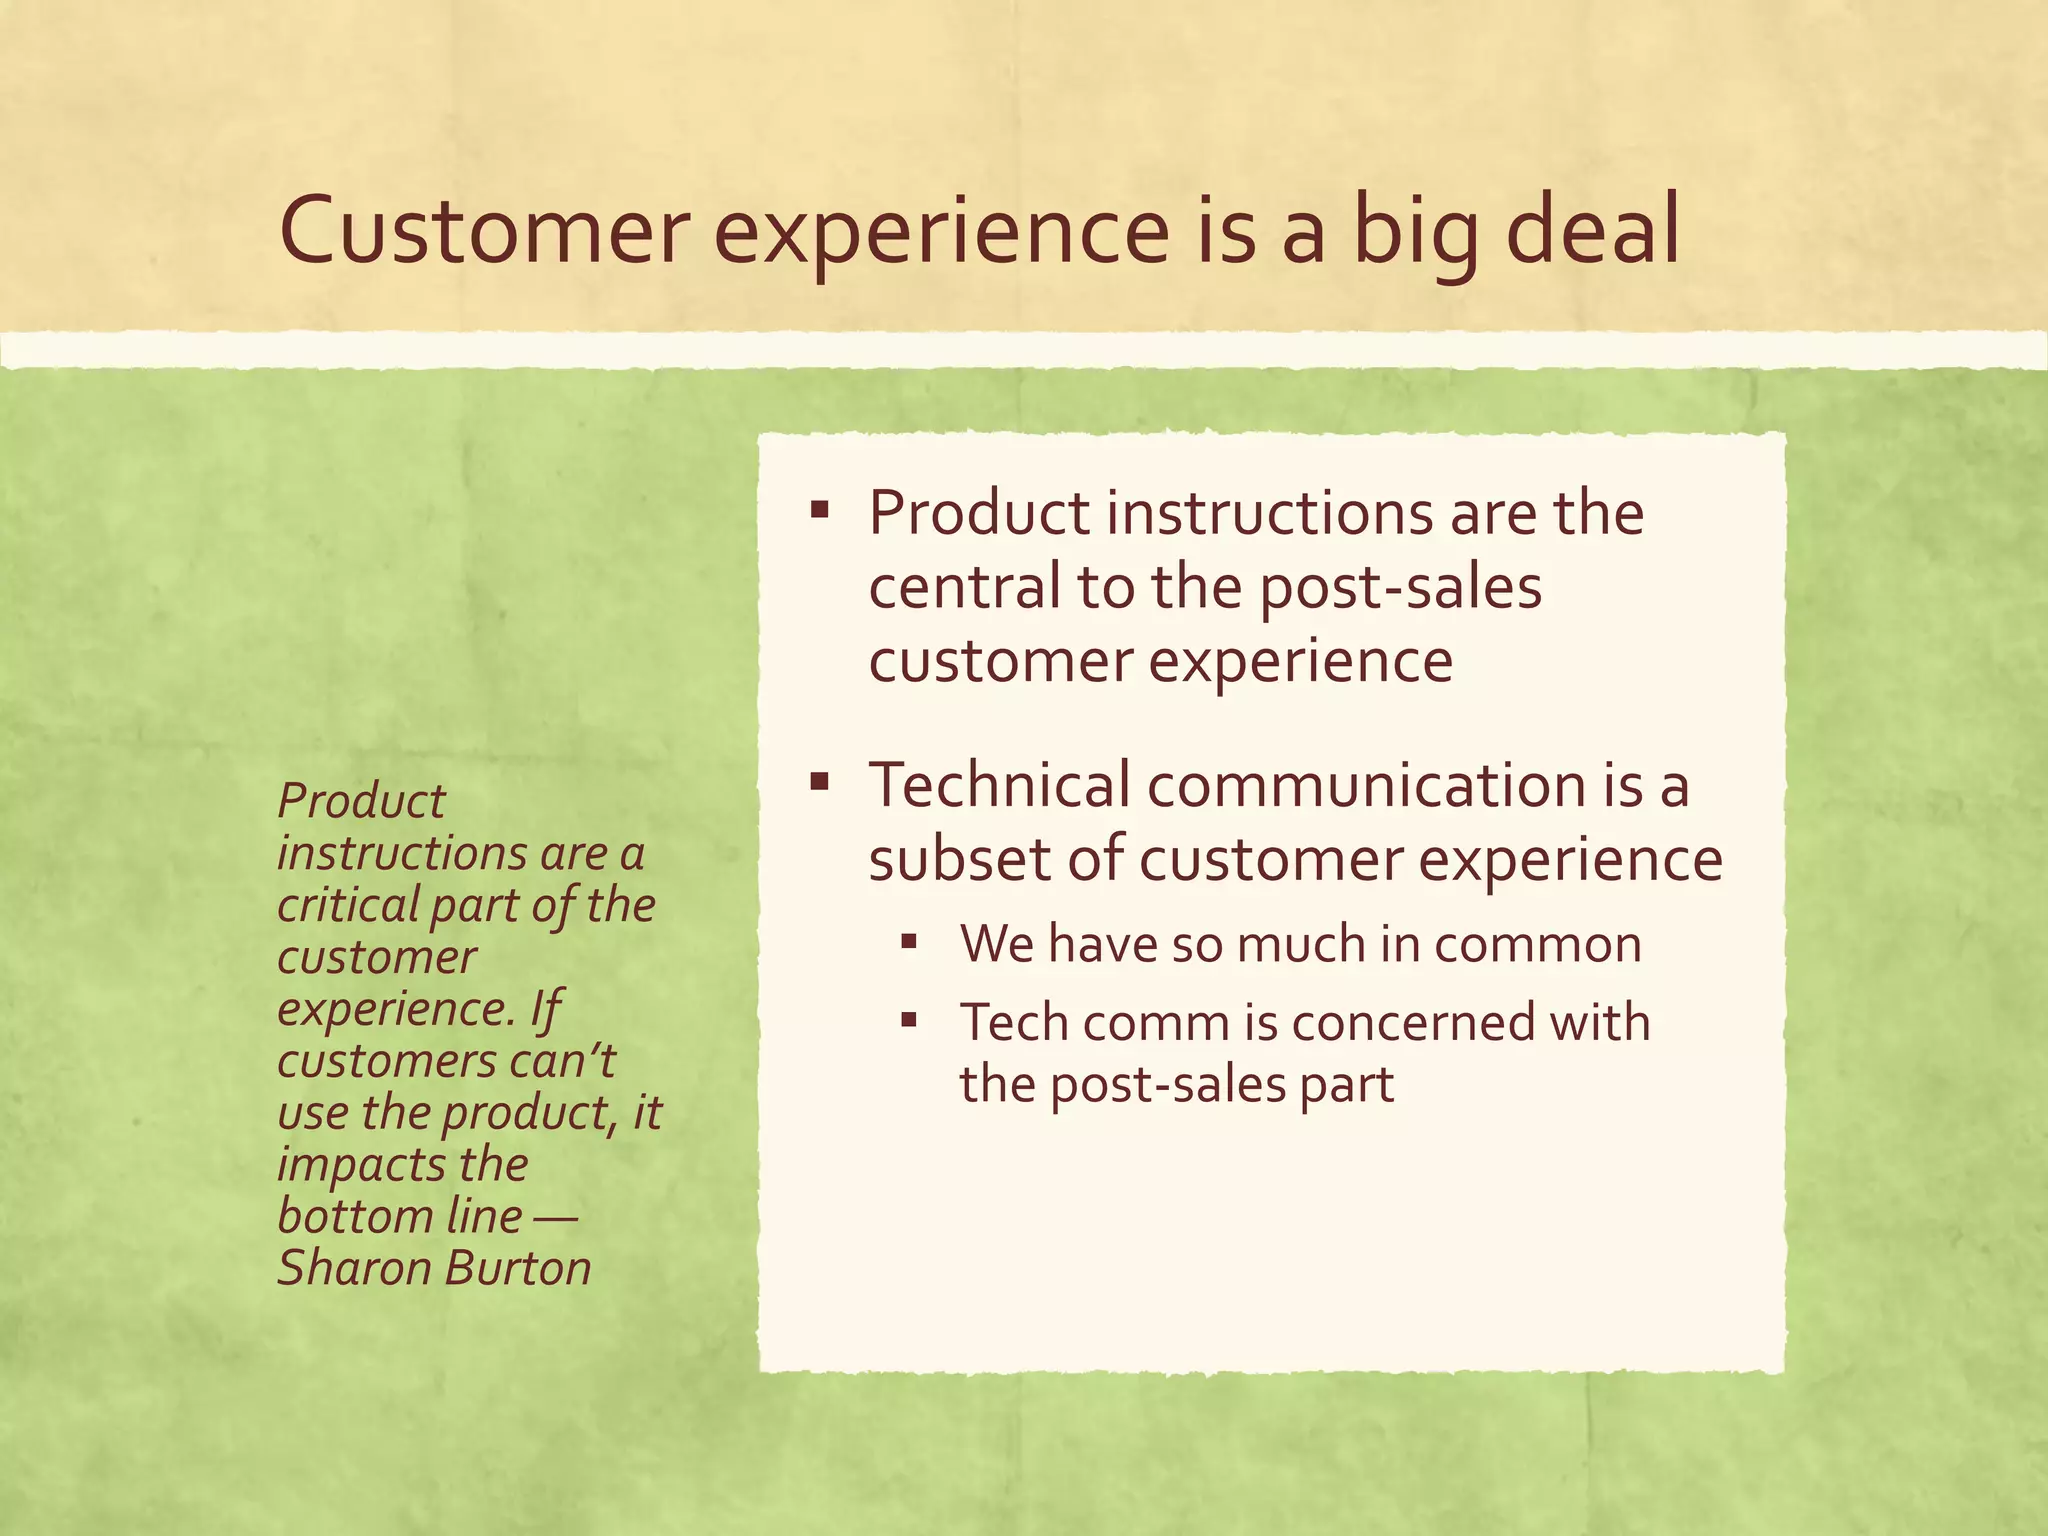
![Can we use this elsewhere?
“How likely is it
that you would
recommend our
instructions [or
content] to a
friend or
colleague?”
▪ Measure the intended
behavior for your content
▪ Use the same scale and
measurements as the rest of
the NPS
▪ If your content isn’t as high (or
is higher) as the rest of your
NPS
▪ That’s something to look at](https://image.slidesharecdn.com/thepoweroftechcomm-150304102205-conversion-gate01/75/The-Power-of-Technical-Communication-How-and-Where-We-Impact-the-Bottom-Line-43-2048.jpg)

This document discusses the impact of technical communication on customer experience and its significance in the sales process, emphasizing that clear product instructions can reduce customer churn and enhance product satisfaction. It highlights the importance of measuring customer interactions and experiences through various metrics like the Net Promoter Score (NPS) and Customer Effort Score (CES). Ultimately, it argues that effective documentation is essential for optimizing customer journeys and improving business outcomes.


![[Lean 101] Bootstrapping & Getting Out of the Building](https://cdn.slidesharecdn.com/ss_thumbnails/lean-101module200withbadge-151104125427-lva1-app6892-thumbnail.jpg?width=640&height=640&fit=bounds)


