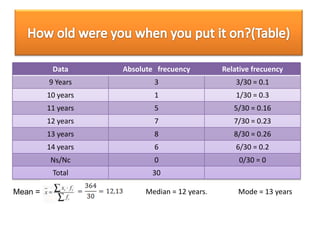
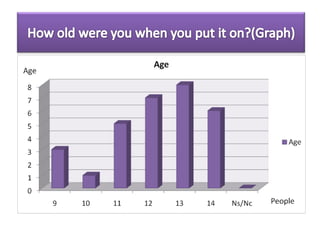
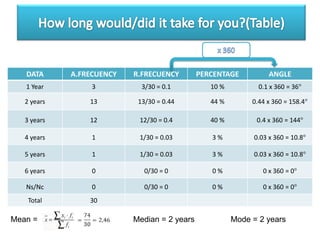
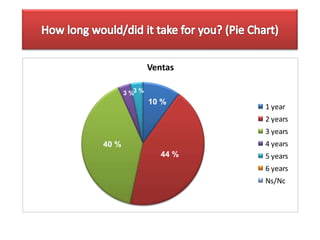
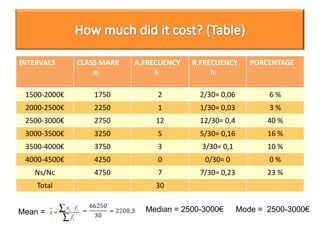
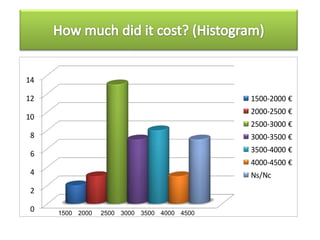
Stress levels increase during the Holidays, especially for Lesbians, Gays, Bisexuals, and Transgenders. Holiday stress place all individuals in addiction recovery at higher risk for relapsing. SoberHood participated in a web lecture presented by the Pride Institute that provided important coping techniques for the Holiday Season
Jon Eckard Photography appears to be a business focused on photography services. The name "Jon Eckard Photography" suggests that the business is owned and operated by an individual named Jon Eckard who specializes in photography. The brief document provides the name of the photography business but does not include any other details about the types of photography services offered or contact information.
Tri housing presentation (client and svc. providers)SoberHood
The Texas Recovery Initiative aims to ensure recovery support services through Recovery Oriented Systems of Care. These partnerships provide vital resources to support substance use disorder recovery. The initiative is developing ROSC programs across Texas to increase housing, employment, and social support opportunities for those in recovery. Providing stable housing and employment helps recovering individuals succeed while benefiting communities through economic activity and reduced crime.
The document discusses various forms of corruption that exist within the Indian railways related to staff matters. It outlines corruption that occurs during recruitment, postings and transfers, selections and promotions, processing of staff claims, medical issues, PF and pension processing, and disbursement of funds. Some measures that have been taken to address corruption include computerizing processes, implementing standardized timeframes, monitoring delays, and protecting whistleblowers. Further solutions proposed are increasing rotation of staff on sensitive posts, strengthening inspections, and leveraging technology to minimize manipulation.
Introduction to statistical concepts (population, sample, sampling, central tendency, spread). Mainly aimed at language teachers in advanced studies programmes (e.g., Masters courses)
Basic statistics is the science of collecting, organizing, summarizing, and interpreting data. It allows researchers to gain insights from data through graphical or numerical summaries, regardless of the amount of data. Descriptive statistics can be used to describe single variables through frequencies, percentages, means, and standard deviations. Inferential statistics make inferences about phenomena through hypothesis testing, correlations, and predicting relationships between variables.
This document provides examples of SPSS output with notes to aid in interpretation for basic statistical analyses. It includes summaries and explanations of SPSS output for frequency distributions, cross tabulations, t-tests, ANOVA, correlation, and regression. The analyses use data from the Family Exchanges Study to demonstrate how to interpret common statistical tests and summarize their results.
This document provides an overview of Matthew Pennell's upcoming presentation on using statistical models to understand macroevolutionary change. Pennell will discuss how models of trait evolution like Brownian motion, Ornstein-Uhlenbeck, and Early Burst can help explain long-term evolutionary processes. However, he notes that commonly used models are often inadequate and fail to capture variation in real datasets. Pennell advocates assessing model fit and using deviations to gain biological insights. He also stresses that macroevolutionary models may reflect dynamics of adaptive landscapes rather than microevolution within populations.
Measures of central tendency and dispersion mphpt-201844MtMt37
This document discusses measures of central tendency (mean, median, mode) and measures of dispersion (range, variance, standard deviation). It explains how to calculate and interpret these statistical measures. For a dataset of mothers' ages and heights, it instructs calculating the mean, median, mode, and standard deviation. It explains how these measures can indicate if a distribution is symmetric or skewed. The standard deviation describes how dispersed values are around the mean, with smaller standard deviations indicating values are closer together.
Is the Data Scaled, Ordinal, or Nominal Proportional?Ken Plummer
The document discusses different types of data used in statistical analysis: scaled, ordinal, and nominal data. Scaled data represents quantities where the intervals between values are equal, such as temperature or test scores. Ordinal data uses numbers to represent relative rankings, like placing in an event, but the intervals are not equal. The document uses examples to illustrate the properties of scaled and ordinal data and explains how to determine if a given data set is scaled or ordinal.
The document discusses preventing anemia through proper nutrition. It presents the case of Erika, a student who has heard on the radio about the importance of preventing anemia but does not know why. Her family has recently changed their diet to include foods like liver, chicken blood, and spleen. The document asks how families and communities can prevent anemia and what foods can be consumed to fight it. It provides context on measuring central tendency values like mean, median and mode to express representative values of foods that help combat anemia.
El documento presenta los resultados de una encuesta sobre las calificaciones (del 1 al 10) que la gente daría a los aviones como medio de transporte actual. Se encuestó a entre 50 y 70 personas durante 3 días en diferentes zonas de la ciudad. Los datos recolectados muestran que la mayoría calificó a los aviones entre 5 y 8, con una moda de 6 y una mediana de 7. El resumen incluye tablas y cálculos estadísticos como la media aritmética y desviación típica.
Este documento presenta los resultados de dos encuestas realizadas. La primera encuesta pregunta qué haría una persona si quedara embarazada no deseada, mostrando los resultados en una tabla y gráfico de sectores. La segunda encuesta pregunta cómo pasaría una persona sus últimas 24 horas de vida, también presentando los resultados en una tabla y gráfico de sectores. El documento introduce brevemente conceptos básicos de estadística.
Este documento resume los resultados de una encuesta realizada a estudiantes de otro instituto sobre sus notas en matemáticas. Presenta los datos obtenidos, una tabla de frecuencias, un diagrama de barras, y cálculos de la varianza, desviación típica, moda y media de las notas.
Este documento presenta los resultados de una encuesta sobre el tamaño del calzado en chicos y chicas de 15 años. Muestra la distribución de frecuencias de los tamaños de calzado entre 37 y 45, con una media de 40 y una moda y mediana de 38. Calcula la varianza en 4.42 y la desviación típica en 2.4.
El documento presenta los resultados de una encuesta realizada a 40 alumnos de 3o de ESO sobre el número de materias suspensas en el primer y segundo trimestre. Se muestran tablas de frecuencias y gráficos que comparan los resultados entre trimestres. Se calculan las medidas de tendencia central como la media y la mediana para cada trimestre.
El resumen analiza los hábitos de gasto de 14 adolescentes de entre 14 y 19 años. La encuesta encontró que los adolescentes reciben una paga promedio de €22,14 y gastan €14,71 por semana en actividades como copas y compras. La mayoría recibe €10 de paga y gasta entre €10-14 semanalmente.
El documento presenta los resultados de una encuesta realizada a los alumnos de 3oB de ESO sobre su uso de redes sociales. La encuesta contenía preguntas sobre si usan redes sociales y cuántas horas a la semana. Los resultados mostraron que la mayoría usa redes sociales entre 4 y 7 horas a la semana. El análisis estadístico incluyó el cálculo de la media, mediana, moda, varianza y desviación típica.
La encuesta realizada a estudiantes de 4o de ESO encontró que el bachillerato científico-tecnológico era la opción más popular, con el 28% de los estudiantes eligiéndolo. El segundo bachillerato más elegido fue ciencias de la salud, con el 26% eligiéndolo. El objetivo de la encuesta era aprender sobre las opciones de bachillerato que los estudiantes consideran para el próximo año y las matemáticas aplicadas a situaciones de la vida real.
Este documento presenta los resultados de una encuesta sobre mascotas realizada a estudiantes y profesores de un instituto. Los principales hallazgos son: la mayoría de las personas tienen una mascota, el perro es el tipo de mascota más común y la mayoría de las mascotas tienen entre 0 y 2 años.
El documento resume los resultados de una encuesta realizada a 42 estudiantes de 3er año de la ESO sobre sus expectativas de futuro. La mayoría de los estudiantes se decantan por cursar un bachillerato de Ciencias y Tecnologías, aunque algunos aún no se han decidido. El documento incluye fórmulas estadísticas, gráficos y tablas con los datos de la encuesta.
Este documento presenta los resultados de una encuesta realizada a 30 personas sobre sus planes de vacaciones de verano. La mayoría de las personas planean viajar en julio a destinos de playa en Europa usando su automóvil y alojándose en hoteles por un período de 10 a 15 días.
El documento proporciona información sobre el cálculo del área lateral, área total y volumen de diferentes figuras geométricas como cubos, paralelepípedos, esferas y conos. También incluye ejemplos de problemas resueltos sobre el cálculo del volumen y área de un queso y un bombón.
La actividad consistió en una presentación sobre la influencia de la geometría en la vida cotidiana como la pintura, la escultura y la arquitectura, seguida de cuatro talleres interactivos sobre juegos matemáticos, mosaicos, las matemáticas en Los Simpson y logotipos publicitarios. Los alumnos de 1o de ESO participaron en la actividad en el Laboral Centre de Arte y Creación Industrial.
Presentación PowerPoint que resume la participación de los alumnos y alumnas del Ies El Piles en la XVIII Olimpiada Matemática Asturiana el 5 de Abril de 2011
El documento describe una visita de estudiantes de primer año de secundaria al Puerto del Musel y al Centro de Experimentación Pesquera en Gijón, España. Los estudiantes vieron maquetas del puerto actual y el nuevo puerto ampliado, y recibieron explicaciones sobre la historia y desarrollo del puerto. También visitaron las instalaciones del puerto actual y el Centro de Experimentación Pesquera, aprendiendo sobre sus operaciones.
El documento describe una visita de estudiantes de primer año de secundaria al Puerto del Musel y al Centro de Experimentación Pesquera en Gijón, España. Los estudiantes observan una maqueta detallada del nuevo puerto y sus ampliaciones planeadas, y aprenden sobre la historia del puerto desde la época de Jovellanos. También visitan las instalaciones del puerto actual y el Centro de Experimentación Pesquera, donde reciben regalos conmemorativos y recursos adicionales para continuar aprendiendo.
Este documento presenta los resultados de varios cálculos matemáticos sobre los efectos del consumo de tabaco. Calcula la longitud de cigarrillos fumados en un año (438 metros), el volumen de tabaco consumido (22 litros), la cantidad de alquitrán ingerida (102,2 gramos) y los años necesarios para "barnizar" el suelo con el alquitrán consumido (10 años para 15 metros cuadrados). Los cálculos tienen como objetivo ilustrar los efectos del consumo diario de tabaco a través de la aplicación de
El documento presenta datos sobre la edad a la que los fumadores empezaron a fumar. Muestra que el 72% de los encuestados son fumadores, mientras que el 16% no fuman y el 8% prefirió no contestar. La moda de la edad a la que empezaron a fumar es de 15-16 años. Calcula también la media, mediana y cuartiles de las edades.
Programming Foundation Models with DSPy - Meetup SlidesZilliz
Prompting language models is hard, while programming language models is easy. In this talk, I will discuss the state-of-the-art framework DSPy for programming foundation models with its powerful optimizers and runtime constraint system.
GraphSummit Singapore | The Art of the Possible with Graph - Q2 2024Neo4j
Neha Bajwa, Vice President of Product Marketing, Neo4j
Join us as we explore breakthrough innovations enabled by interconnected data and AI. Discover firsthand how organizations use relationships in data to uncover contextual insights and solve our most pressing challenges – from optimizing supply chains, detecting fraud, and improving customer experiences to accelerating drug discoveries.
Dr. Sean Tan, Head of Data Science, Changi Airport Group
Discover how Changi Airport Group (CAG) leverages graph technologies and generative AI to revolutionize their search capabilities. This session delves into the unique search needs of CAG’s diverse passengers and customers, showcasing how graph data structures enhance the accuracy and relevance of AI-generated search results, mitigating the risk of “hallucinations” and improving the overall customer journey.
Why You Should Replace Windows 11 with Nitrux Linux 3.5.0 for enhanced perfor...SOFTTECHHUB
The choice of an operating system plays a pivotal role in shaping our computing experience. For decades, Microsoft's Windows has dominated the market, offering a familiar and widely adopted platform for personal and professional use. However, as technological advancements continue to push the boundaries of innovation, alternative operating systems have emerged, challenging the status quo and offering users a fresh perspective on computing.
One such alternative that has garnered significant attention and acclaim is Nitrux Linux 3.5.0, a sleek, powerful, and user-friendly Linux distribution that promises to redefine the way we interact with our devices. With its focus on performance, security, and customization, Nitrux Linux presents a compelling case for those seeking to break free from the constraints of proprietary software and embrace the freedom and flexibility of open-source computing.
Essentials of Automations: The Art of Triggers and Actions in FMESafe Software
In this second installment of our Essentials of Automations webinar series, we’ll explore the landscape of triggers and actions, guiding you through the nuances of authoring and adapting workspaces for seamless automations. Gain an understanding of the full spectrum of triggers and actions available in FME, empowering you to enhance your workspaces for efficient automation.
We’ll kick things off by showcasing the most commonly used event-based triggers, introducing you to various automation workflows like manual triggers, schedules, directory watchers, and more. Plus, see how these elements play out in real scenarios.
Whether you’re tweaking your current setup or building from the ground up, this session will arm you with the tools and insights needed to transform your FME usage into a powerhouse of productivity. Join us to discover effective strategies that simplify complex processes, enhancing your productivity and transforming your data management practices with FME. Let’s turn complexity into clarity and make your workspaces work wonders!
Goodbye Windows 11: Make Way for Nitrux Linux 3.5.0!SOFTTECHHUB
As the digital landscape continually evolves, operating systems play a critical role in shaping user experiences and productivity. The launch of Nitrux Linux 3.5.0 marks a significant milestone, offering a robust alternative to traditional systems such as Windows 11. This article delves into the essence of Nitrux Linux 3.5.0, exploring its unique features, advantages, and how it stands as a compelling choice for both casual users and tech enthusiasts.
Best 20 SEO Techniques To Improve Website Visibility In SERPPixlogix Infotech
Boost your website's visibility with proven SEO techniques! Our latest blog dives into essential strategies to enhance your online presence, increase traffic, and rank higher on search engines. From keyword optimization to quality content creation, learn how to make your site stand out in the crowded digital landscape. Discover actionable tips and expert insights to elevate your SEO game.
In his public lecture, Christian Timmerer provides insights into the fascinating history of video streaming, starting from its humble beginnings before YouTube to the groundbreaking technologies that now dominate platforms like Netflix and ORF ON. Timmerer also presents provocative contributions of his own that have significantly influenced the industry. He concludes by looking at future challenges and invites the audience to join in a discussion.
Observability Concepts EVERY Developer Should Know -- DeveloperWeek Europe.pdfPaige Cruz
Monitoring and observability aren’t traditionally found in software curriculums and many of us cobble this knowledge together from whatever vendor or ecosystem we were first introduced to and whatever is a part of your current company’s observability stack.
While the dev and ops silo continues to crumble….many organizations still relegate monitoring & observability as the purview of ops, infra and SRE teams. This is a mistake - achieving a highly observable system requires collaboration up and down the stack.
I, a former op, would like to extend an invitation to all application developers to join the observability party will share these foundational concepts to build on:
Sudheer Mechineni, Head of Application Frameworks, Standard Chartered Bank
Discover how Standard Chartered Bank harnessed the power of Neo4j to transform complex data access challenges into a dynamic, scalable graph database solution. This keynote will cover their journey from initial adoption to deploying a fully automated, enterprise-grade causal cluster, highlighting key strategies for modelling organisational changes and ensuring robust disaster recovery. Learn how these innovations have not only enhanced Standard Chartered Bank’s data infrastructure but also positioned them as pioneers in the banking sector’s adoption of graph technology.
Removing Uninteresting Bytes in Software FuzzingAftab Hussain
Imagine a world where software fuzzing, the process of mutating bytes in test seeds to uncover hidden and erroneous program behaviors, becomes faster and more effective. A lot depends on the initial seeds, which can significantly dictate the trajectory of a fuzzing campaign, particularly in terms of how long it takes to uncover interesting behaviour in your code. We introduce DIAR, a technique designed to speedup fuzzing campaigns by pinpointing and eliminating those uninteresting bytes in the seeds. Picture this: instead of wasting valuable resources on meaningless mutations in large, bloated seeds, DIAR removes the unnecessary bytes, streamlining the entire process.
In this work, we equipped AFL, a popular fuzzer, with DIAR and examined two critical Linux libraries -- Libxml's xmllint, a tool for parsing xml documents, and Binutil's readelf, an essential debugging and security analysis command-line tool used to display detailed information about ELF (Executable and Linkable Format). Our preliminary results show that AFL+DIAR does not only discover new paths more quickly but also achieves higher coverage overall. This work thus showcases how starting with lean and optimized seeds can lead to faster, more comprehensive fuzzing campaigns -- and DIAR helps you find such seeds.
- These are slides of the talk given at IEEE International Conference on Software Testing Verification and Validation Workshop, ICSTW 2022.
HCL Notes und Domino Lizenzkostenreduzierung in der Welt von DLAUpanagenda
Webinar Recording: https://www.panagenda.com/webinars/hcl-notes-und-domino-lizenzkostenreduzierung-in-der-welt-von-dlau/
DLAU und die Lizenzen nach dem CCB- und CCX-Modell sind für viele in der HCL-Community seit letztem Jahr ein heißes Thema. Als Notes- oder Domino-Kunde haben Sie vielleicht mit unerwartet hohen Benutzerzahlen und Lizenzgebühren zu kämpfen. Sie fragen sich vielleicht, wie diese neue Art der Lizenzierung funktioniert und welchen Nutzen sie Ihnen bringt. Vor allem wollen Sie sicherlich Ihr Budget einhalten und Kosten sparen, wo immer möglich. Das verstehen wir und wir möchten Ihnen dabei helfen!
Wir erklären Ihnen, wie Sie häufige Konfigurationsprobleme lösen können, die dazu führen können, dass mehr Benutzer gezählt werden als nötig, und wie Sie überflüssige oder ungenutzte Konten identifizieren und entfernen können, um Geld zu sparen. Es gibt auch einige Ansätze, die zu unnötigen Ausgaben führen können, z. B. wenn ein Personendokument anstelle eines Mail-Ins für geteilte Mailboxen verwendet wird. Wir zeigen Ihnen solche Fälle und deren Lösungen. Und natürlich erklären wir Ihnen das neue Lizenzmodell.
Nehmen Sie an diesem Webinar teil, bei dem HCL-Ambassador Marc Thomas und Gastredner Franz Walder Ihnen diese neue Welt näherbringen. Es vermittelt Ihnen die Tools und das Know-how, um den Überblick zu bewahren. Sie werden in der Lage sein, Ihre Kosten durch eine optimierte Domino-Konfiguration zu reduzieren und auch in Zukunft gering zu halten.
Diese Themen werden behandelt
- Reduzierung der Lizenzkosten durch Auffinden und Beheben von Fehlkonfigurationen und überflüssigen Konten
- Wie funktionieren CCB- und CCX-Lizenzen wirklich?
- Verstehen des DLAU-Tools und wie man es am besten nutzt
- Tipps für häufige Problembereiche, wie z. B. Team-Postfächer, Funktions-/Testbenutzer usw.
- Praxisbeispiele und Best Practices zum sofortigen Umsetzen
Cosa hanno in comune un mattoncino Lego e la backdoor XZ?Speck&Tech
ABSTRACT: A prima vista, un mattoncino Lego e la backdoor XZ potrebbero avere in comune il fatto di essere entrambi blocchi di costruzione, o dipendenze di progetti creativi e software. La realtà è che un mattoncino Lego e il caso della backdoor XZ hanno molto di più di tutto ciò in comune.
Partecipate alla presentazione per immergervi in una storia di interoperabilità, standard e formati aperti, per poi discutere del ruolo importante che i contributori hanno in una comunità open source sostenibile.
BIO: Sostenitrice del software libero e dei formati standard e aperti. È stata un membro attivo dei progetti Fedora e openSUSE e ha co-fondato l'Associazione LibreItalia dove è stata coinvolta in diversi eventi, migrazioni e formazione relativi a LibreOffice. In precedenza ha lavorato a migrazioni e corsi di formazione su LibreOffice per diverse amministrazioni pubbliche e privati. Da gennaio 2020 lavora in SUSE come Software Release Engineer per Uyuni e SUSE Manager e quando non segue la sua passione per i computer e per Geeko coltiva la sua curiosità per l'astronomia (da cui deriva il suo nickname deneb_alpha).