Tech merger&acquistion data 2008 2011
•
0 likes•660 views

M&A Data for Technology Companies 2008-2009...
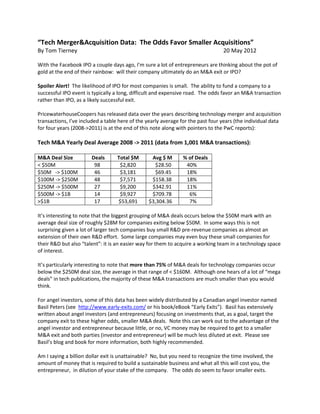
![Tech M&A Deals 2011
M&A Deal Size Deals Total $M Avg $ M % of Deals
< $50M 107 $3,042 $28.43 35%
$50M -> $100M 50 $3,548 $70.96 16%
$100M -> $250M 61 $9,665 $158.44 20%
$250M -> $500M 41 $13,953 $340.32 13%
$500M -> $1B 24 $16,310 $679.58 8%
>$1B 25 $78,594 $3,143.76 8%
Tech M&A Deals 2010
M&A Deal Size Deals Total $M Avg $ M % of Deals
< $50M 154 $4,373 $28.40 39%
$50M -> $100M 75 $5,166 $68.88 19%
$100M -> $250M 83 $12,761 $153.75 21%
$250M -> $500M 36 $12,707 $352.97 9%
$500M -> $1B 19 $13,263 $698.05 5%
>$1B 23 $58,840 $2,558.26 6%
Tech M&A Deals 2009
M&A Deal Size Deals Total $M Avg $ M % of Deals
< $50M 48 $1,206 $25.13 44%
$50M -> $100M 18 $1,234 $68.56 17%
$100M -> $250M 15 $2,421 $161.40 14%
$250M -> $500M 10 $3,427 $342.70 9%
$500M -> $1B 6 $4,134 $689.00 6%
>$1B 11 $23,912 $2,173.82 10%
Tech M&A Deals 2008
M&A Deal Size Deals Total $M Avg $ M % of Deals
< $50M 83 $2,659 $32.04 43%
$50M -> $100M 40 $2,776 $69.40 21%
$100M -> $250M 34 $5,438 $159.94 17%
$250M -> $500M 20 $6,713 $335.65 10%
$500M -> $1B 8 $6,180 $772.50 4%
>$1B 10 $53,416 $5,341.60 5%
PricewaterhouseCoopers 2008/2009 [1] and 2010/2011 [2] data:
[1] http://www.pwc.com/us/en/transaction-services/publications/assets/PwC-US-technology-MA-insights-2010.pdf
[2] http://www.pwc.com/en_US/us/transaction-services/publications/assets/pwc-technology-mergers-acquisitions-q4-2011-outlook.pdf
Tom Tierney lives in Encinitas, CA and is a member of Tech Coast Angels (www.techcoastangels.com).
Also see http://en.wikipedia.org/wiki/Tech_coast_angels for more background information on the TCA.](data:image/gif;base64,R0lGODlhAQABAIAAAAAAAP///yH5BAEAAAAALAAAAAABAAEAAAIBRAA7)
Recommended
More Related Content
More from Tom Tierney
More from Tom Tierney (20)
Recently uploaded
Recently uploaded (20)
Tech merger&acquistion data 2008 2011
- 1. “Tech Merger&Acquisition Data: The Odds Favor Smaller Acquisitions” By Tom Tierney 20 May 2012 With the Facebook IPO a couple days ago, I’m sure a lot of entrepreneurs are thinking about the pot of gold at the end of their rainbow: will their company ultimately do an M&A exit or IPO? Spoiler Alert! The likelihood of IPO for most companies is small. The ability to fund a company to a successful IPO event is typically a long, difficult and expensive road. The odds favor an M&A transaction rather than IPO, as a likely successful exit. PricewaterhouseCoopers has released data over the years describing technology merger and acquisition transactions, I’ve included a table here of the yearly average for the past four years (the individual data for four years (2008->2011) is at the end of this note along with pointers to the PwC reports): Tech M&A Yearly Deal Average 2008 -> 2011 (data from 1,001 M&A transactions): M&A Deal Size Deals Total $M Avg $ M % of Deals < $50M 98 $2,820 $28.50 40% $50M -> $100M 46 $3,181 $69.45 18% $100M -> $250M 48 $7,571 $158.38 18% $250M -> $500M 27 $9,200 $342.91 11% $500M -> $1B 14 $9,927 $709.78 6% >$1B 17 $53,691 $3,304.36 7% It’s interesting to note that the biggest grouping of M&A deals occurs below the $50M mark with an average deal size of roughly $28M for companies exiting below $50M. In some ways this is not surprising given a lot of larger tech companies buy small R&D pre-revenue companies as almost an extension of their own R&D effort. Some large companies may even buy these small companies for their R&D but also “talent”: it is an easier way for them to acquire a working team in a technology space of interest. It’s particularly interesting to note that more than 75% of M&A deals for technology companies occur below the $250M deal size, the average in that range of < $160M. Although one hears of a lot of “mega deals” in tech publications, the majority of these M&A transactions are much smaller than you would think. For angel investors, some of this data has been widely distributed by a Canadian angel investor named Basil Peters (see http://www.early-exits.com/ or his book/eBook “Early Exits”). Basil has extensively written about angel investors (and entrepreneurs) focusing on investments that, as a goal, target the company exit to these higher odds, smaller M&A deals. Note this can work out to the advantage of the angel investor and entrepreneur because little, or no, VC money may be required to get to a smaller M&A exit and both parties (investor and entrepreneur) will be much less diluted at exit. Please see Basil’s blog and book for more information, both highly recommended. Am I saying a billion dollar exit is unattainable? No, but you need to recognize the time involved, the amount of money that is required to build a sustainable business and what all this will cost you, the entrepreneur, in dilution of your stake of the company. The odds do seem to favor smaller exits.
- 2. Tech M&A Deals 2011 M&A Deal Size Deals Total $M Avg $ M % of Deals < $50M 107 $3,042 $28.43 35% $50M -> $100M 50 $3,548 $70.96 16% $100M -> $250M 61 $9,665 $158.44 20% $250M -> $500M 41 $13,953 $340.32 13% $500M -> $1B 24 $16,310 $679.58 8% >$1B 25 $78,594 $3,143.76 8% Tech M&A Deals 2010 M&A Deal Size Deals Total $M Avg $ M % of Deals < $50M 154 $4,373 $28.40 39% $50M -> $100M 75 $5,166 $68.88 19% $100M -> $250M 83 $12,761 $153.75 21% $250M -> $500M 36 $12,707 $352.97 9% $500M -> $1B 19 $13,263 $698.05 5% >$1B 23 $58,840 $2,558.26 6% Tech M&A Deals 2009 M&A Deal Size Deals Total $M Avg $ M % of Deals < $50M 48 $1,206 $25.13 44% $50M -> $100M 18 $1,234 $68.56 17% $100M -> $250M 15 $2,421 $161.40 14% $250M -> $500M 10 $3,427 $342.70 9% $500M -> $1B 6 $4,134 $689.00 6% >$1B 11 $23,912 $2,173.82 10% Tech M&A Deals 2008 M&A Deal Size Deals Total $M Avg $ M % of Deals < $50M 83 $2,659 $32.04 43% $50M -> $100M 40 $2,776 $69.40 21% $100M -> $250M 34 $5,438 $159.94 17% $250M -> $500M 20 $6,713 $335.65 10% $500M -> $1B 8 $6,180 $772.50 4% >$1B 10 $53,416 $5,341.60 5% PricewaterhouseCoopers 2008/2009 [1] and 2010/2011 [2] data: [1] http://www.pwc.com/us/en/transaction-services/publications/assets/PwC-US-technology-MA-insights-2010.pdf [2] http://www.pwc.com/en_US/us/transaction-services/publications/assets/pwc-technology-mergers-acquisitions-q4-2011-outlook.pdf Tom Tierney lives in Encinitas, CA and is a member of Tech Coast Angels (www.techcoastangels.com). Also see http://en.wikipedia.org/wiki/Tech_coast_angels for more background information on the TCA.