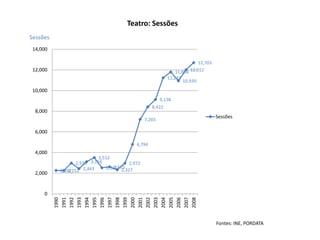
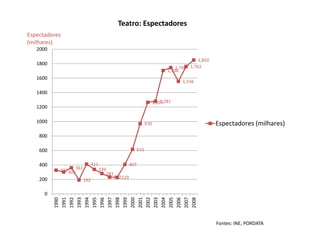
The document contains two line graphs showing data from 1990 to 2008. The first graph shows the number of theater sessions each year, ranging from around 2,000 to over 14,000 sessions. The second graph shows the number of theater spectators or attendees each year in thousands, ranging from around 200 thousand to over 1,850 thousand spectators. Both graphs indicate that theater attendance and sessions increased over the time period shown.