Download to read offline
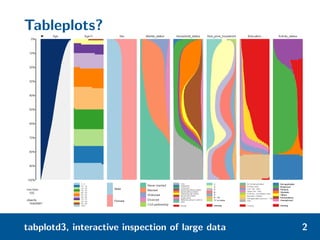
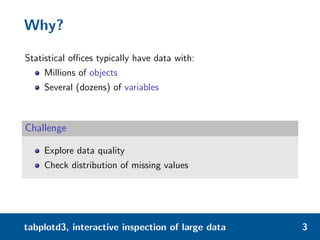

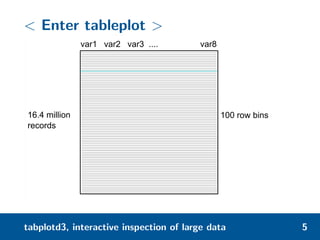
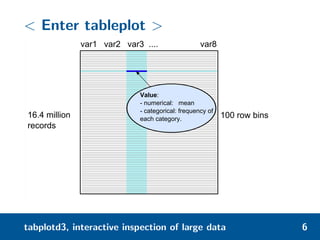
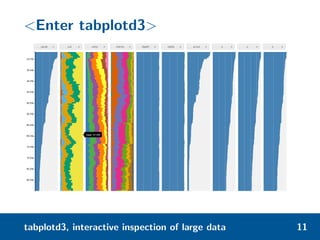


Tabplotd3 is an interactive tool for inspecting large datasets that allows zooming, inspecting values, and sorting values. It uses a technique called tableplotting to summarize datasets with millions of records and dozens of variables by binning data and plotting mean or frequency values. Tabplotd3 improves upon previous tableplot implementations by adding interactivity using d3.js to enable zooming and hovering over plots for inspection.


![Some Examples in R- [Data Visualization--R graphics]](https://cdn.slidesharecdn.com/ss_thumbnails/rchart-160729210112-thumbnail.jpg?width=640&height=640&fit=bounds)