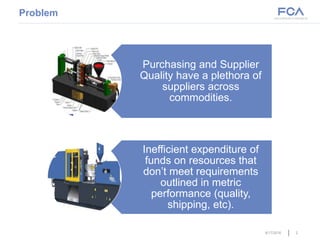
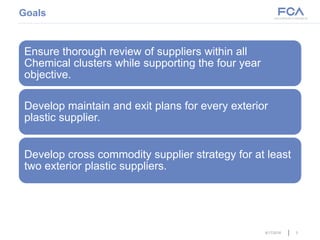
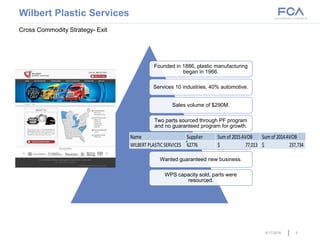
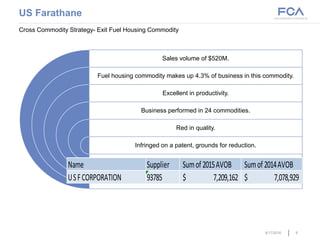
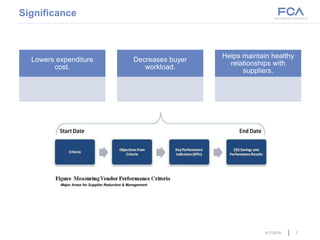
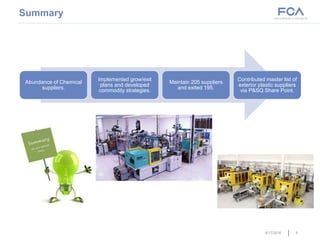
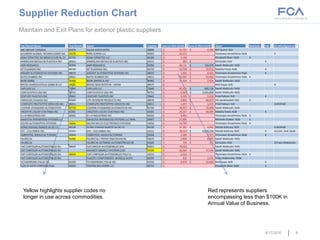
Grant Grundy
Supplier Reduction
Chemical Purchasing
Cathy Coon
Howard University, Supply Chain Mgmt.
May 2017
Auburn Hills, USA
Destination 2020:
8/17/2016
Purchasing and Supplier
Quality have a plethora of
suppliers across
commodities.
Inefficient expenditure of
funds on resources that
don’t meet requirements
outlined in metric
performance (quality,
shipping, etc).
Problem
8/17/2016 2
Goals
Ensure thorough review of suppliers within all
Chemical clusters while supporting the four year
objective.
Develop maintain and exit plans for every exterior
plastic supplier.
Develop cross commodity supplier strategy for at least
two exterior plastic suppliers.
8/17/2016 3
Compiled master list
of exterior plastic
suppliers
encompassing less
than $100K AVOB per
year.
Consulted with
Chemical buyers in
regards to
maintain/exit plans.
Developed cross
commodity strategies
for two critical
suppliers.
Roughly 400
suppliers were
examined.
(Maintain=205,
Exit=195)
Steps
8/17/2016 4
Wilbert Plastic Services
Cross Commodity Strategy- Exit
8/17/2016 5
Founded in 1886, plastic manufacturing
began in 1966.
Services 10 industries, 40% automotive.
Sales volume of $290M.
Two parts sourced through PF program
and no guaranteed program for growth.
----------------------
Wanted guaranteed new business.
WPS capacity sold, parts were
resourced.
Name Supplier Sumof 2015AVOB Sumof 2014AVOB
WILBERTPLASTICSERVICES 62776 77,013$ 237,734$
8/17/2016
US Farathane
Cross Commodity Strategy- Exit Fuel Housing Commodity
6
Sales volume of $520M.
Fuel housing commodity makes up 4.3% of business in this commodity.
Excellent in productivity.
Business performed in 24 commodities.
Red in quality.
Infringed on a patent, grounds for reduction.
Name Supplier Sumof2015AVOB Sumof2014AVOB
USFCORPORATION 93785 7,209,162$ 7,078,929$
8/17/2016
Significance
7
Lowers expenditure
cost.
Decreases buyer
workload.
Helps maintain healthy
relationships with
suppliers.
-Major Areas for Supplier Reduction & Management
8/17/2016
Summary
8
Abundance of Chemical
suppliers.
Implemented grow/exit
plans and developed
commodity strategies.
Maintain 205 suppliers
and exited 195.
Contributed master list of
exterior plastic suppliers
via P&SQ Share Point.
8/17/2016
Supplier Reduction Chart
Maintain and Exit Plans for exterior plastic suppliers.
9
Yellow highlights supplier codes no
longer in use across commodities.
Red represents suppliers
encompassing less than $100K in
Annual Value of Business.
8/17/2016 10
Thank You!
-Questions?

Supplier Reduction Presentation

  • 1.
    Grant Grundy Supplier Reduction ChemicalPurchasing Cathy Coon Howard University, Supply Chain Mgmt. May 2017 Auburn Hills, USA Destination 2020: 8/17/2016
  • 2.
    Purchasing and Supplier Qualityhave a plethora of suppliers across commodities. Inefficient expenditure of funds on resources that don’t meet requirements outlined in metric performance (quality, shipping, etc). Problem 8/17/2016 2
  • 3.
    Goals Ensure thorough reviewof suppliers within all Chemical clusters while supporting the four year objective. Develop maintain and exit plans for every exterior plastic supplier. Develop cross commodity supplier strategy for at least two exterior plastic suppliers. 8/17/2016 3
  • 4.
    Compiled master list ofexterior plastic suppliers encompassing less than $100K AVOB per year. Consulted with Chemical buyers in regards to maintain/exit plans. Developed cross commodity strategies for two critical suppliers. Roughly 400 suppliers were examined. (Maintain=205, Exit=195) Steps 8/17/2016 4
  • 5.
    Wilbert Plastic Services CrossCommodity Strategy- Exit 8/17/2016 5 Founded in 1886, plastic manufacturing began in 1966. Services 10 industries, 40% automotive. Sales volume of $290M. Two parts sourced through PF program and no guaranteed program for growth. ---------------------- Wanted guaranteed new business. WPS capacity sold, parts were resourced. Name Supplier Sumof 2015AVOB Sumof 2014AVOB WILBERTPLASTICSERVICES 62776 77,013$ 237,734$
  • 6.
    8/17/2016 US Farathane Cross CommodityStrategy- Exit Fuel Housing Commodity 6 Sales volume of $520M. Fuel housing commodity makes up 4.3% of business in this commodity. Excellent in productivity. Business performed in 24 commodities. Red in quality. Infringed on a patent, grounds for reduction. Name Supplier Sumof2015AVOB Sumof2014AVOB USFCORPORATION 93785 7,209,162$ 7,078,929$
  • 7.
    8/17/2016 Significance 7 Lowers expenditure cost. Decreases buyer workload. Helpsmaintain healthy relationships with suppliers. -Major Areas for Supplier Reduction & Management
  • 8.
    8/17/2016 Summary 8 Abundance of Chemical suppliers. Implementedgrow/exit plans and developed commodity strategies. Maintain 205 suppliers and exited 195. Contributed master list of exterior plastic suppliers via P&SQ Share Point.
  • 9.
    8/17/2016 Supplier Reduction Chart Maintainand Exit Plans for exterior plastic suppliers. 9 Yellow highlights supplier codes no longer in use across commodities. Red represents suppliers encompassing less than $100K in Annual Value of Business.
  • 10.