Download as PDF, PPTX
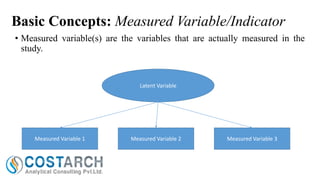
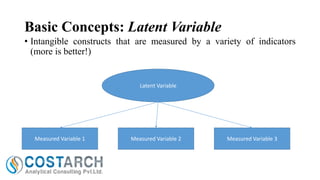
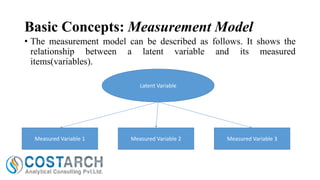
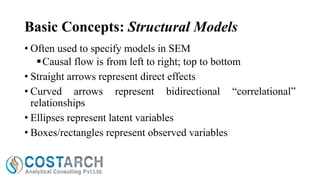
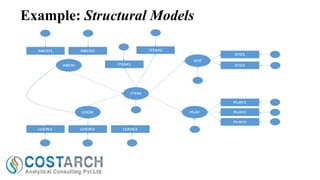
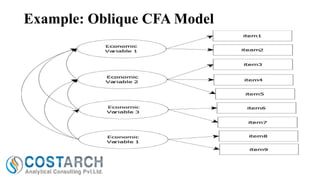
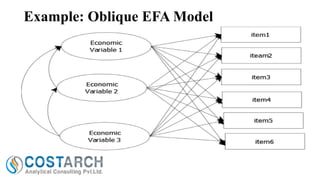
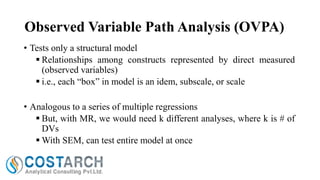
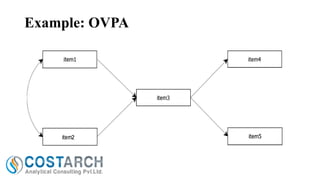
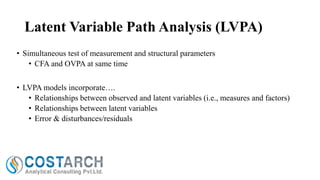
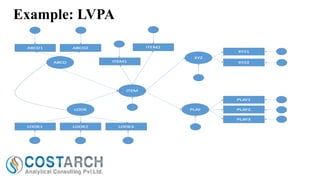
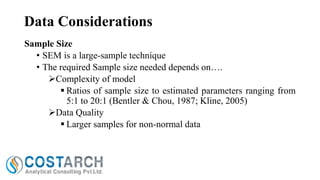

This document provides an introduction to structural equation modeling (SEM) concepts. It defines key terms like measured variable, indicator variable, latent variable, measurement model and structural model. It explains that measured variables are directly observed, while latent variables are abstract constructs measured indirectly through multiple indicators. It describes measurement models as showing the relationships between latent variables and their measured items, and structural models as specifying relationships between latent and observed variables with arrows. It provides examples of confirmatory factor analysis (CFA), path analysis with observed and latent variables, and discusses data sample size considerations for SEM.