Download to read offline

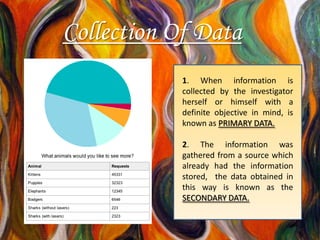
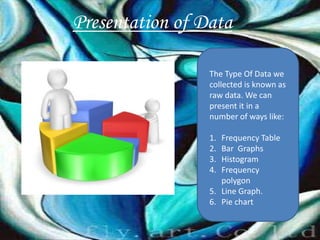
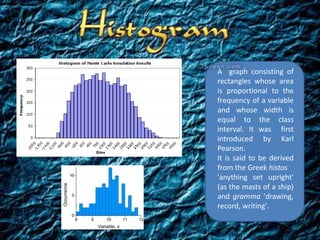
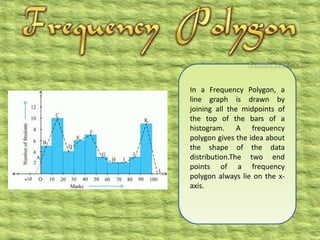


This document discusses statistics and its history. It defines statistics as the study of collecting, organizing, analyzing, and presenting data. It notes that the earliest known use of statistics dates back to the 5th century BC in a book by Al-Kindi describing how to use statistics and frequency analysis to decipher encrypted messages. The document also discusses primary and secondary data collection and different ways to present raw data, including frequency tables, bar graphs, histograms, frequency polygons, line graphs, and pie charts.